Wave in the Currency Sea: May 7 Bitcoin (BTC) Market Analysis Reference:
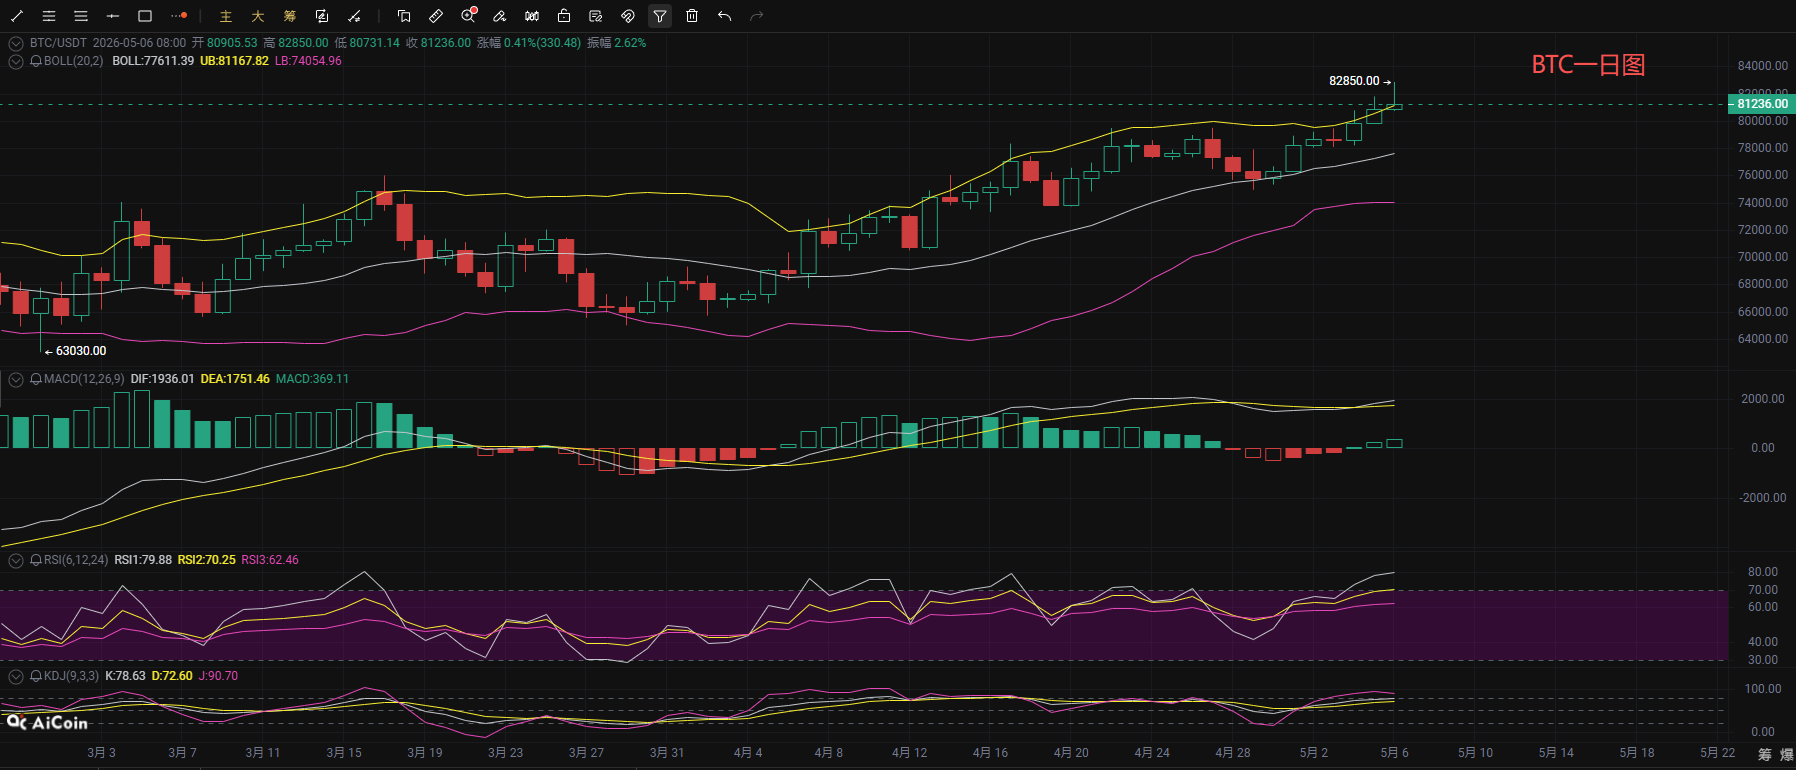
Recently, Bitcoin has continued to experience an overall upward trend with fluctuations. Yesterday, the price aggressively surged and broke through recent high points, rising to around 82850 before facing resistance and retreating. The current trend is consolidating around 81300. From a daily chart perspective, Bitcoin is currently in a clear ascending channel, with the price steadily moving upward supported by the middle band of the Bollinger Bands, EMA7, EMA15, and other moving averages. Although there was slight pressure upon touching the upper band around 82850, the overall bullish trend remains unchanged; the MACD indicator continues to increase, with the DIF line remaining above the DEA line, while the RSI indicator, although in a high position, has not entered severe overbought territory. The KDJ indicator is also still operating in a strong range, showing that market bullish power remains dominant, and there is a high probability of maintaining a high-level fluctuation or a fluctuating upward pace in the short term. Attention must be paid to the resistance test near the upper band of the Bollinger Bands and previous high points.
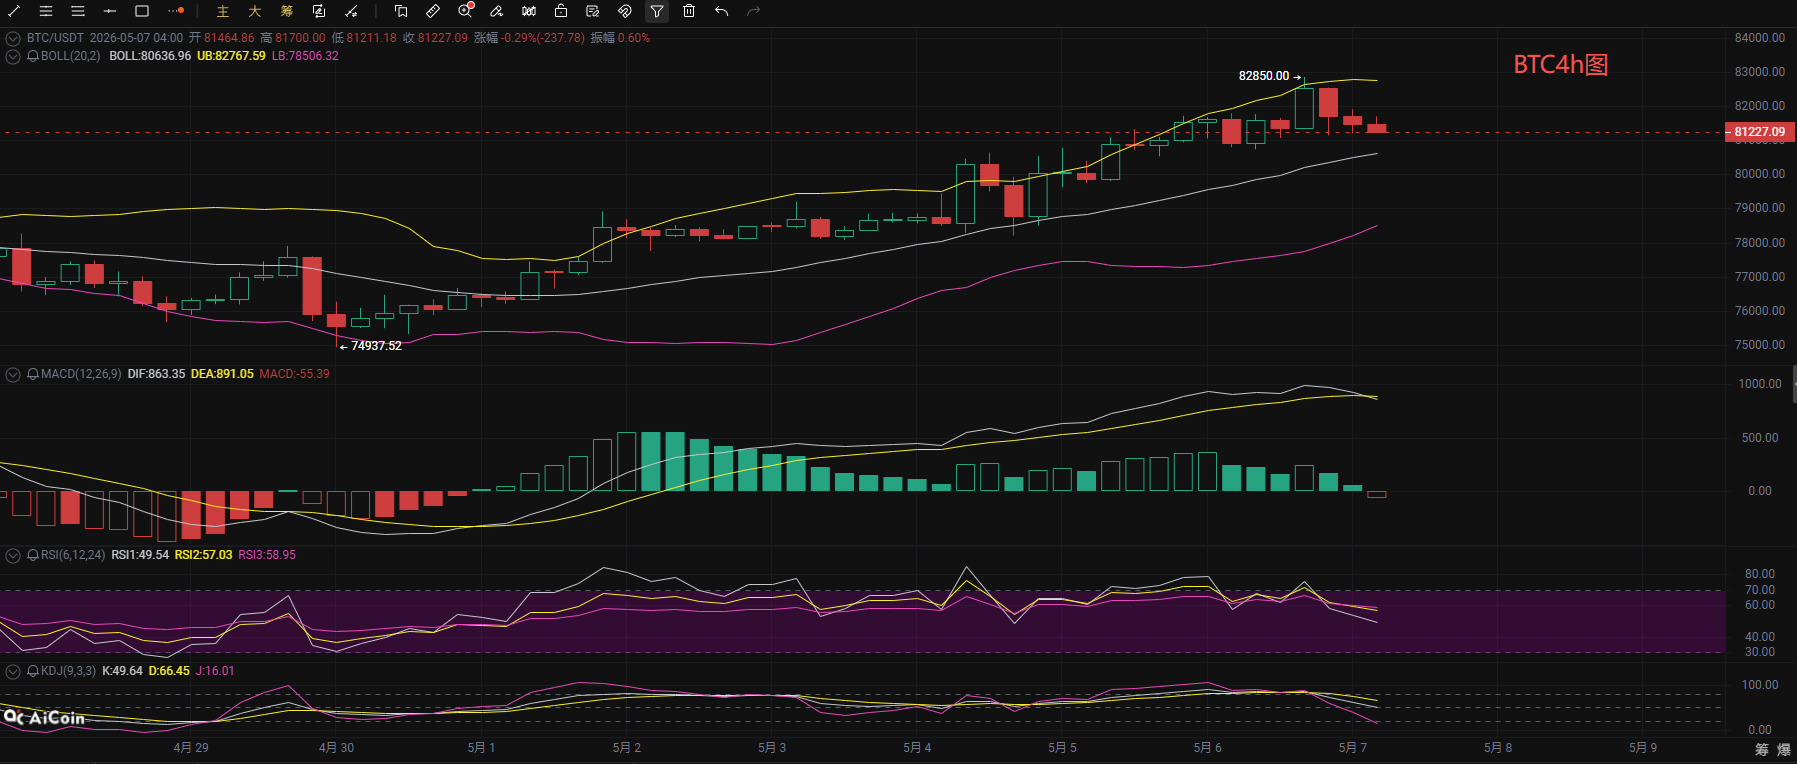
On the 4-hour chart, the price retraced and adjusted after reaching the high point of 82850. The MACD indicator's DIF line has crossed below the DEA line, forming a death cross, with the histogram turning negative, indicating a significant decrease in bullish momentum; simultaneously, the RSI indicator has turned down from a high position, and the KDJ indicator has also formed a death cross and is moving towards a lower position, indicating clear short-term adjustment signals. Currently, the price is still receiving support near the EMA15 and EMA20 moving averages and has not broken below the ascending trend line, presenting an overall pattern of high-level fluctuations and adjustments. The upper area around 82850 is a strong resistance level, while the lower range of 80500-80000 is critical support. Future trends need to focus on the strength of support in this range; if support holds effectively, there is a high probability of a return to the upward fluctuation pace. In terms of trading strategy, if the support range stabilizes, consider light positions to test buy, and if encountering resistance near the resistance level, reduce positions short-term; if a breakthrough occurs, follow the trend.
Wave in the Currency Sea: May 7 Bitcoin Short-term Reference:
Long Position: Buy in the range of 79800-80800, stop loss 500 points, target at 81000-82000,
Short Position: Sell in the range of 83000-82000, stop loss 500 points, target at 81500-80500,
【The above analysis and strategy are for reference only. Please bear the risk yourself. The article may be subject to delays in review and release, and the strategy may not have timely effectiveness. Do not operate blindly】

This content is originally shared by 【Wave in the Currency Sea】 and represents personal opinions. The article may have delays in sending and is for reference only. Do not operate blindly! Want to receive more real-time trading signals daily? Then follow my public account where you can engage in online technical learning and learn about knowledge related to exit strategies. I have years of research experience in the market and focus on the major trends in the cryptocurrency space. Mainly responsible for analyzing and guiding investment operations of BTC, ETH, SOL, BCH, and other cryptocurrencies. Welcome to research and learn together.
免责声明:本文章仅代表作者个人观点,不代表本平台的立场和观点。本文章仅供信息分享,不构成对任何人的任何投资建议。用户与作者之间的任何争议,与本平台无关。如网页中刊载的文章或图片涉及侵权,请提供相关的权利证明和身份证明发送邮件到support@aicoin.com,本平台相关工作人员将会进行核查。