Wave of the Coin Sea: 5.7 Ethereum (ETH) Market Analysis Reference:
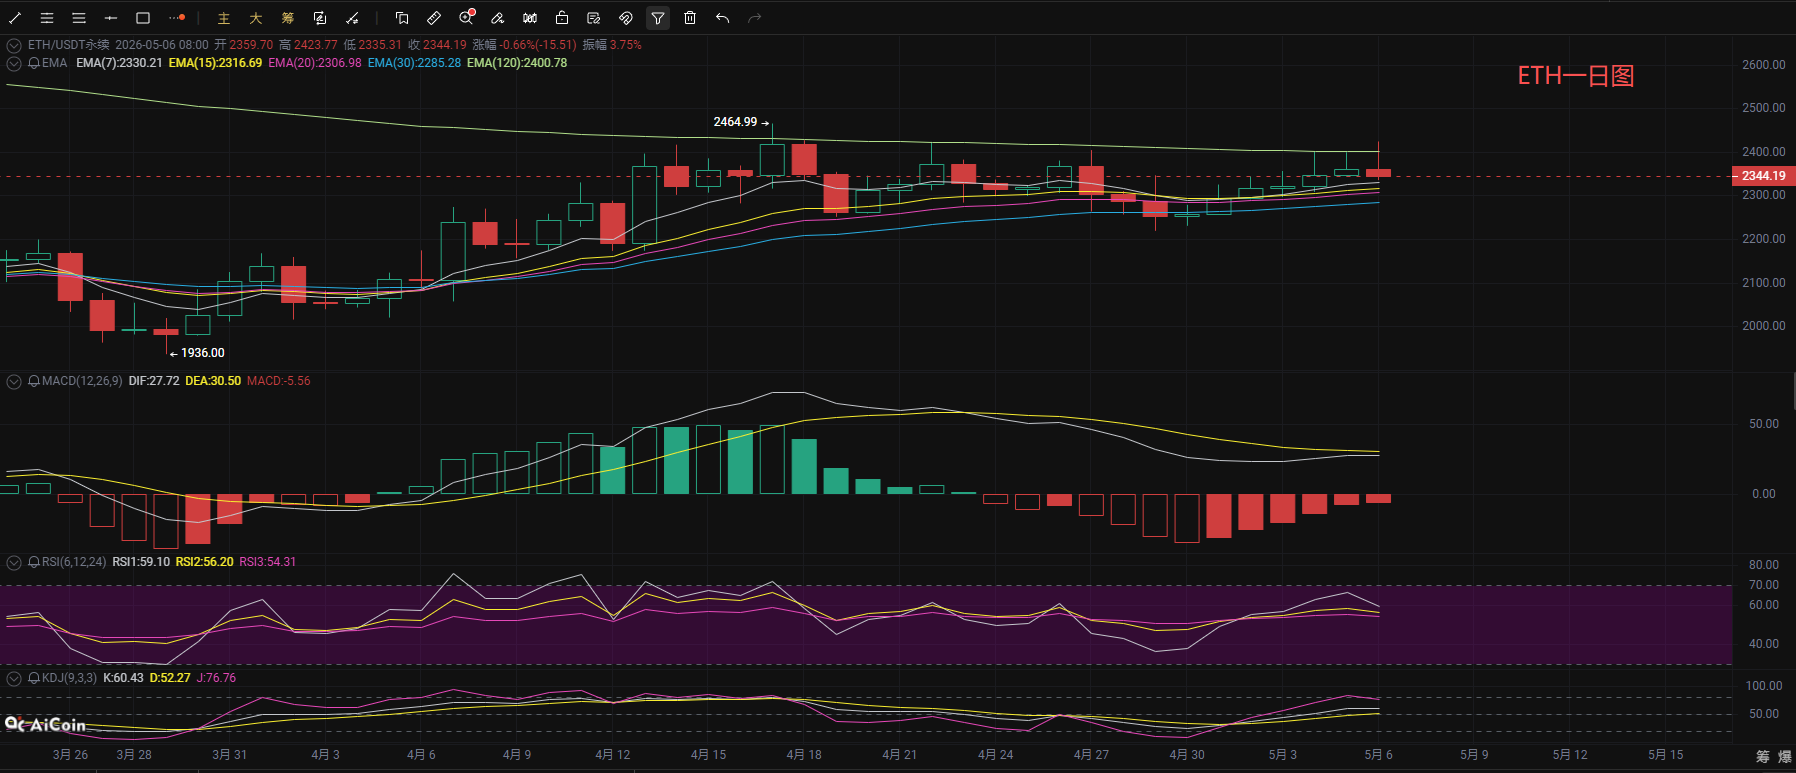
Ethereum's recent market has maintained a fluctuating upward trend, testing the upper pressure point yesterday and falling back. As of the time of writing, the coin price is around 2345. Observing the daily chart, Ethereum's daily line is currently in a high-level fluctuation stage after an upward trend, with the price consistently above the Bollinger Bands middle line and the short-term EMA. The overall bullish trend remains intact. The upper track of the Bollinger Bands constitutes strong resistance, while the middle track around 2323 forms key support. In terms of indicators, the MACD's DIF and DEA are still operating above the zero axis, with a reduction in selling volume; the RSI indicator is currently maintaining in the 55-65 range. Although it has not entered the overbought zone above 70, the short-term strength line is in a high position, indicating overall bullish momentum but with signs of dullness; the KDJ three lines are synchronously moving upwards, with the J line slightly turning. Overall, the bullish trend on the daily line level continues, with the current focus on high-level fluctuations to correct indicators, and no clear reversal signals have appeared. The short-term market is likely to continue the strong fluctuation rhythm.
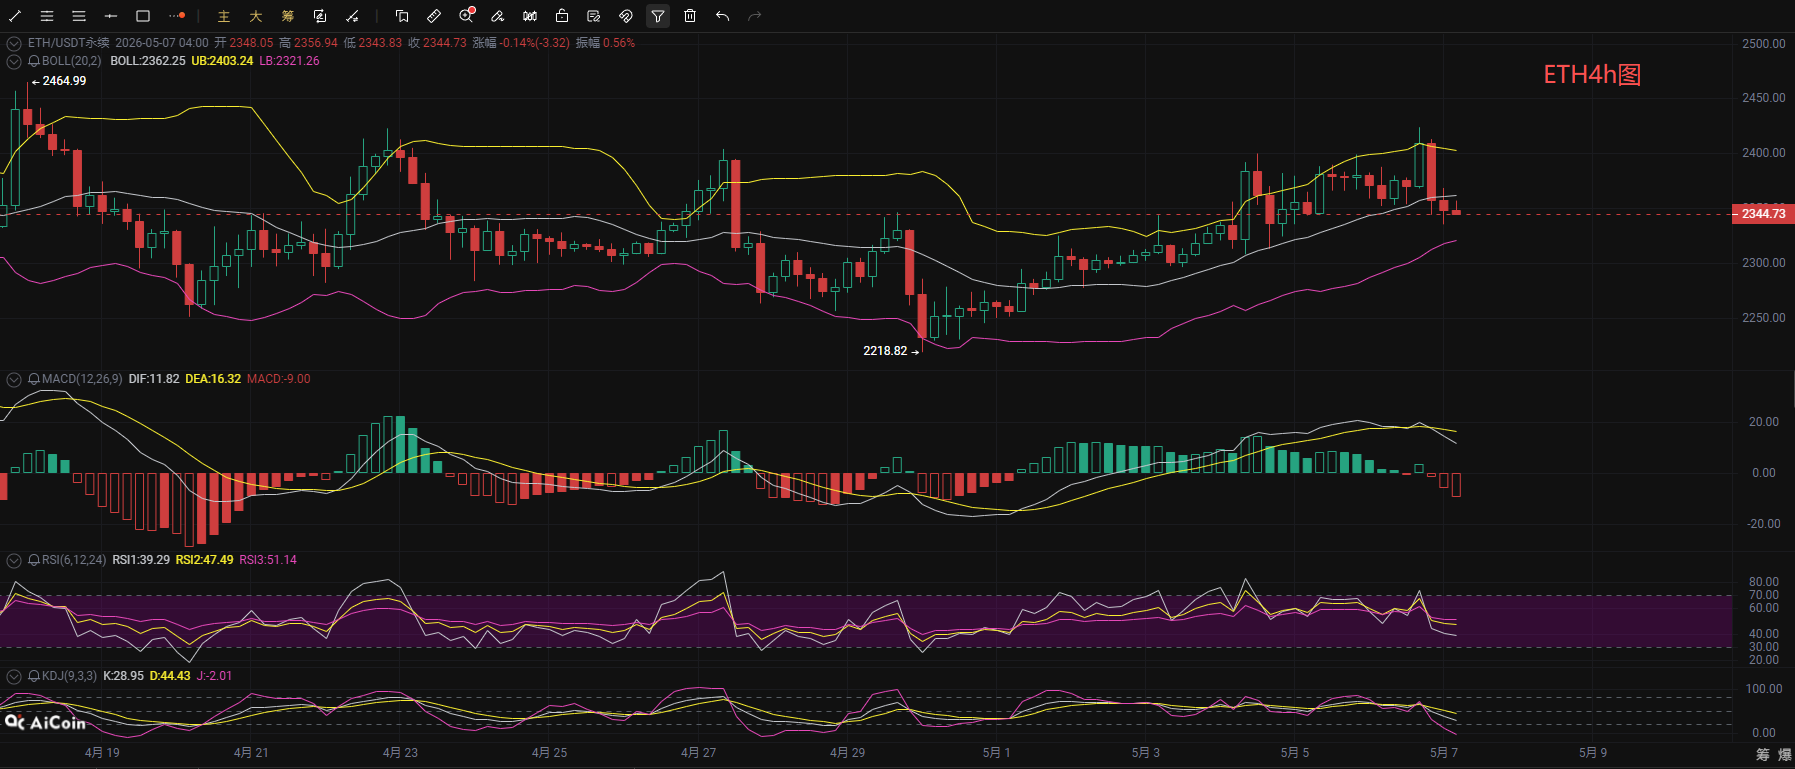
The 4-hour trend of Ethereum shows a clear signal of short-term adjustment. The price has encountered resistance at the high point of 2423 and is currently below the Bollinger Bands middle line along with short-term EMAs like EMA7 and EMA15, presenting obvious signals of short-term weakening from a technical perspective; the MACD indicator’s DIF has crossed below the DEA forming a death cross, with selling momentum continuously releasing and bullish momentum significantly diminishing. At the same time, the RSI indicator has dropped from a high position below 50, and the KDJ indicator has formed a death cross downward. The three resonate to confirm the short-term adjustment trend. The 2400-2420 range above is a zone of multiple resistances, while the lower Bollinger Bands lower track around 2321 and the 2300 line are key supports. If the support level can hold, the price is likely to enter a range of fluctuations; if the support is lost, the retracement space will further open up. Overall, the short-term trend is primarily weak fluctuations, and attention must be paid to the volume and support performance in the support area. It is not recommended to blindly chase high prices, and entering long positions on dips is more prudent.
Wave of the Coin Sea: 5.7 Ethereum Short-term Reference:
Short Position: 2420-2390 range short, stop loss 30 points, target at 2360-2310,
Long Position: 2305-2335 range long, stop loss 30 points, target at 2360-2400,
[The above analysis and strategies are for reference only. Please bear the risks yourself. The article review and publication may be delayed, and the strategies may lack timeliness. Do not operate blindly.]

This content is originally shared by 【Wave of the Coin Sea】 and represents personal views only. The article may be delayed in sending, for reference only, and do not operate blindly! If you want to get more real-time trades daily? Then follow my public account! Here, you can learn online market technology and understand knowledge related to positioning and exiting. I have years of research experience in the market, focusing on the major trends in the cryptocurrency world. Mainly responsible for analyzing and guiding investment operations of BTC, ETH, SOL, BCH, and other coins. Welcome to study and research together.
免责声明:本文章仅代表作者个人观点,不代表本平台的立场和观点。本文章仅供信息分享,不构成对任何人的任何投资建议。用户与作者之间的任何争议,与本平台无关。如网页中刊载的文章或图片涉及侵权,请提供相关的权利证明和身份证明发送邮件到support@aicoin.com,本平台相关工作人员将会进行核查。