Cryptocurrency Scholar: Current Price of Ethereum 2345: Moving Averages Bullish Alignment, Is a Pullback a Buying Opportunity? Latest Market Analysis and Trading Suggestions
The current price of Ethereum is 2345. Watching ETH hover around 2345, I suddenly understood a truth: the market never goes according to your expectations. Many times, our losses are not because we can't understand the market, but because we can't control our hands. We always want to catch every fluctuation, but instead we get harvested by the volatility. Those who can truly survive in the cryptocurrency space are those who know how to wait for the wind to come; maintaining a steady mindset is more important than staring at the market.
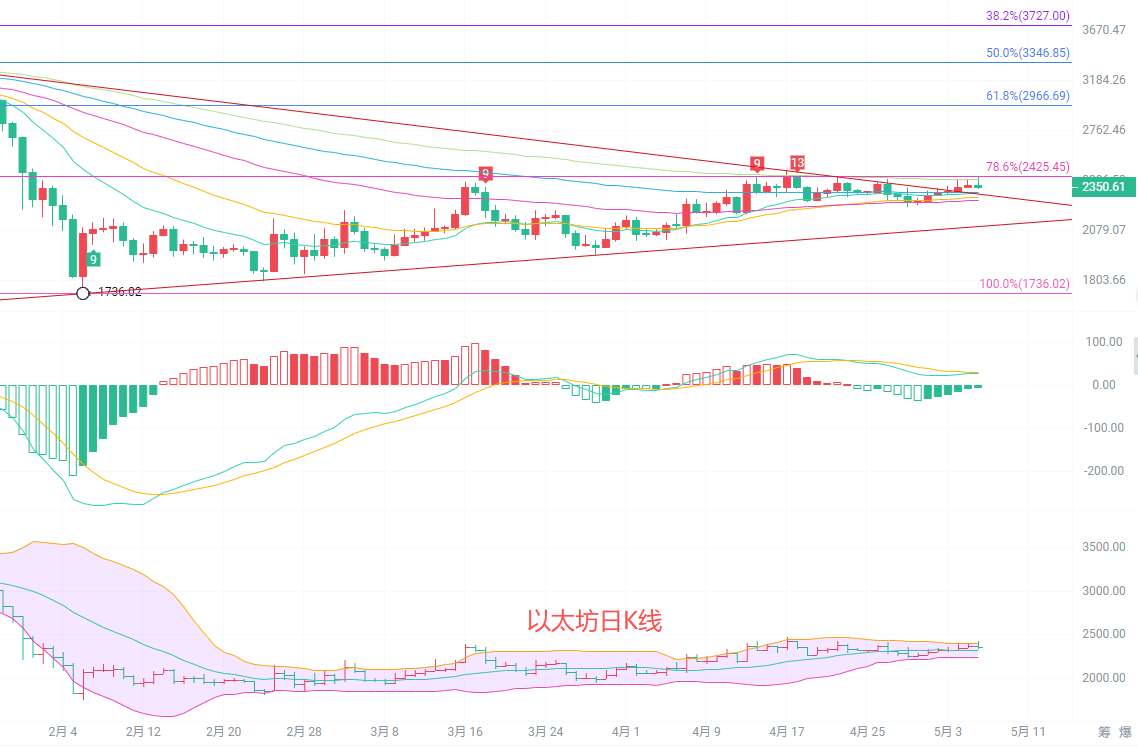
The daily candlestick is currently closing around 2345, with the price firmly above all EMAs (15/30/60/90/120), maintaining a healthy upward arrangement and gradually increasing support. The MACD indicator is operating above the zero line; although the red bars have not significantly expanded, there is no obvious top divergence, and the upward momentum is still continuing. The Bollinger Bands are opening upward, with the price moving between the middle and upper bands. The middle band near 2232 is a strong mid-term support; as long as it doesn't fall below this range, the daily level rebound trend is not damaged, and there is still room for short-term upward movement.
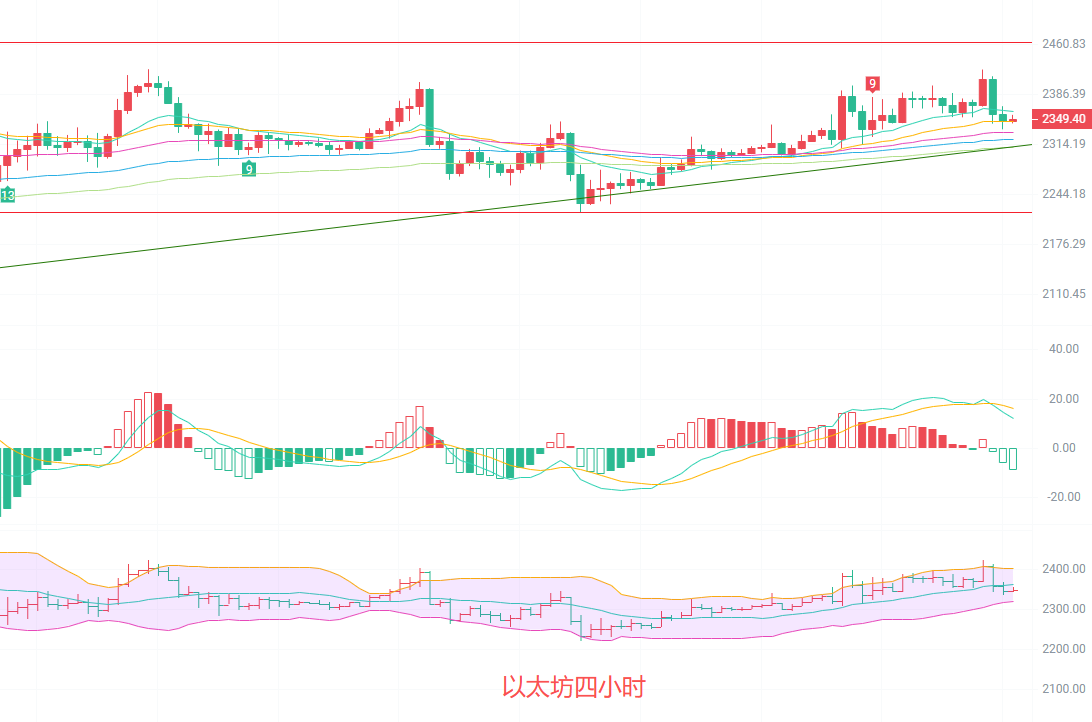
The four-hour candlestick is currently in a slight pullback phase after rising, with the price under pressure around EMA15, and although the moving average system remains in a bullish arrangement, the short-term upward pace has clearly slowed. The MACD indicator's red bars continue to shrink, and the DIF has formed a dead cross with the DEA, indicating a release of downward momentum and increased short-term pullback risk. The Bollinger Bands have narrowed, with the price falling from the upper band towards the middle band; the middle band around 2362 has turned from support to resistance, while the lower band at 2321 is a key short-term support; if broken, it is likely to seek support around 2280.
Short-term Reference: (Practical data has been updated; please consult the author for details)
If it goes up from 2350 to 2300, stop-loss at 2270, target at 2400 to 2450
If it goes down from 2400 to 2450, stop-loss at 2480, target at 2350 to 2300
The trend on the previous day was bullish, and short positions should only be for short-term arbitrage; heavy positions are not recommended. If the direction is wrong, strict stop-loss must be implemented; do not hold the position.

Warm Reminder: The above content is created solely by the author’s public account. The advertisements at the end of the article and in the comments section are unrelated to the author, please discern carefully, thank you for reading.
免责声明:本文章仅代表作者个人观点,不代表本平台的立场和观点。本文章仅供信息分享,不构成对任何人的任何投资建议。用户与作者之间的任何争议,与本平台无关。如网页中刊载的文章或图片涉及侵权,请提供相关的权利证明和身份证明发送邮件到support@aicoin.com,本平台相关工作人员将会进行核查。