Crypto Circle Academician: 5.7 Bitcoin Short-term Pullback Risk Warning: How to Enter from the North, How to Test from the South? Look Down! Latest Market Analysis and Operational Suggestions
Bitcoin's current price is 81300; can it really push higher? Are you still struggling over whether to chase with more positions, fearing that chasing high will get you trapped? Right now, BTC is in a typical small fluctuation within a trend; don’t let a few bearish candles throw you into panic, and don’t let bullish candles cloud your judgment to make reckless bets. As long as the daily upward trend is intact, don’t keep thinking about shorting by hitting the top; but if the 4-hour momentum is weakening, don’t blindly chase positions at high. Make sure to set a stop-loss for contracts; don’t cling to the fantasy that it will bounce back after holding out, as the waterfall in the crypto circle never offers you a chance to regret. Hold your spot positions well, don’t get washed out by short-term fluctuations, prioritize stability, and you’ll survive to see the market realize its potential.
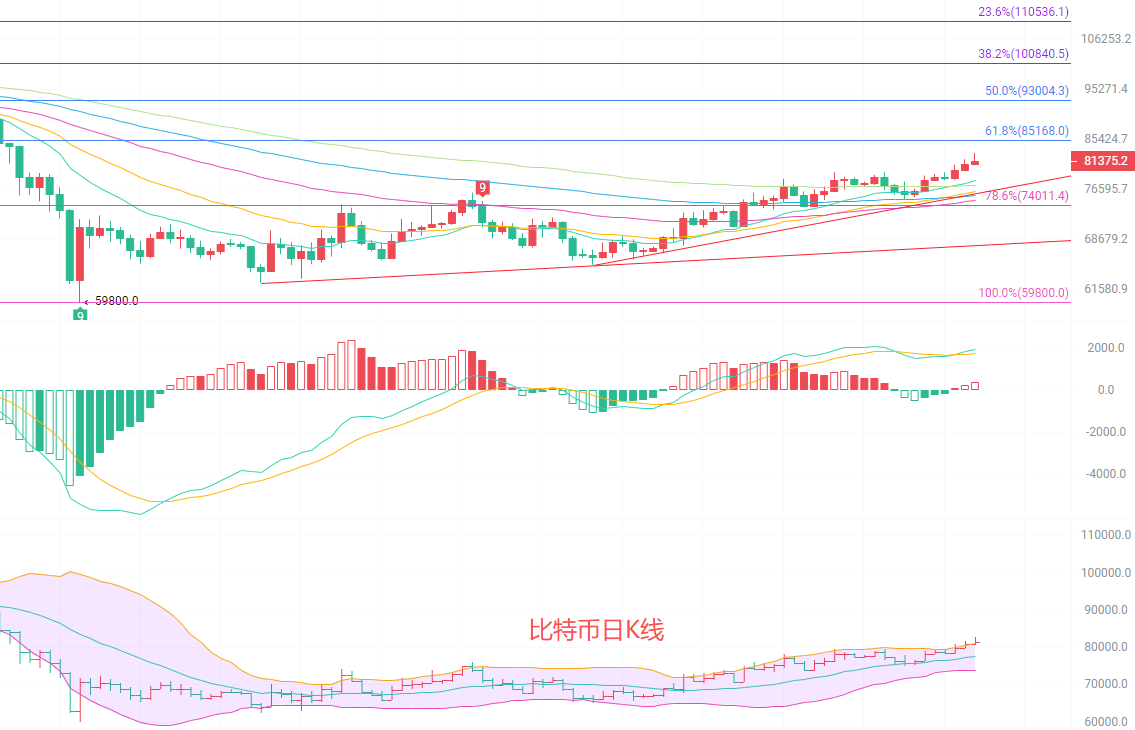
The daily K-line upward trend remains strong, with prices firmly standing above all EMA moving averages, perfectly arranged upward with layers of support. The MACD red histogram maintains a growing state, with a golden cross continuing above the zero line, and the upward momentum shows no obvious exhaustion. The Bollinger Bands are opening upwards, and prices are steadily rising along the upper band. The upper Bollinger Band at 81156 has turned from resistance to support, and the current price of 81300 is within a strong range. As long as the daily line does not fall below the Bollinger Band middle line around 77500, the upward trend will not change, and there is still room for a short-term push higher, so there is no need to be overly bearish.
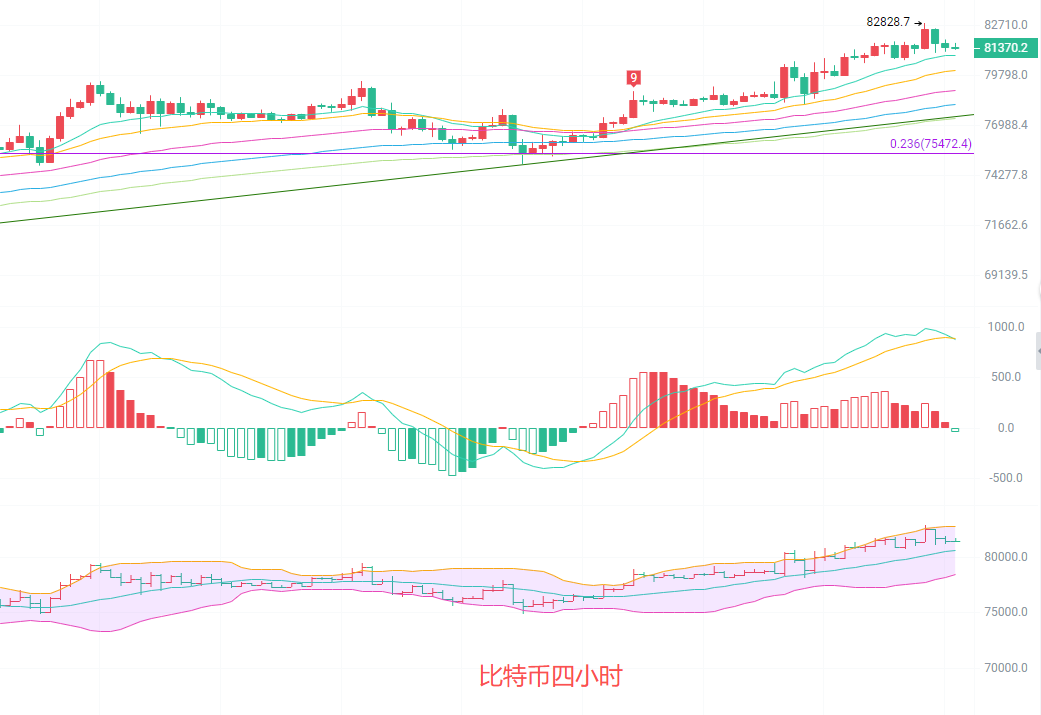
The four-hour K-line is showing signs of weakness in the short-term upward trend, with prices under pressure near 82800 retreating. The MACD red histogram is continuously shortening, and the DIF is turning down, about to form a dead cross with DEA, indicating a clear weakening of short-term upward momentum. The Bollinger Bands are narrowing, and prices have retreated from the upper Bollinger Band towards the middle band, with the middle Bollinger Band at 80600 being a key short-term support. If this support does not hold, it is very likely to test the lower band support near 78400. Although the moving averages are still arranged upward, the short-term EMA15 shows signs of turning, increasing the probability of short-term fluctuations and pullbacks, making chasing high more risky.
Short-term strategy reference: Follow the big cycle trend, with small stop-losses and quick in-and-out.
For entering from 81000 to 80500 upward, set a stop-loss at 80000, with targets looking at 82000 to 82500, and if it breaks, looking at 83500.
For entering from 82500 to 83000 downward, set a stop-loss at 83500, with targets looking at 81500 to 81000, and if it breaks, looking at 80500.
If you are trading contracts, don’t bet your life savings; maintain an even mindset. Ups and downs are the norm in the market, and don’t let short-term fluctuations disrupt your rhythm.

Kind reminder: The above content is solely created by the author on the public account. The advertisements at the end of the article and in the comments section are unrelated to the author. Please carefully discern, and thank you for reading.
免责声明:本文章仅代表作者个人观点,不代表本平台的立场和观点。本文章仅供信息分享,不构成对任何人的任何投资建议。用户与作者之间的任何争议,与本平台无关。如网页中刊载的文章或图片涉及侵权,请提供相关的权利证明和身份证明发送邮件到support@aicoin.com,本平台相关工作人员将会进行核查。