The holidays are ending, right? I found a particularly stable time pattern — almost every time during the second half of a holiday, the market tends to rise. In the future, everyone can remember this time strategy: in the second half of the holiday, try cautiously to go long; the win rate is often higher.
On the first day back from the holiday, we continue to tackle practical indicators — Fibonacci. Last time we discussed using Fibonacci retracements to catch bottoms; today we'll directly advance to teaching everyone how to use Fibonacci extensions for precise take profit. Currently, hot money in the market is mainly concentrated in the AI sector; friends following the U.S. stock market should be able to feel the significant change in market style. Identifying the take profit points to secure profits is far more important than blindly placing orders.
The core function of Fibonacci extensions is to predict future target price levels after the main trend resumes. Like the retracement lines, it can locate support and resistance, the biggest difference lies in the direction of drawing lines. Just talking about theory isn't enough; let's directly combine it with charts for practical operation.


Today, I will guide everyone step by step on how to use this tool, from how to draw it, how to select points, to how to set take profits, all practical insights.
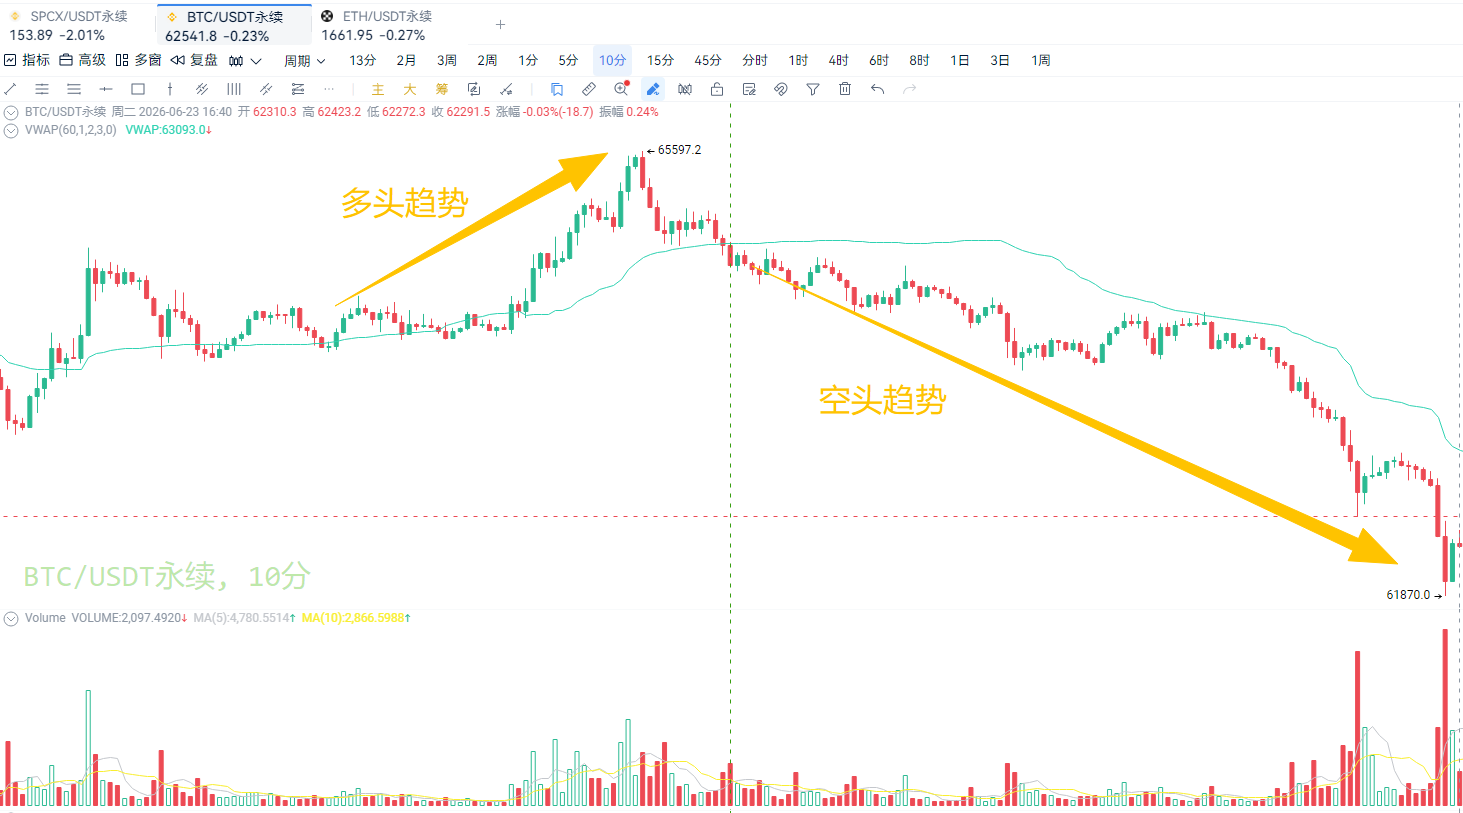
Let’s discuss the commonly used methods in the market; the logic is particularly clear: first identify the current dominant trend, wait for a counter-reversal in the market, and then re-follow the main trend; then apply the extension ratios to this counter-movement — for an upward trend, pull from the previous low to high, and for a downward trend, do the opposite; draw horizontal lines at the corresponding ratio levels, looking for resistance when the trend is rising and support when it is falling. These levels are our take profit targets for trend-following trades.
To simplify it into a straightforward expression: first determine the trend, then find the naturally occurring highs and lows to draw lines, and finally use the results from those lines to set take profits, ensuring steady profit collection.
Three numbers in Fibonacci that are worth memorizing: 0.382, 0.5, 0.618; regardless of whether it’s retracement or take profit, all depend on these three golden ratios. When taking profits, you can also include 1.0 as a target level for letting go and gambling.
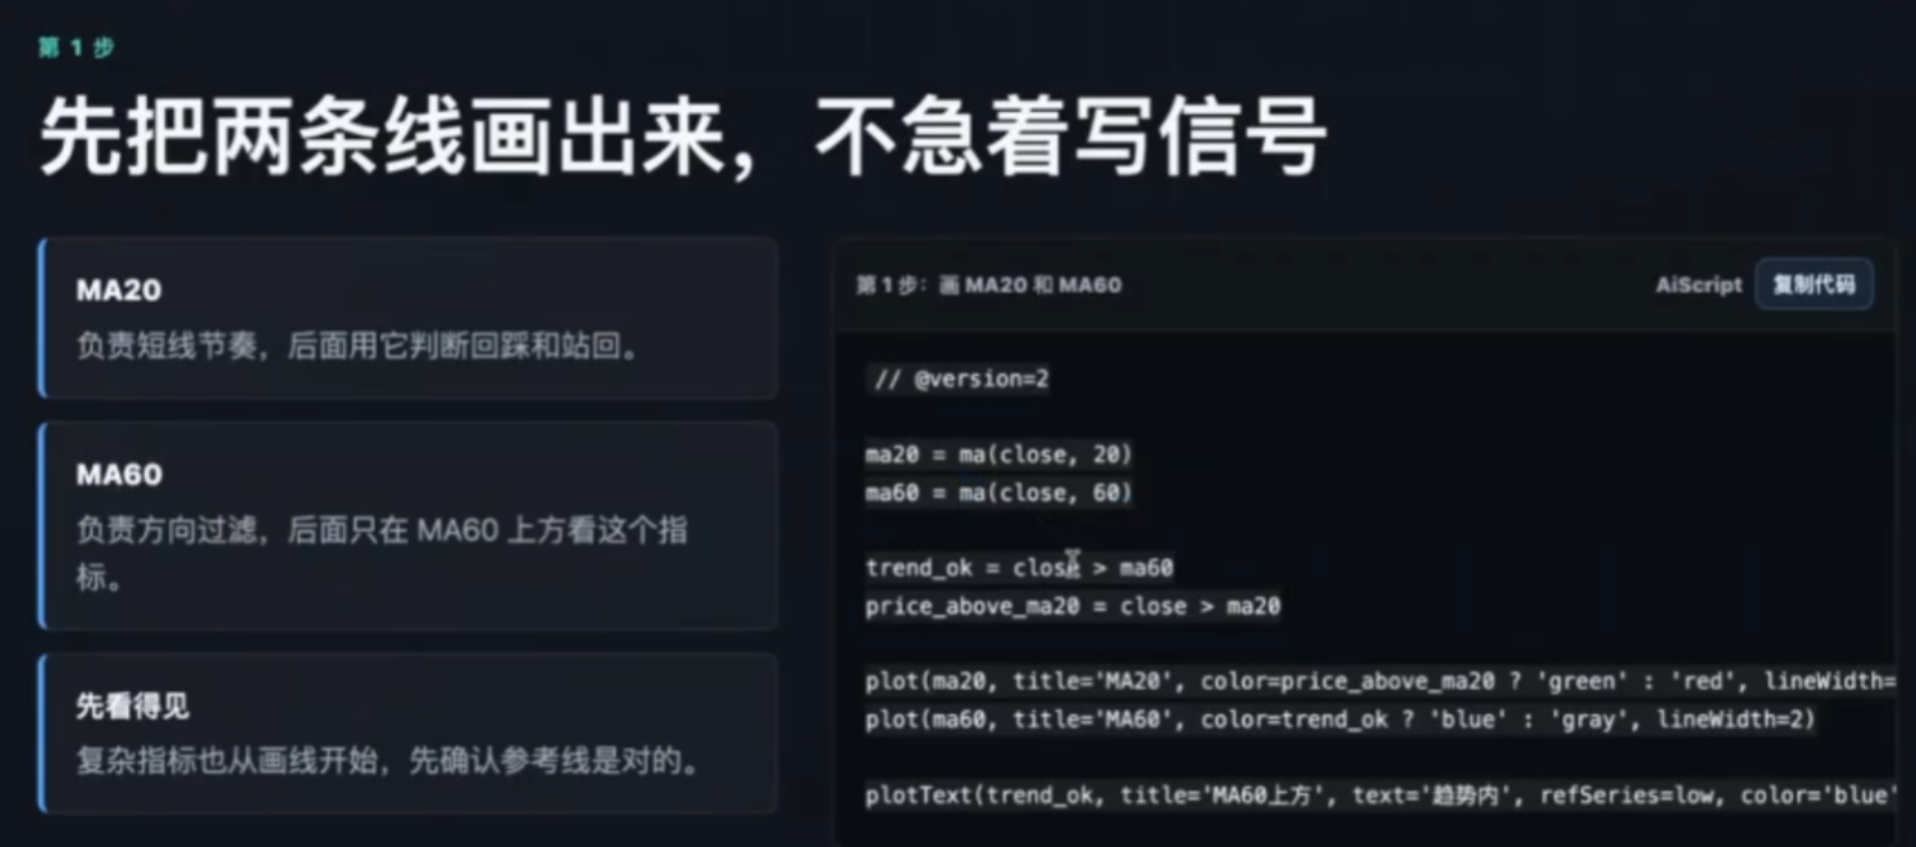
There is a particularly valuable question in the comments — how to select the highs and lows in the chart? Let’s follow the logic step by step (Image 3). The first step is to determine the trend. When the market reaches point A, find the nearest high and low points that the market has truly formed, and this is the essence of drawing Fibonacci lines — follow the market, never follow your own buy/sell points.
The extension line we discussed today includes one key component more than the retracement line: the retracement point. To draw an extension line, you must accurately identify three core points: the high point, the low point, and the retracement point. Let me give you a practical example: if you buy in the 4-5 range, when the market reaches point B, select the three points as follows: low point 1, high point 3, and retracement point 4. When linked together, these three points form a standard Fibonacci extension line, allowing for clear calculation of target take profit prices.

Here I must emphasize: absolutely do not draw lines based on your own buy/sell points! Market movements will not follow your positions. If you draw based on your own points, all signals will be wrong. Many friends are unsure whether they can select a low point between 2-3? It is indeed possible; the distinction lies in whether you are making small wave trades or large trends. For example, the market segment between 2-3 has also retraced to the crucial 0.618 position.

Here’s a little advanced suggestion: if you have time, you can look at the fractals, strokes, and segmentations in the Chande theory. In Chande theory, one stroke requires at least 5 K lines and has clear time dimension requirements; combined with K line movements, selecting highs and lows will be much more accurate. You need to adapt to different cycles flexibly: when daily and weekly lines are synchronously declining, shorter cycles will fluctuate back and forth, suitable for grid trading. After the consolidation phase, increase the cycle level, look for previous key highs and lows, prioritize the previous low points, and ignore the small fluctuations in between for a steadier direction.

When drawing lines, you can add the 0.5 level, keeping a close watch on the 0.382, 0.5, 0.618 as the three core take profit levels.

When prices reach these levels, it’s advisable to take profits in batches — you can first take out your principal or reduce your position by half, depending on your trading strategy. As long as you draw the lines correctly, you will clearly know which price levels are safe zones, and the risk will significantly increase after breaking through. In fact, many analysts' target prices in the market are fundamentally based on Fibonacci extension drawings. Mastering this method will provide your judgment with data and support, rather than relying on blind orders.
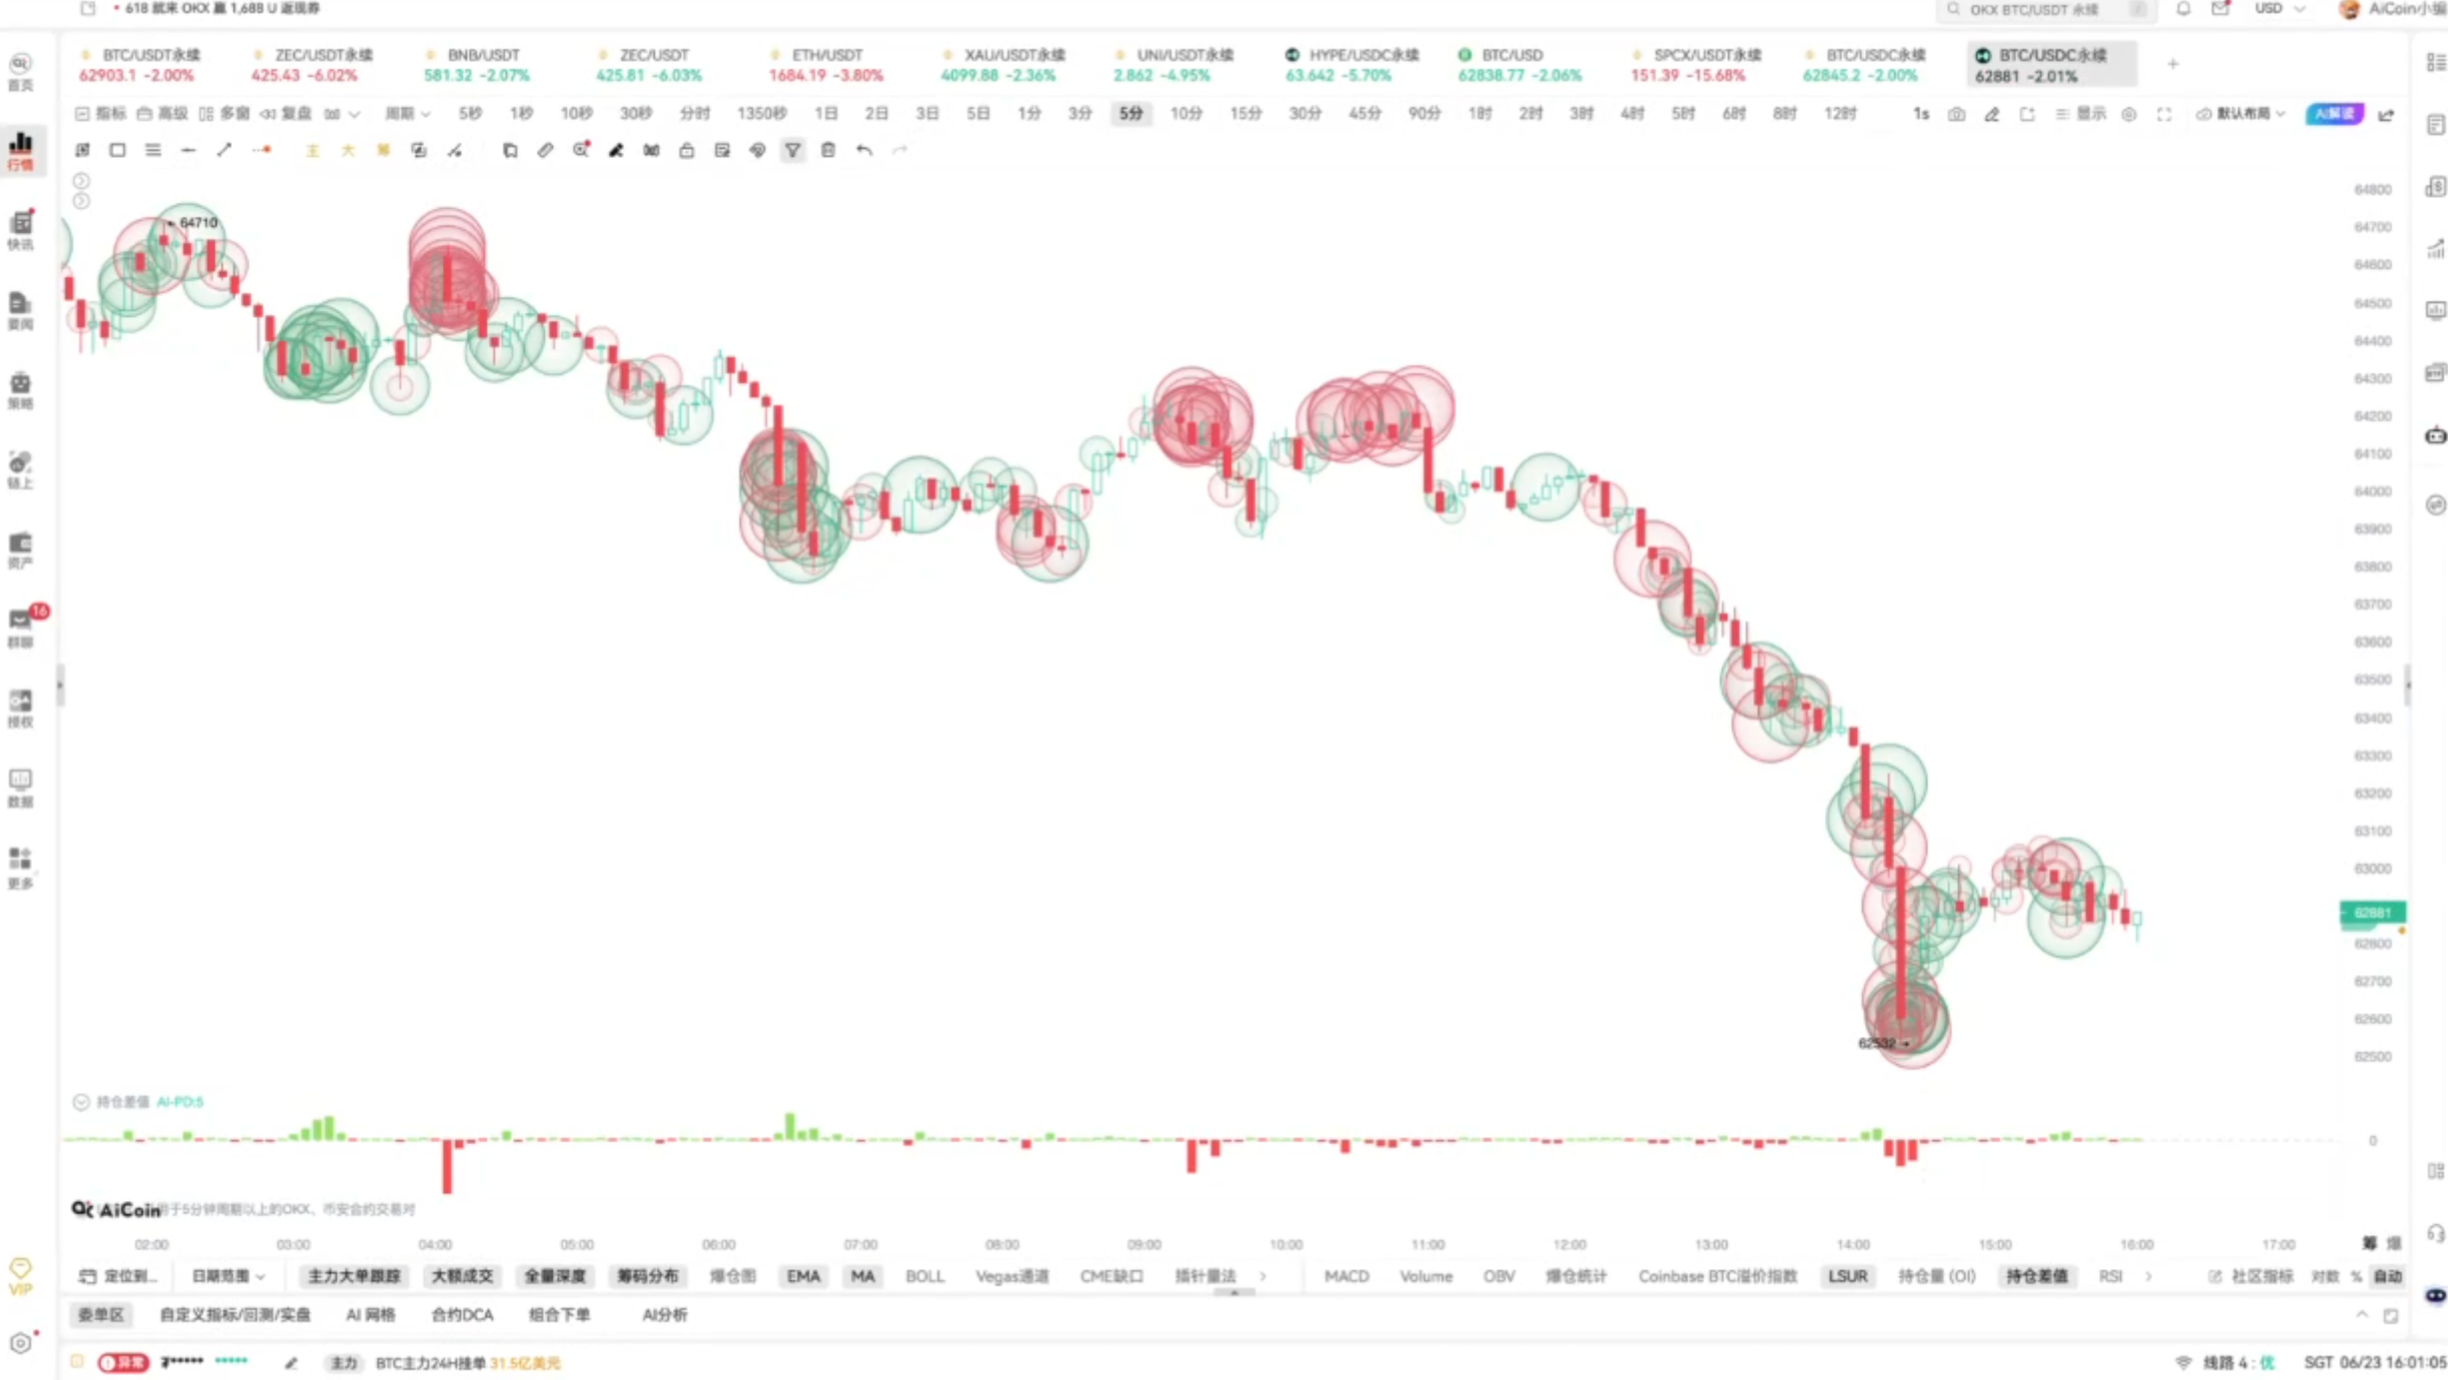
Let me provide you with a visual reference chart for better understanding.

Finally, a reminder: the essence of Fibonacci is the support/resistance levels formed by market consensus. It’s best to combine it with indicators like EMA, MACD, and RSI to achieve multi-indicator resonance, which will further increase the accuracy.
That’s all for today’s practical content. Everyone should digest this well and practice drawing lines so that taking profits will be based on rules instead of feelings.
This article only represents the author's personal views and does not represent the position or views of this platform. This article is for information sharing only and does not constitute any investment advice to anyone.
免责声明:本文章仅代表作者个人观点,不代表本平台的立场和观点。本文章仅供信息分享,不构成对任何人的任何投资建议。用户与作者之间的任何争议,与本平台无关。如网页中刊载的文章或图片涉及侵权,请提供相关的权利证明和身份证明发送邮件到support@aicoin.com,本平台相关工作人员将会进行核查。