Crypto Circle Scholar: The daily bullish trend for Bitcoin at 56 remains unchanged, but the 4-hour overbought condition requires caution. How to operate above 81530? Latest market analysis and operational suggestions.
The current price of Bitcoin is 81500. This wave of increase is indeed strong, and many people are starting to shout about a ten thousand point trend again. But don't forget how brutal last year's 120k pullback was. Never go all in, and don't get too leveraged. No matter how good the market is, risk control is always the top priority. Even if your directional judgment is accurate, you must leave enough room for error in the market. Don't get carried away when you earn; don’t panic when you lose. There’s always money to be made in the crypto circle, but your principal can be wiped out. Take it slow, don’t rush. As long as the trend hasn’t turned bad, hold on, and if the trend changes, admit defeat and run. Staying alive is more important than anything else.
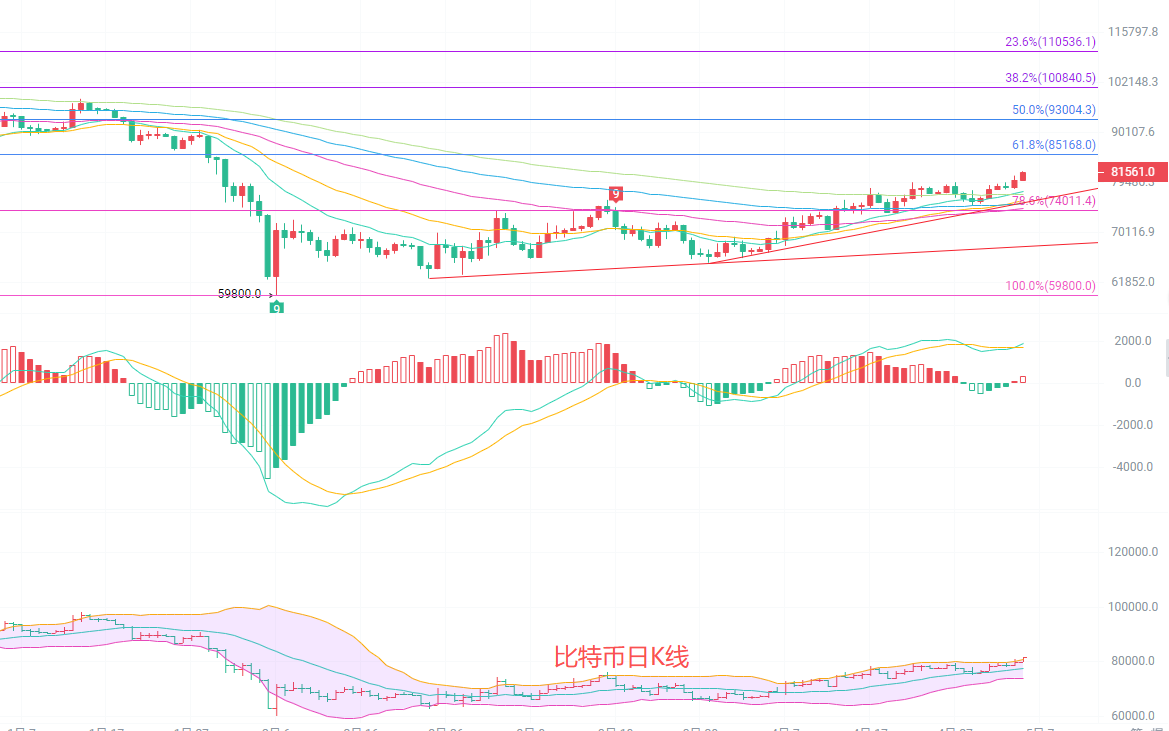
The daily K-line is at the upper edge of the ascending channel. Although the moving averages are still aligned upwards, the price has continuously deviated from the moving averages for several days, with the divergence rate continuously widening, indicating a technical need for a pullback. Although the MACD indicator's red column has maintained an expansion, the difference between DIF and DEA has begun to converge, showing signs of weakened upward momentum. The upper track of the Bollinger Bands continues to rise, with the current price running closely along the upper track, showing clear resistance from the upper track. Under the daily level overbought condition, the risk-reward ratio for chasing long positions has significantly decreased, and the risk of a pullback is accumulating.
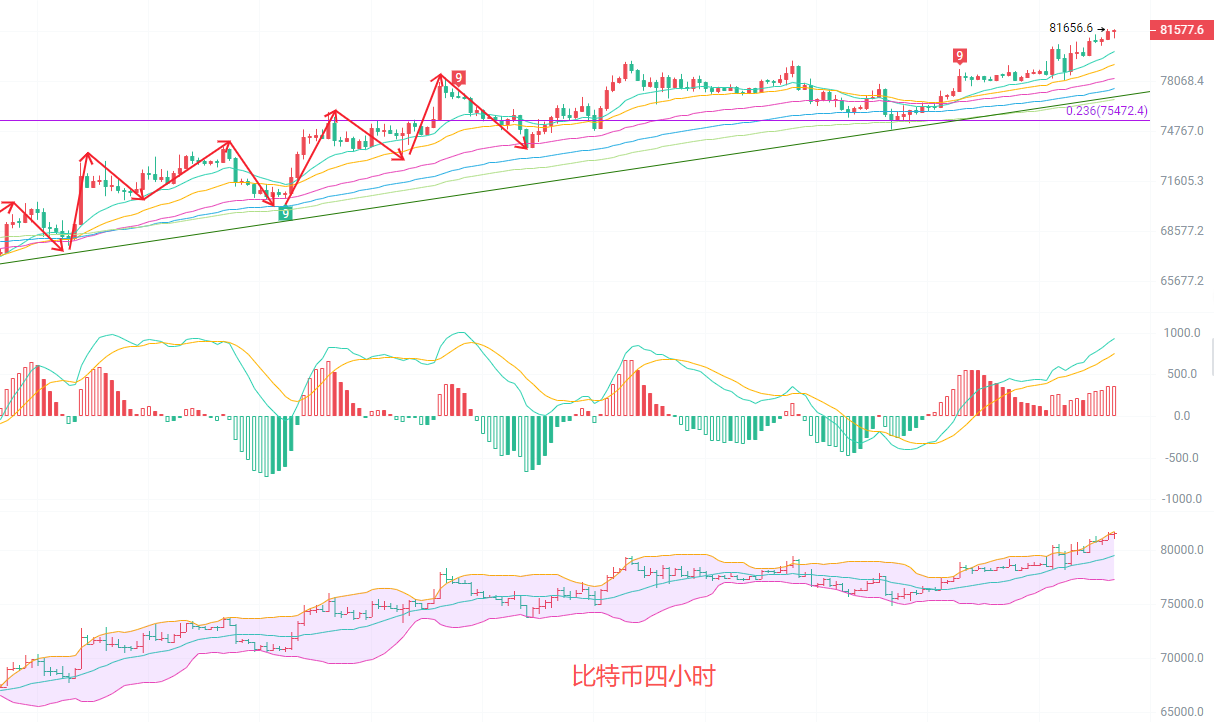
In the four-hour K-line, the upward alignment of moving averages remains intact, with short-term support moving up to around 80500. However, the price is already running above the upper track of the Bollinger Bands, with obvious overbought signals. Although the MACD indicator's red column has not disappeared, it has shown a significant reduction compared to previous highs, with upward momentum gradually weakening and divergence signals beginning to appear. The current price is oscillating in the range of 81500-81700, with strong resistance from the upper track. If it cannot effectively break through, it is highly likely to pull back to the middle track support of the Bollinger Bands. Short-term operations need to be cautious of the risk of a pullback after a rise.
Short-term strategy reference: Follow the major cycle trend, with small stop losses for quick in and out.
For the lower range of 81000 to 80500, set stop loss at 80000, target at 82000 to 82500, with a breakout target at 83500.
For the upper range of 82000 to 82500, set stop loss at 83000, target at 81500 to 81000, with a breakout target at 80500.
I have seen too many people chasing highs at the end of the trend and cutting losses in the early stages of a pullback, ultimately getting hit on both sides. The current market is not a time for mindless longs; every trade must calculate the risk-reward ratio and have proper stop losses. Don't harbor any illusions.

Kind reminder: The above content is solely created by the author for the public account. The advertisements at the end of the article and in the comment section are irrelevant to the author; please discern accordingly. Thank you for reading.
免责声明:本文章仅代表作者个人观点,不代表本平台的立场和观点。本文章仅供信息分享,不构成对任何人的任何投资建议。用户与作者之间的任何争议,与本平台无关。如网页中刊载的文章或图片涉及侵权,请提供相关的权利证明和身份证明发送邮件到support@aicoin.com,本平台相关工作人员将会进行核查。