The Bitcoin market has resolved the trend debate - while at the beginning of the week bears tried to push the price down amid outflows from funds, the finale of the week of May 1-3, 2026 turned into both a technical and fundamental trap for short sellers.
The main feature on the chart is a weekly candle with a long lower wick, which at the time of writing is precisely closing above the middle Bollinger Band at $76,589 as displayed by TradingView.
The price did not just break above this level, but retraced, tested the zone below mid-band for demand, and bounced. Such a wick is the footprint of an aggressive buyer - while retail participants hesitated, "smart money" used the local dip to add to positions.
HOT Stories Bitcoiners Agree Satoshi’s Coins Must Remain Untouched Ripple’s Schwartz Shuts Down Gag Order Rumors
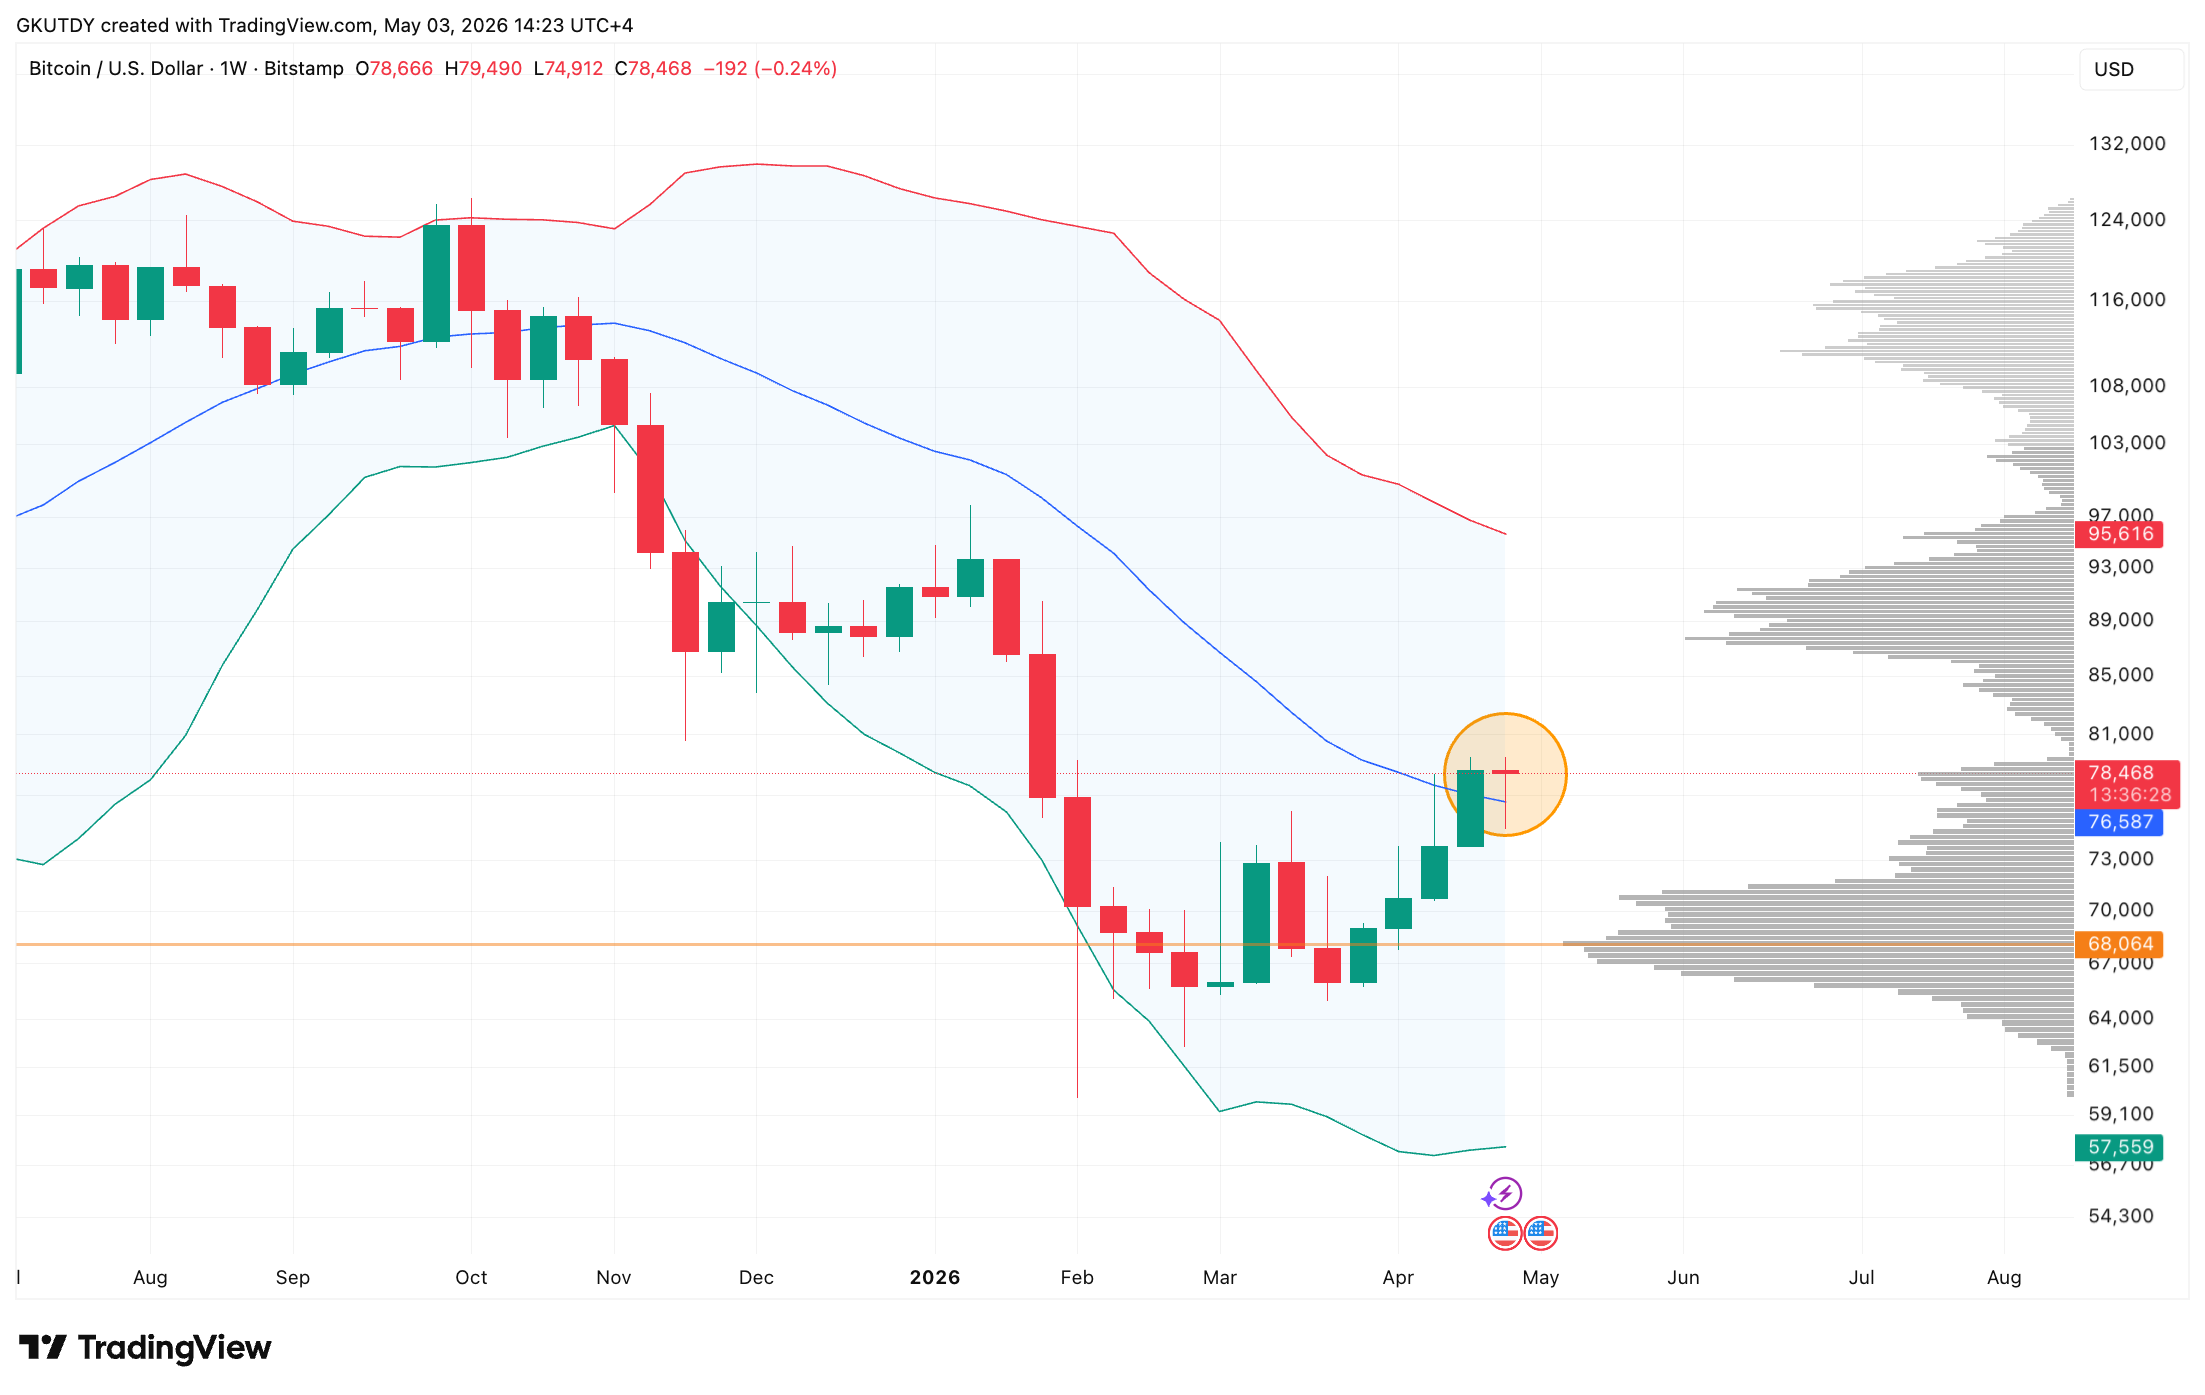
Bitcoin weekly chart with Bollinger Bands attached, Source: TradingView
$630 million ETF inflow triggers major Bitcoin bear trap
Data on US spot Bitcoin ETFs over the week explains why the bearish pressure failed. After three days of outflows from April 27 to 29, when the market lost nearly $500 million, a turning point occurred.
In just one trading day on May 1, ETFs saw $629.73 million in net inflows, according to SoSoValue. This massive inflow fully offset the weekly negative and became the "fuel" that pulled the candle's wick upward.
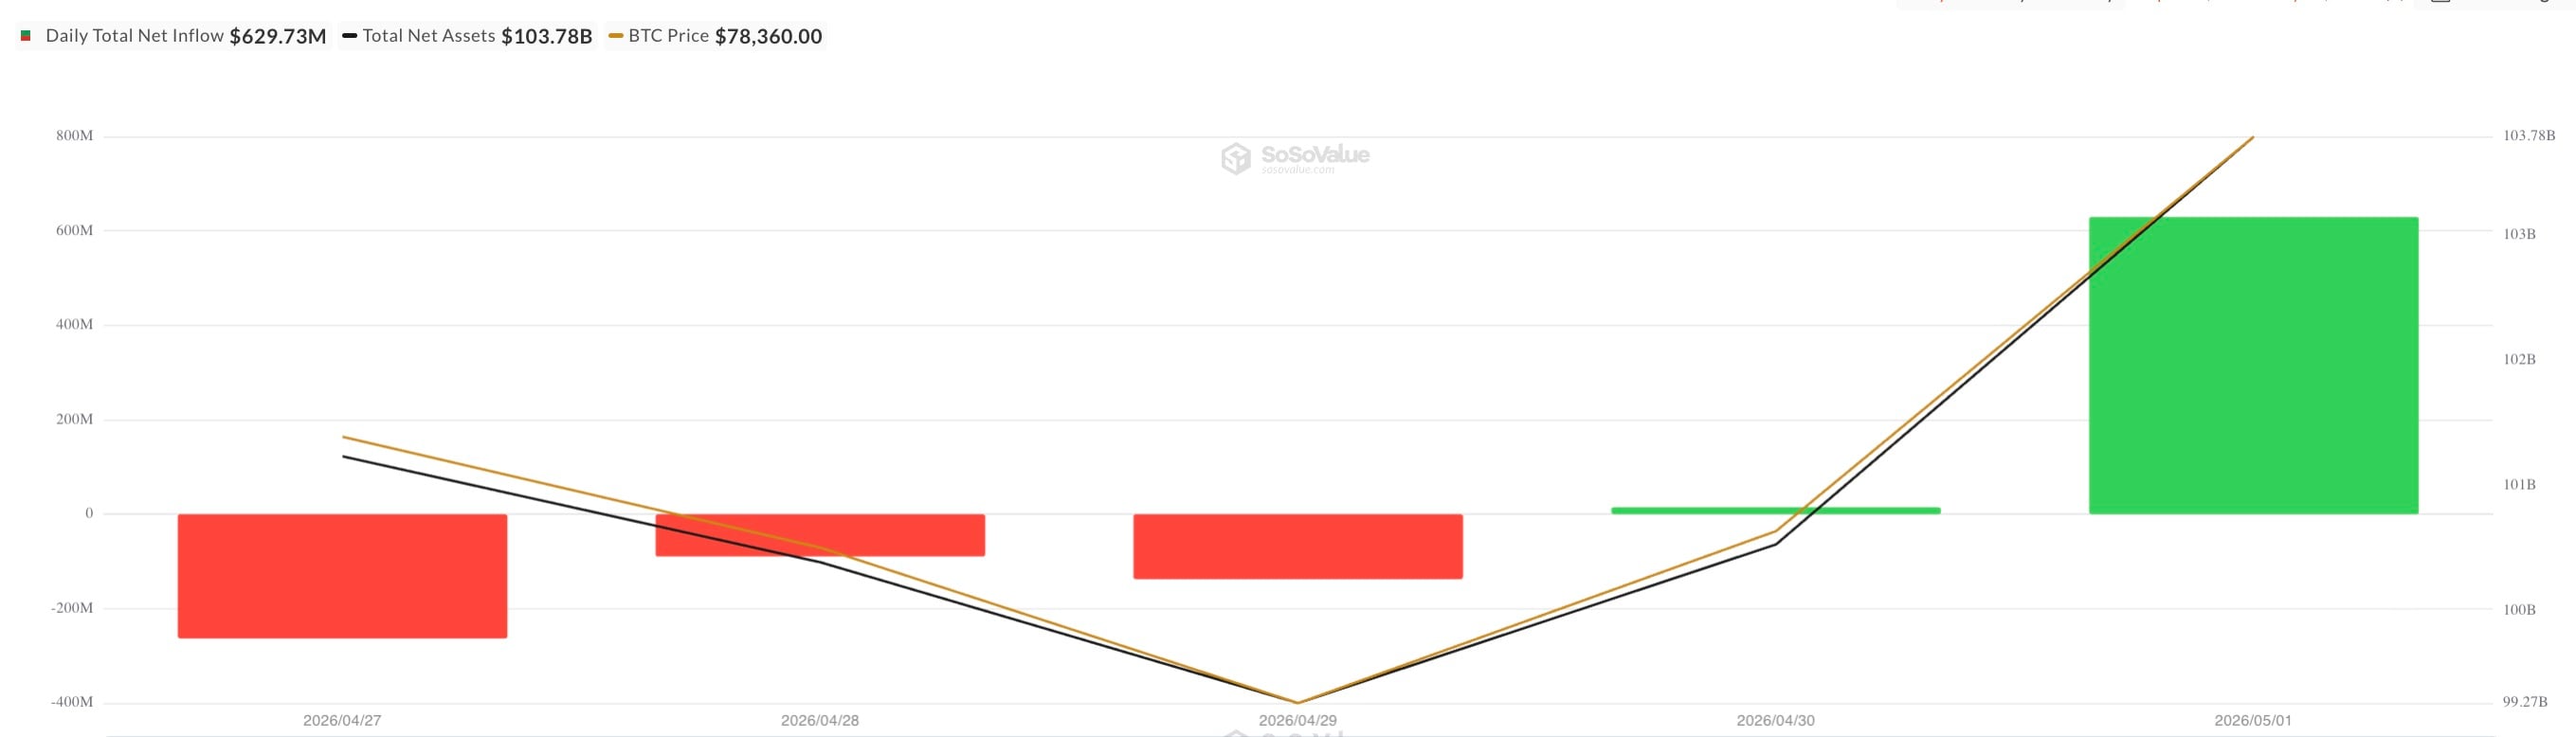
Total Bitcoin Spot ETF Net Inflow in a week from April 27 to May 1, Source: SoSoValue
You Might Also Like

Sun, 05/03/2026 - 09:32 Bitcoin Hater Buffett Warns About 'Gambling Mood' Among InvestorsByAlex Dovbnya
When a technical pattern - a pin bar above the middle Bollinger Band - is confirmed by such inflows of real money, the probability of continued growth becomes elevated as the candle's wick shows that strong demand for Bitcoin sits below $76,500. From a volatility perspective, consolidation above the center of the Bollinger Bands opens the path to the upper boundary of the channel, located at $95,600.
For bears, there is currently nothing to build their case on. The combination of a bullish weekly close and the return of aggressive ETF buying makes a move toward $95,600 the base scenario for May 2026.
免责声明:本文章仅代表作者个人观点,不代表本平台的立场和观点。本文章仅供信息分享,不构成对任何人的任何投资建议。用户与作者之间的任何争议,与本平台无关。如网页中刊载的文章或图片涉及侵权,请提供相关的权利证明和身份证明发送邮件到support@aicoin.com,本平台相关工作人员将会进行核查。


