Abstract
• Last week, the overall sentiment in the cryptocurrency market showed a "cautiously optimistic" pattern, with easing geopolitical risks in the Middle East and rising expectations of interest rate cuts by the Fed this year. BTC rose from $68,000 to above $77,000, continuing the trend of net inflows into BTC ETF.
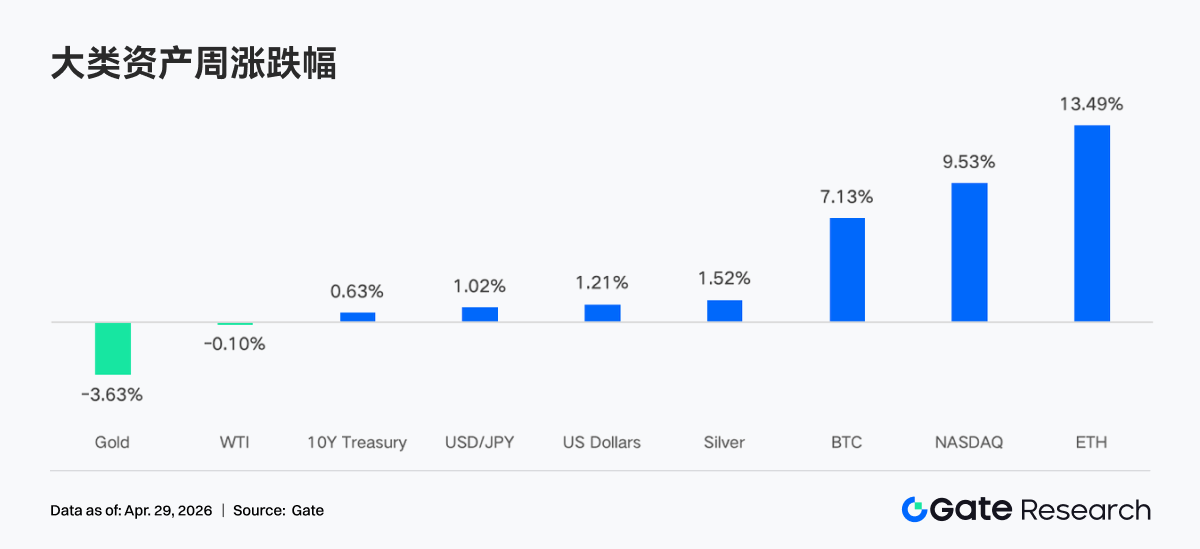
• The trading heat in TradFi has slightly retreated from the peak of risk aversion in March, but gold remains the core trading asset, while the proportion of stocks and commodities has rebounded.
• On-chain funds continue to concentrate on high liquidity and high turnover scenarios, with PancakeSwap's weekly trading volume nearing $36 billion, while the Solana ecosystem exhibits characteristics of "small frequent trading."
• Stablecoin funds have significantly flowed back into settlement-type dollar assets, with USDT supply rising to nearly $200 billion, while yield-based stablecoin USDe saw a net outflow of nearly $2 billion in one week.
• Following the rsETH incident, risk appetite on-chain has notably declined, with Aave's lending balance plummeting by 26.7% in one week, core stablecoin borrowing rates have increased significantly, and funds are accelerating towards competitive protocols like Spark.
• The derivatives market displays a typical divergence structure of "negative funding rate + high-level fluctuations," with BTC perpetual contracts remaining crowded on the short side, but spot and institutional buying still providing support; meanwhile, implied volatility and options trading volume are synchronously recovering.
• On the institutional and platform side, spot trading increased by +20.09% week-over-week, with over 30 new opportunities; CrossEx's trading volume and capital scale reached new all-time highs of +79% and +816%, respectively, as institutions accelerated arbitrage and hedging across exchanges; Trading System 3.0 architecture is being advanced, infrastructure continues to improve, and institutional fund access is accelerating.
1. Market Focus Interpretation
Last week, the overall sentiment in the cryptocurrency market was characterized as "cautiously optimistic," mainly driven by the easing geopolitical situation in the Middle East, rising Fed rate cut expectations, and institutional buying effectively hedging profit-taking pressure from short-term holders. During this period, BTC rose from around $68,000 to above $77,000, an increase of about 12%.
Trump extended the ceasefire agreement with Iran, indicating his desire to resolve the conflict through diplomatic means, but negotiations for a longer-term peace agreement are currently stalled. The Strait of Hormuz, which accounts for about one-fifth of the world's oil supply, remains closed, causing oil prices to rise back to $95 per barrel. In recent weeks, the market has absorbed the tail risks associated with the Middle East situation, with BTC and ETH continuing to rise, and ETH showing greater resilience due to ecological expectations. The stock market has also recovered from the sell-off in March. As the Federal Open Market Committee (FOMC) meeting approaches, yields remain stable, with the 10-year Treasury yield around 4.30%. The dollar index remains around 98, entering a consolidation phase after falling from above 100. Affected by the dollar and interest rates, gold remains under pressure. Meanwhile, expectations for interest rate hikes from the Bank of England have heated up, with the pound rebounding to around 1.36, and if a 22 basis point hike occurs before the end of the year, it may weaken the key structural support for the dollar.
This week's FOMC meeting is likely to keep rates unchanged, but the market will focus on any changes in the wording regarding inflation, war impacts, and risk balance in the statement, as well as whether there are signals for an adjustment in the long-term neutral rate of 3.1%. The market's expectations for the Fed's rate cut path this year have significantly warmed, with the current probability of a 25 basis point cut before December rising to 39%, up from the previous 23%. This change is influenced by the Justice Department's withdrawal of the investigation into Powell, further clearing the obstacles for Kashkari to succeed Powell as Fed Chair, and it also reflects market expectations that if oil prices return to normal ranges, the Fed will have more room for easing in the second half of the year.
2. Liquidity Analysis
2.1 BTC ETF Total Assets Net Value Surpasses $10.264 Billion
Last week, the BTC ETF continued its steady net inflow trend since April 14, recording four positive inflow trading days with a total net inflow of $585 million for the week. The ETH ETF saw a total net inflow of $87.3 million for the week, slightly slowing its fund flow pace compared to the previous week, but overall market sentiment remains optimistic, with institutional investors demonstrating a strong belief in long-term holding.
Highest net inflow products for BTC ETF:
1. IBIT (BlackRock) with a weekly net inflow of $476.6 million
2. ARKB (ARK 21Shares) with a weekly net inflow of $59.6 million
Highest net inflow products for ETH ETF:
1. ETHA (BlackRock) with a weekly net inflow of $61.9 million
2. ETHB (Bitwise) with a weekly net inflow of $47.8 million
The fund flow shows a clear concentration effect, with BlackRock's IBIT dominating with a weekly net inflow of $476 million, contributing over 80% to the total inflow of BTC ETF for the week; ETHA similarly leads the ETH ETF market with $61.9 million. Meanwhile, Grayscale's GBTC and ETHE still face continuous outflows, reflecting an ongoing structural migration trend of investors from high-fee legacy products to low-fee new products.
As of April 24, the total net asset value of U.S. spot BTC ETFs has surpassed $10.264 billion, accounting for about 6.5% of Bitcoin's total market value. The total net asset value of ETH ETFs is approximately $13.79 billion, accounting for about 4% of Ethereum's total market value. In terms of fund trends, the net flow of BTC ETFs has turned positive to about $1.85 billion year-to-date, with market confidence recovering; however, whether it can break through the historical cumulative net inflow high point still needs to be observed in the outcome of the bull-bear battle around the $80,000 mark.
2.2 TradFi Liquidity
•TradFi Perp DEX: Trading volume over the past week has continued to decline slightly compared to previous weeks, with the latest weekly total trading volume dropping to around $10 billion, indicating that after the marginal easing of the Middle East situation and the market's risk appetite recovery, the previously high trading heat driven by risk aversion is gradually cooling. From the asset structure perspective, commodities still dominate, with gold-related asset trading remaining central and accounting for the majority of trading volume. However, compared to the peak phase in March, the proportion of commodities has shown some contraction, while the share of equities, ETFs, and other equity assets has slightly recovered, indicating that funds are starting to spread from single risk-averse trading to broader risk assets.
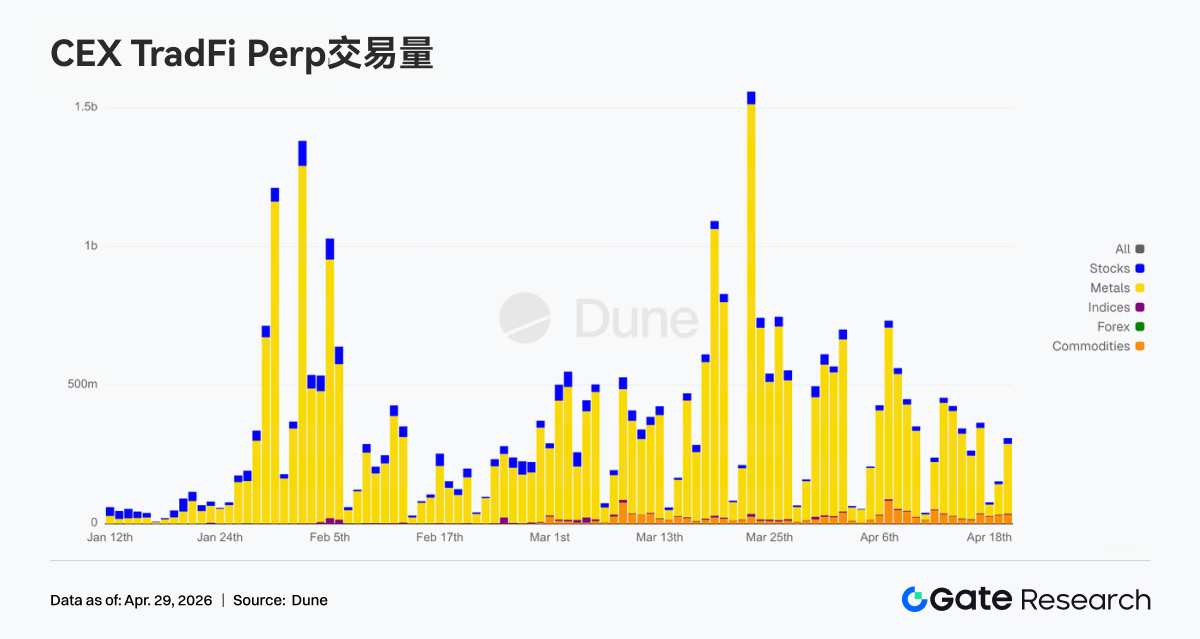
•TradFi Perp CEX: Since April 20, the overall trading heat in the market has eased from the previous peak in March but remains in a relatively active range. From the transaction structure perspective, gold and other precious metal assets still dominate completely, but compared to the mid-late March peak of over $1.5 billion in single day transactions, the recent overall trading volume has significantly contracted, with most trading days ranging between $300 million and $500 million, reflecting that market sentiment is gradually shifting from extreme risk-aversion to a stage of oscillation and digestion. Meanwhile, the proportion of stocks and commodity sectors has slightly increased, indicating funds are beginning to migrate from single gold trading to broader TradFi assets, with some users starting to reallocate to equities and cyclical assets.
•CEX TradFi Asset Categories: Over the past week, the number of CEX TradFi asset categories has further expanded, with the total number of three major CEX in TradFi asset categories (only counting TradFi and CFD sectors, excluding perpetual contracts) increasing from 955 to 956, a week-on-week growth of 0.1%. Among them, the growth in the stock category is the most significant, increasing from 590 to 594, with only Gate among the mainstream exchanges adding 4 stocks in the stock TradFi category last week, driving an overall week-on-week increase of 0.7%.
•TradFi Order Book Depth: We selected XAUT, the asset with the highest TradFi trading volume, to analyze its order book depth (Delta). Between April 20 and 22, the market depth Delta repeatedly showed large negative values, especially on the 21st when it approached -600,000, while the price of XAUT also quickly fell from around $4.78K to below $4.70K, indicating a phase of cooling risk aversion towards gold. However, after the 22nd, the order book structure clearly turned bullish, with the green positive Delta continuing to expand, and one-sided buying depth frequently maintained in the range of $300,000 to $800,000, with a buying peak approaching $1 million on the 23rd, indicating that the bottom support funds have significantly strengthened. Overall, XAUT is currently in a "weak price but improving liquidity support" stage, indicating that amid the still unresolved Middle East situation and rising rate cut expectations, there remains a demand for allocation of gold-related assets, but short-term chasing momentum is clearly weaker than the previous risk aversion peak stage.
3. On-chain Data Insights
3.1 Trading Resumes in Spot and High Turnover Scenarios, Liquidity Further Concentrates at the Top
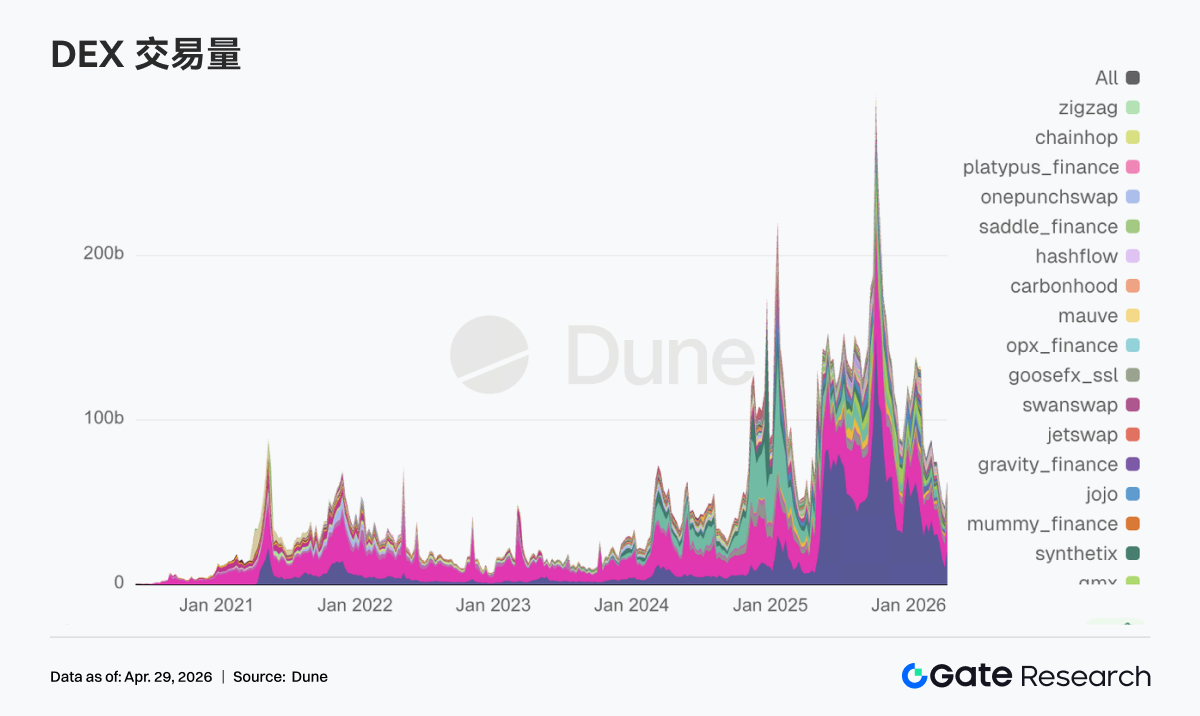
This week, PancakeSwap's trading volume nearly reached $36 billion, significantly higher than Uniswap's $18.3 billion; Aerodrome, Curve, and Fluid ranged between $2.5 and $3.5 billion. On the Solana side, Raydium and Meteora accounted for about $1 billion, but the number of transactions exceeded 100 million, showcasing characteristics of small frequent trading. Trading volume remains maintained in a high range, with on-chain trading demand not significantly contracting. However, as funds shift from credit-based DeFi to low-fee and high-turnover spot trading scenarios, liquidity is further concentrating towards top pools.
3.2 Stablecoin Funds Concentrate on Settlement-Type USD, USDe Saw a Net Outflow of Nearly $2 Billion in One Week
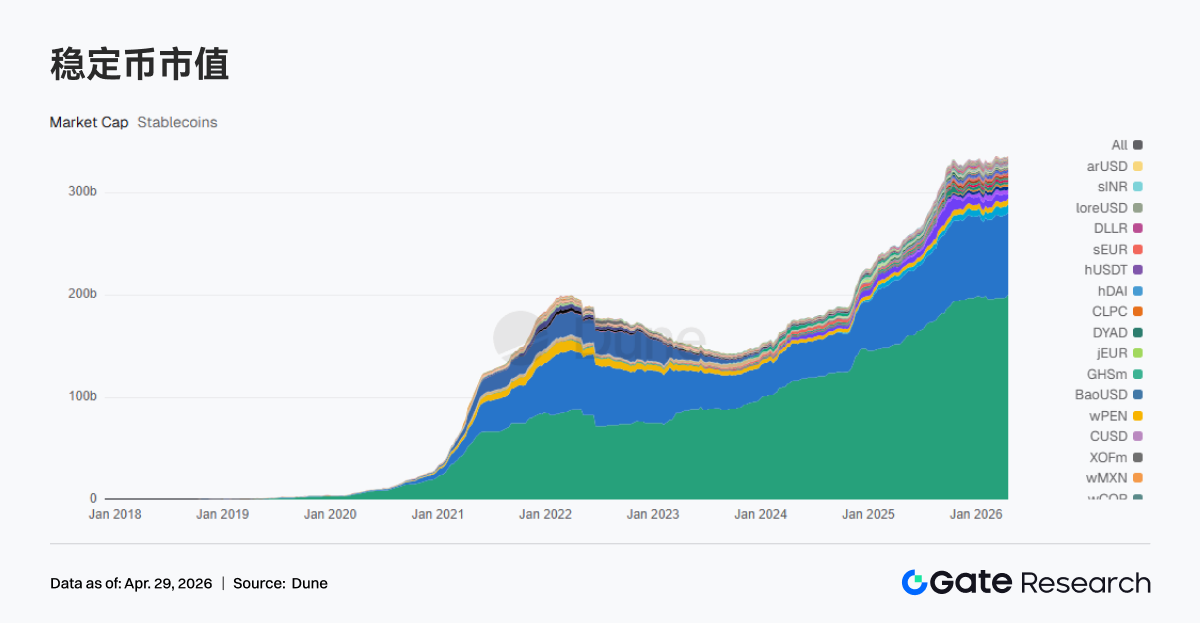
In the past week, USDT supply rose to $199.959 billion, a weekly increase of $2.418 billion; USDC stood at $80.391 billion, a weekly decrease of $184 million; UShDS reached $8.136 billion, a weekly increase of $340 million; USDe was at $4.410 billion, a weekly decrease of $1.997 billion; and PYUSD stood at $2.750 billion, a weekly decrease of $677 million. This week, stablecoin funds overall concentrated towards dollar assets that are directly settled and quickly transferable, with yield-based and synthetic stablecoins experiencing notable net outflows, among which USDe had a net outflow of nearly $2 billion. Major stablecoins are strengthening the prioritization of settlement layers and compliant assets, with Circle and OSL introducing a 1:1 USD/USDC conversion and unified margin system, while Tether coordinated with law enforcement to freeze $344 million USDT.
3.3 LST Risks Begin to Price Complex Pathways, Top Protocols Experience Slight Decline
Lido, Rocket Pool, Jito, and Jupiter Staked SOL, leading LST protocols in ETH and Solana saw slight outflows of 2%-5% to varying degrees over the past week. Following the rsETH event, the market has not negated staking yields, but is re-pricing the risks associated with cross-chain and re-staking pathways. Top LST protocols have seen slight decreases in scale, while high complexity and yield enhancement paths have shown more notable withdrawals. Lido, as a representative LST leading protocol, has recently proposed to utilize up to 2,500 stETH for rescue operations, further indicating the broad impact range of systemic risks that related DeFi protocols need to address collectively.
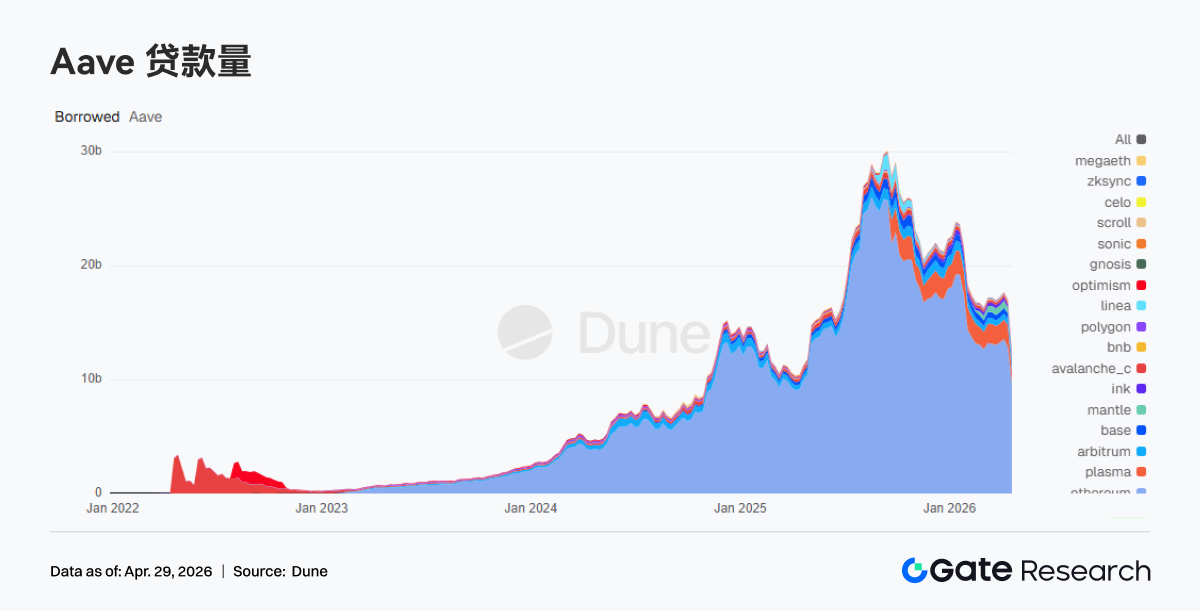
3.4 Aave Lending Balance Experiences a Step-like Decline, Funds Escape to Competitors
Aave's total lending balance dropped from the previous week's $17.027 billion to $12.481 billion, a decrease of $4.546 billion or -26.7%. Among them, the Ethereum main net fell from $12.880 billion to $9.671 billion, and Plasma dropped from $1.930 billion to $942 million. The lending balance presents a stepwise decline, indicative of fund withdrawals triggered by risk events. Aave froze multi-chain rsETH/wrsETH after the rsETH incident and limited new borrowing of WETH, further accelerating position contraction. Most funds have not left the chain but are turning towards Aave's competitor Spark.
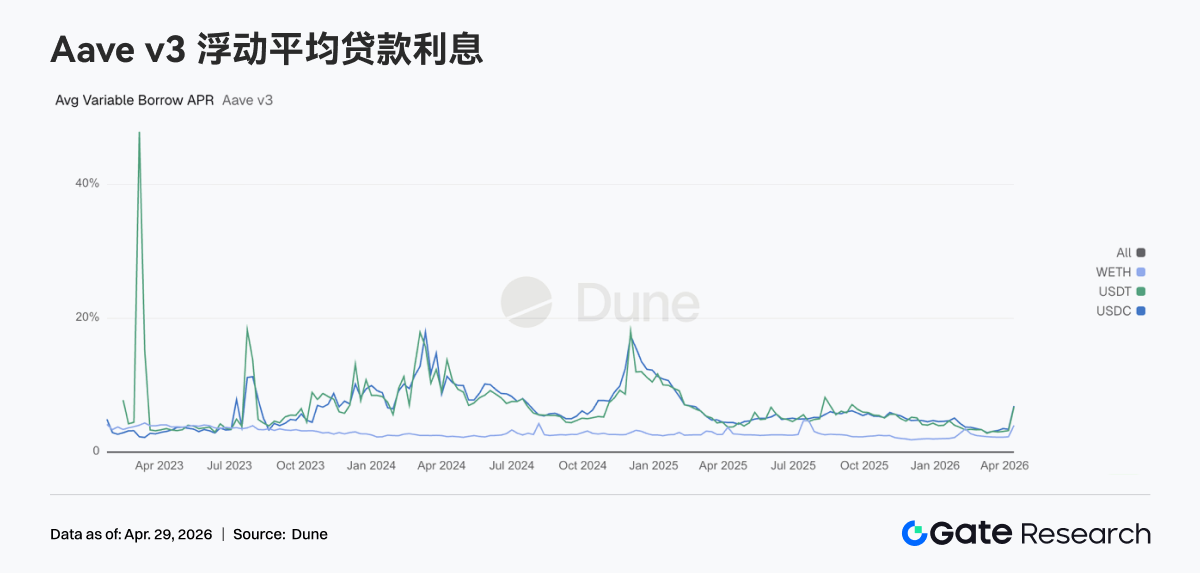
3.5 Liquidity Temporarily Tightens, Aave Core Asset Rates Rise Significantly
In the past week, the average borrowing rate for USDC in Aave Ethereum V3 rose to 12.50%, up from 6.91%; USDT rose to 13.30%, up from 6.76%; WETH rose to 5.21%, up from 4.00%. The rising interest rates reflect a contraction in stablecoin liquidity. Due to the ongoing risk caused by the rsETH security incident, the utilization rates of core assets like USDC in the Ethereum Core market are close to 100%, with some liquidity not being retrievable, maintaining high borrowing rates. Market demand for retrievable dollar liquidity has significantly increased, with the chain entering a liquidity repair stage. However, as joint rescue operations progress, asset rates are expected to return to normal ranges in the coming weeks.
3.6 Income Flows Back to Settlements and Volatility Chains, Lending Protocols Benefit
Tether and Circle's income has remained basically flat; Hyperliquid and Pump have seen declines of over 10% week-over-week; Aave's income grew by over 40% in one week to nearly $2.9 million amidst fluctuating rates. The issuance and settlement of stablecoins remain the most stable source of cash flow; income from trading protocols is beginning to diverge, while lending protocols are obtaining more income during the volatility and restructuring phase of positions. Aave's income increase while borrowing scale decreases also reflects a shortening of positions and faster fund turnover.
4. Derivatives Tracking
4.1 BTC Funding Rate Remains Negative While OI Rises, Short Squeeze Structure Continues to Strengthen
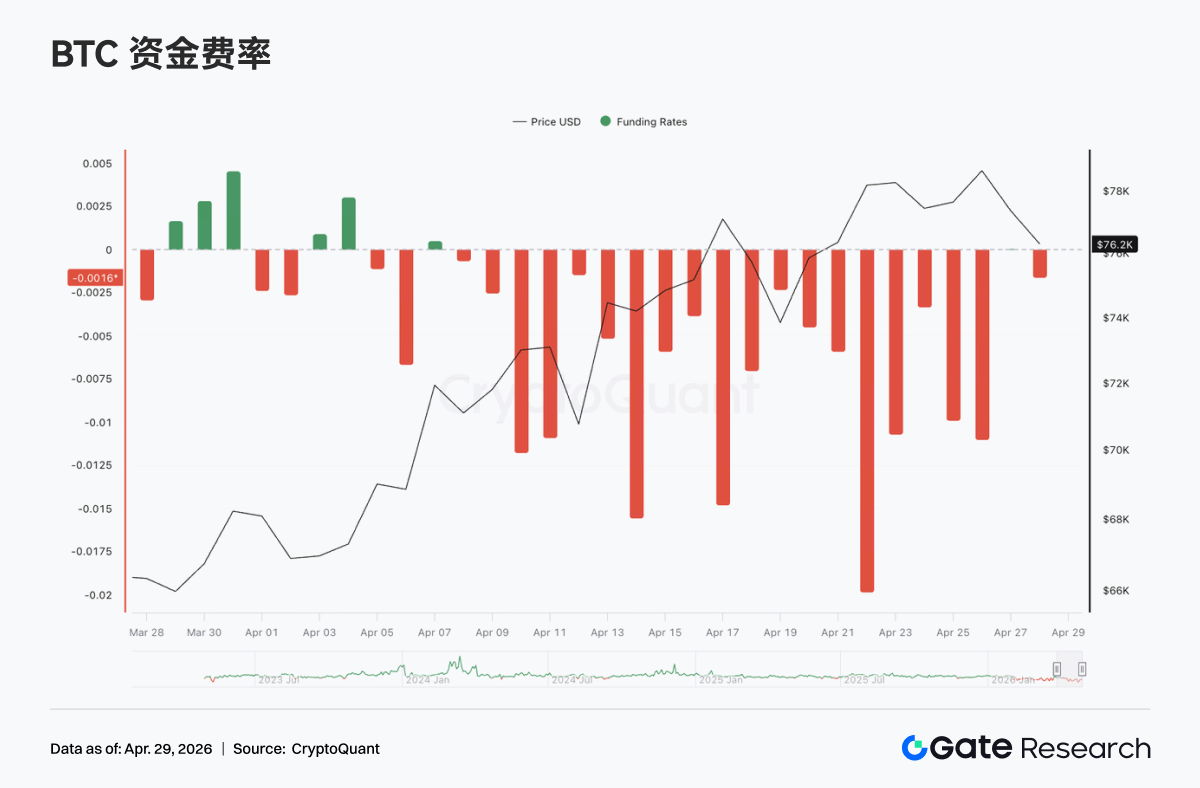
In the past week, the BTC perpetual contract funding rate has overall remained in the negative range, with multiple occurrences of extreme negative values (lowest approaching -0.02) from mid to late April, indicating that market short sentiment continues to dominate, with the short crowding degree maintained at high levels. Correspondingly, BTC prices have shown oscillatory upward movements since early April, peaking around $78K around April 20, presenting a typical divergence structure of "negative funding rates but high prices," indicating that shorts are under continued price pressure while paying funding rates.
Meanwhile, open interest (OI) has shown an overall upward oscillatory trend, climbing from around $21 billion to above $25 billion, while there were some phase-wise dropbacks, the overall midpoint has significantly risen. The continuous negative funding rate combined with rising OI means that in the process of price oscillation strengthening, new positions in the market are primarily short, forming a classic "short positions increase + prices do not fall" divergence structure.
OI saw rapid spikes around April 17 and 22, corresponding to phase-wise price increases and upward oscillation, while funding rates remained deeply negative, indicating that shorts did not effectively stop-loss during price increases but instead showed ongoing behaviors of increasing positions. This combination of "negative rates + OI expansion + price strengthening" typically indicates that short squeeze momentum is accumulating, and once prices break further through ranges, upper-side short covering may accelerate the market. However, it’s important to note that high OI combined with a high divergence structure also means higher market leverage levels, and if prices weaken, the deleveraging process may also lead to amplified volatility.
4.2 Options Trading Volume Temporarily Increases, Monthly Contract Dominance Structure Unchanged
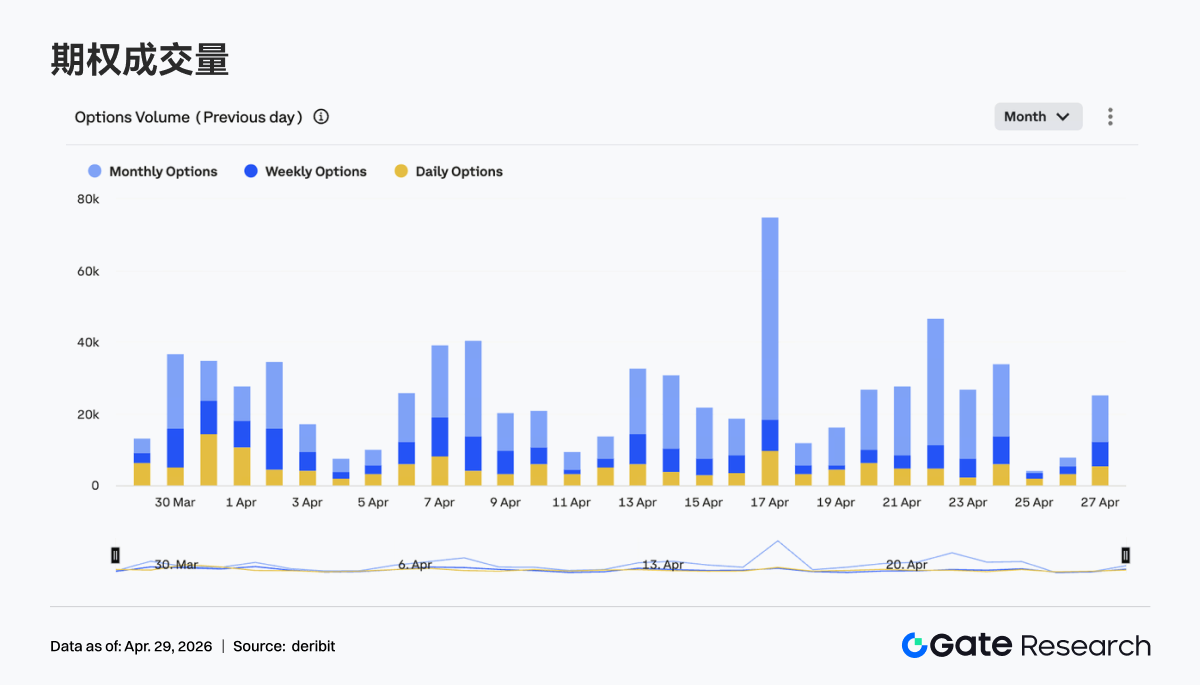
The BTC options market has displayed a characteristic of temporarily increased trading volumes, with significant peaks observed around April 17 and April 23, with single-day trading volume considerably exceeding the weekly average. From a structural perspective, monthly options still dominate, consistently accounting for more than weekly and daily options, indicating that market participants primarily allocate in a medium-term structured layout, while short-cycle trading exists more as an event-driven or short-term hedging tool.
In terms of rhythm, the timing of increased trading volumes roughly corresponds with rapid price fluctuations or near phase peaks, reflecting that during price increases, both market hedging demand and proactive trading behaviors have surged. Overall, there are no clear signs of migration towards short cycles in the options market; the structure still leans towards medium-term allocation; however, the impulse-style increases in trading volumes also indicate that in critical price ranges, volatility trading and risk management demand have markedly enhanced, which might exacerbate short-term price volatility.
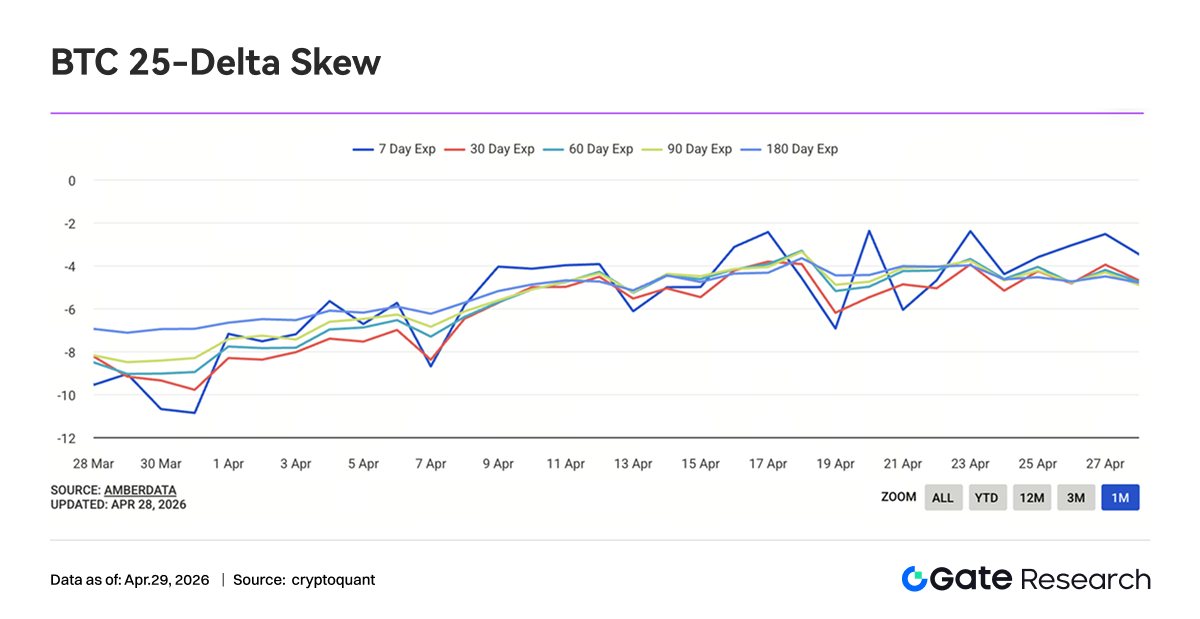
4.3 Implied Volatility Across Expiry Dates Rises Overall, Term Structure Tends to Converge
In the past week, implied volatility across various expiry dates for BTC has exhibited a steady upward oscillatory trend, with 7D, 30D, 60D and longer-term IV gradually rising from low points at the beginning of the month, where shorter tenors (7D) show more pronounced fluctuations, having once dipped close to the -10 range before rapidly rebounding around -3, indicating a clear pricing recovery of short-term market volatility. Meanwhile, the interest rate differentials between different expiry dates have gradually narrowed, presenting a certain degree of flattening characteristic in the term structure.
In terms of timing, after mid-April, all expiry dates' IV rose synchronously, indicating that market expectations of uncertainty regarding future volatility have increased, not merely driven by a single short-term event. Overall, the rise in implied volatility corroborates the high-level oscillations in prices, with intensifying market discrepancies and rising hedging demand. Under the backdrop of converging term structures, the differences in risk premiums between short and medium terms have weakened, and if directional breakthroughs occur subsequently, IV may still have further upward space.
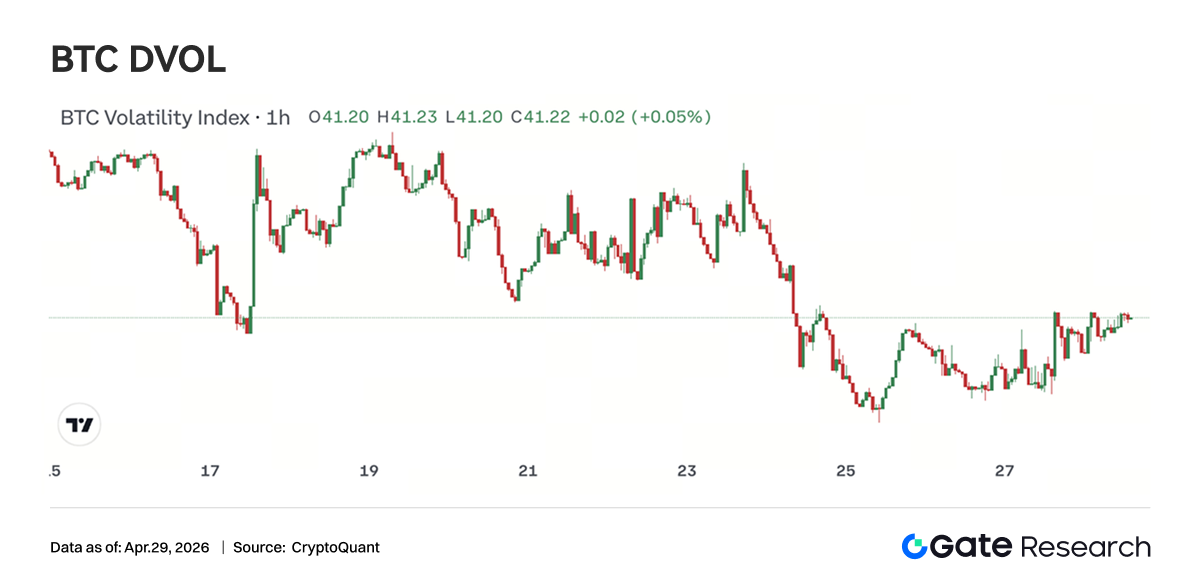
4.4 BTC Volatility Index Stabilizes After Oscillating Downward, Short-Term Volatility Compresses
The BTC volatility index (BVOL) has shown an overall trend of oscillating downward, experiencing a significant drop around mid-April, then gradually stabilizing in low regions, currently maintaining around 41 with narrow fluctuations. From the market structure perspective, volatility did not amplify during the price uptrend, but instead compressed, indicating that market pricing for trend continuation is stabilizing and that short-term panic sentiments have markedly alleviated.
In terms of rhythm, around April 18, volatility quickly dropped, corresponding to phase-wise price pullbacks and subsequent rebounds, indicating that the market entered a relatively stable phase after experiencing a round of volatility release. Overall, the current condition is a combination of "high price oscillation + volatility compression," meaning that the market is accumulating conditions for the next phase of directional breakthroughs. Once prices break through ranges, volatility is likely to expand again, quickly adjusting pricing on the derivatives side.
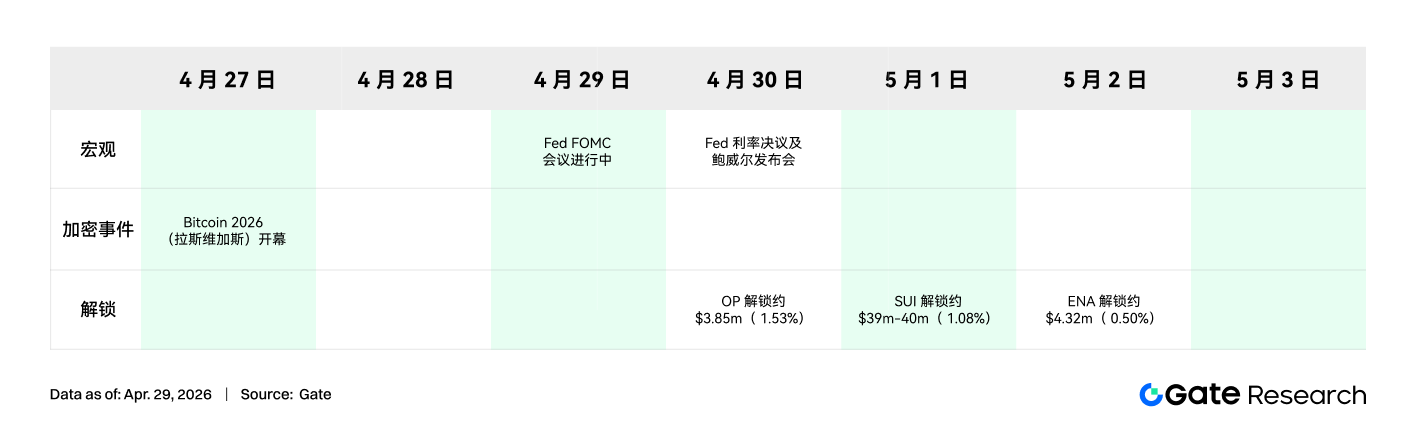
5. This Week's Outlook
6. Gate Institutional Dynamics Update
•Optimized Trading Structure, Performance Exceeds Industry
○ Spot continuously outperforms the market, with a week-on-week growth of 20.09%; contract performance remains stable above industry levels
○ Added over 30 new opportunities in one week, with Pipeline accelerating expansion
•CrossEx Trading Volume and Capital Scale Continue to Hit Historical Highs
○ Many leading institutions have initiated cross-exchange arbitrage, hedging, and cross-exchange strategies
○ CrossEx trading volume and capital scale continue to reach historical highs, with trading volume increasing by 79% week-over-week and capital scale increasing by 816%
•Gate Trading System Technology Continues to Upgrade, 3.0 Architecture Launches Soon
○ 3.0 architecture deployment preparations have been completed, customer testing is expected to begin in May
○ SBE + real-time BBO have been launched, significantly improving data and matching efficiency
○ Continual optimization of delay and API capabilities to enhance high-frequency trading experiences
•TradFi and Institutional Infrastructure Continuous Improvement
○ Continuous expansion of banking and compliance channels, accelerating institutional fund access
○ Continuous improvement of TradFi order management and API systems
Data Sources
• Investing, https://investing.com/currencies/xau-usd-historical-data
• Gate, https://www.gate.com/trade/BTC_USDT
• CMC, https://coinmarketcap.com/real-world-assets/?type=all-tokens
• Coinglass, https://www.coinglass.com/pro/depth-delta
• Dune, https://dune.com/gateresearch/gate-tradfi#weekly-volume
• Dune, https://dune.com/gateresearch/gate-institutional-weekly-report
• Bybit, https://www.bybit.com/future-activity/en/tradfi
• Bitget, https://www.bitgettradfi.com/tradfi/XAUUSD
• CryptoQuant, https://cryptoquant.com/asset/btc/chart/derivatives
• Amberdata, https://pro.amberdata.io/options/deribit/btc/current/
Gate Research Institute is a comprehensive blockchain and cryptocurrency research platform, providing readers with in-depth content including technical analysis, hot insights, market reviews, industry research, trend predictions, and macroeconomic policy analysis.
Disclaimer
Investing in the cryptocurrency market involves high risks; users are advised to conduct independent research and fully understand the nature of the assets and products they purchase before making any investment decisions. Gate is not responsible for any losses or damages resulting from such investment decisions.
免责声明:本文章仅代表作者个人观点,不代表本平台的立场和观点。本文章仅供信息分享,不构成对任何人的任何投资建议。用户与作者之间的任何争议,与本平台无关。如网页中刊载的文章或图片涉及侵权,请提供相关的权利证明和身份证明发送邮件到support@aicoin.com,本平台相关工作人员将会进行核查。


