Dear friends, I am Sister Qinglan. This morning, market sentiment was completely ignited by two major events. The first is that the prices of crude oil in both the U.S. and internationally surged over 6%, with WTI soaring as much as 8.48% during the day. The spike in oil prices directly exacerbated inflation fears, leading the Federal Reserve to potentially adopt a more hawkish stance. The second event is that Powell took a hawkish position, with traders expecting the probability of a Federal Reserve interest rate hike to exceed that of a rate cut for the first time, and the yield on 10-year U.S. Treasury bonds approached the red line of 4.5%. With these two messages combined, risk assets were under comprehensive pressure, and Bitcoin broke below the $75,000 mark in the early morning. Although it has rebounded somewhat since then, the overall pressure remains heavy. In such a macro backdrop, we need to rely on data rather than intuition for our actions.
Current Price and Time
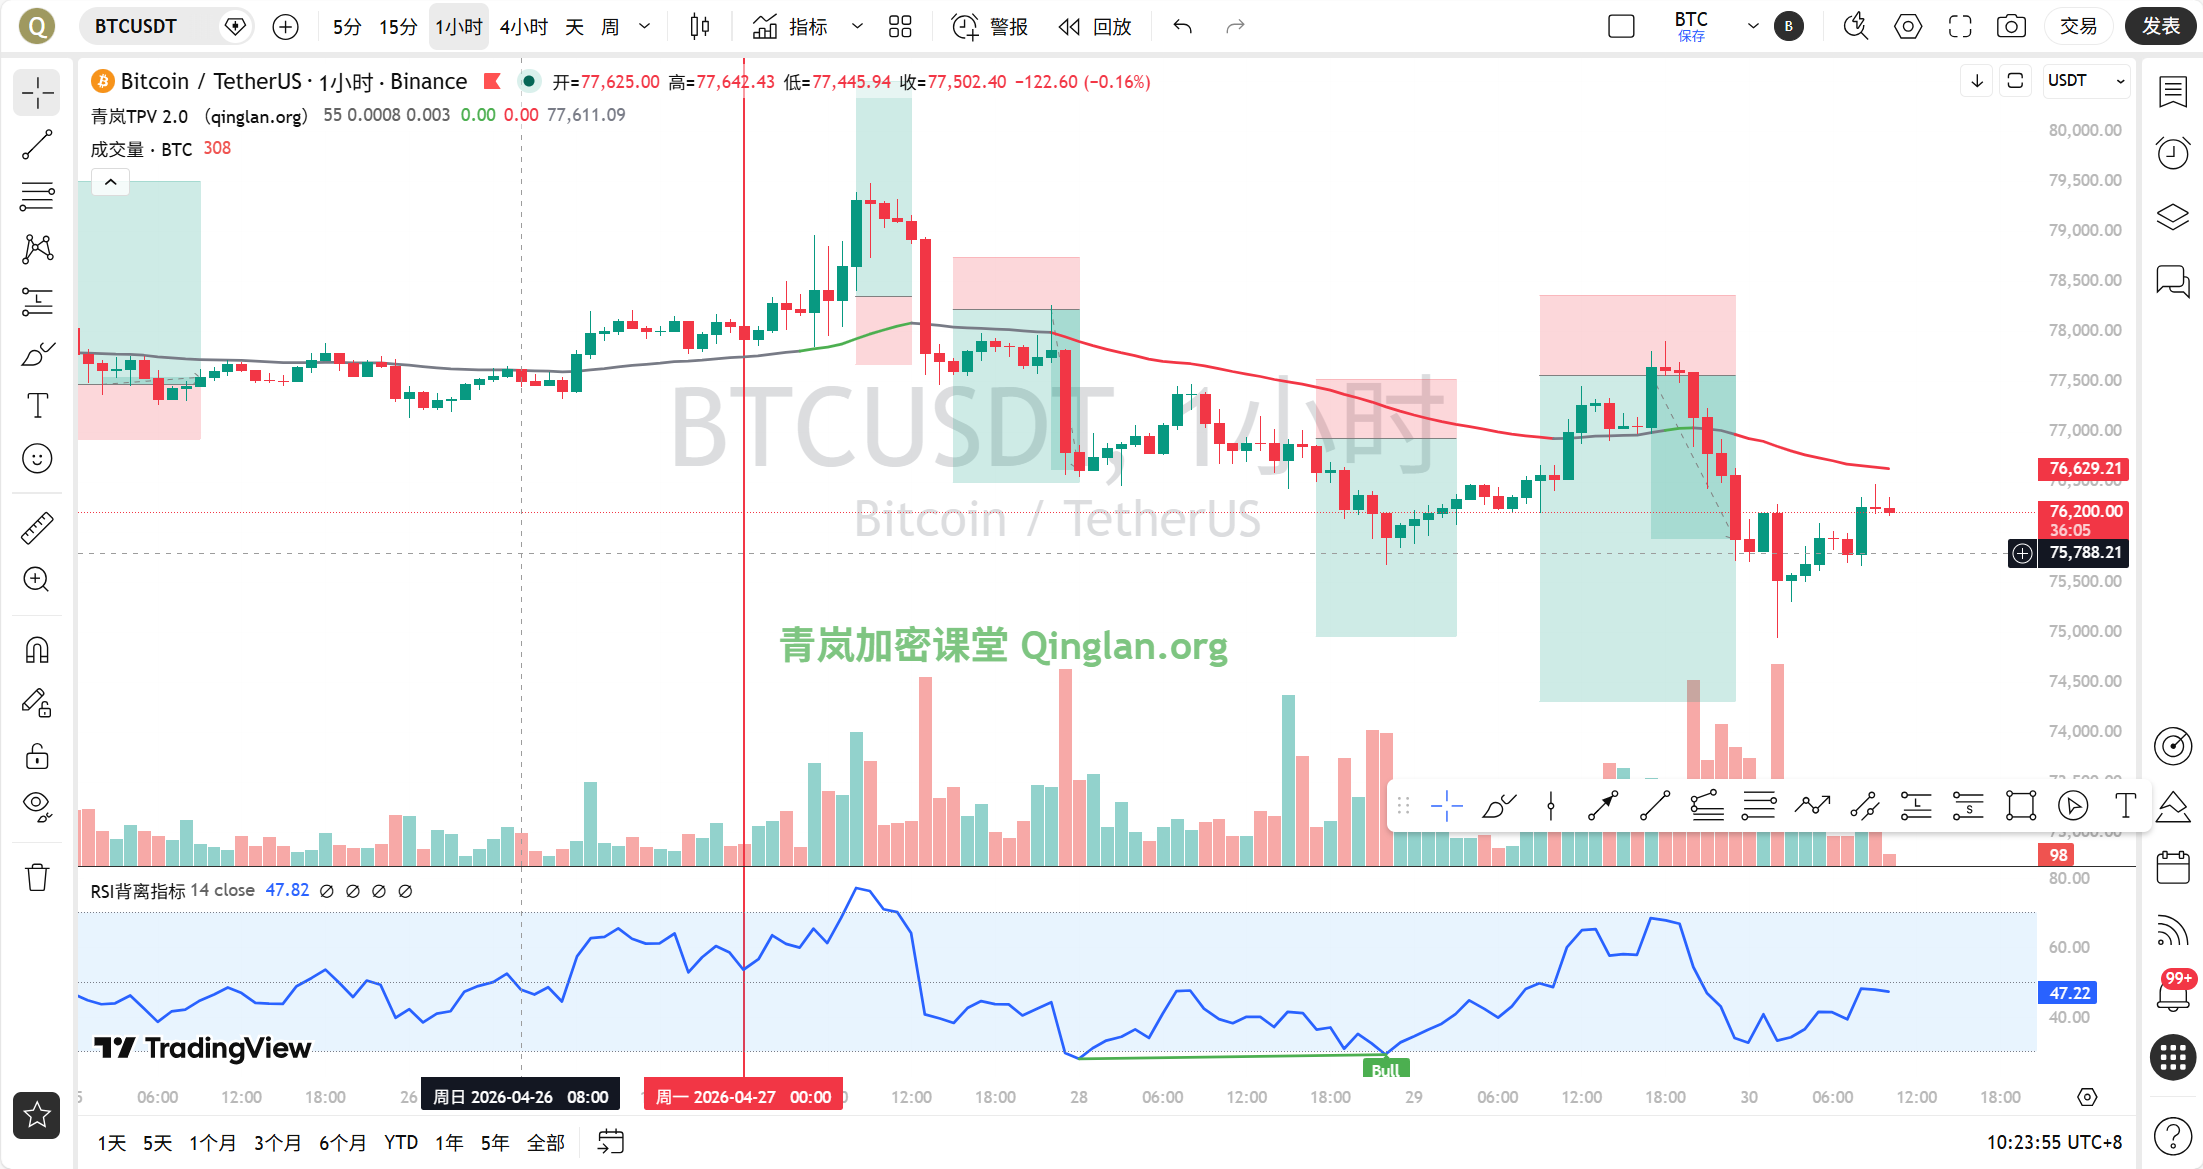
The current time is April 30th, 10:22 AM, and the latest price of Bitcoin is 76,180 USDT, with a 24-hour decline of 0.74%. The Fear and Greed Index has dropped to 26, indicating a state of fear and a generally pessimistic market sentiment. Please note, however, that fear often breeds opportunity; the key is whether we can find clear signals.
Multi-Timeframe Overview
First, let’s look at the daily chart. The daily MA5 is at 76,866, and the MA10 is at 77,216. The current price of 76,180 is significantly below these two moving averages, indicating short-term moving average resistance. In terms of MACD, DIF is at 1,527.73, DEA is at 1,787.52, and the histogram shows -259.79. Although DIF remains positive, the histogram continues to shorten, indicating that bullish momentum is diminishing. RSI is at 53.43, in a neutral and slightly weak position. The daily chart overall shows a pullback after high-level fluctuations, but it has not completely turned bearish yet.
Now let’s check the 4-hour chart. The 4-hour MA5 is at 76,207, MA10 at 76,382, and MA30 at 77,178. The price is hovering near the MA5 and MA10 but is clearly under pressure from the MA30. The MACD shows DIF at -382.58, DEA at -285.54, and histogram at -97.04, with bearish momentum still being released. RSI is at 44.27, indicating a weak position. The 4-hour level shows bearish dominance, but the speed of decline has slowed down.
The 1-hour level is the focus for today. The 1-hour MA5 is at 76,073, MA10 at 75,924, and MA30 at 76,518. The current price is above the MA5 and MA10 but still below the MA30. The MACD has just formed a golden cross, with DIF at -202.41, DEA at -208.94, and histogram at 6.53, which is a short-term rebound signal. RSI is at 36.24, still low but has rebounded from the oversold area. The 1-hour EMA55 is at 76,652, and the current price of 76,180 is below EMA55, indicating a clear bearish trend.
At the 15-minute level, MA5 is at 76,285, MA10 at 76,153, and MA30 at 75,896, with prices standing above the short-term moving averages. The MACD golden cross continues, with DIF at 98.96, DEA at 54.63, and histogram at 44.33, indicating strong rebound momentum. RSI is at 58.40, in a neutral and slightly strong area. The 15-minute chart shows a short-term rebound demand, but the strength needs further observation.
TPV Signal Verification
According to the Qinglan TPV system, we use the 1-hour EMA55 as the boundary between long and short. The current price of 76,180 is below EMA55 at 76,652, and data from fluctuations shows that in the past 8 1-hour candlesticks, the number of times the closing price was above EMA55 is 0, and the number of times it crossed is also 0, with the price's distance from EMA55 at 0.62%, not meeting the fluctuation threshold. Therefore, we are currently in a clear bearish trend area.
For short-selling conditions, first, the price is under pressure below the 1-hour EMA55, and there have been 2 consecutive 1-hour candlesticks closing below EMA55, which is already met. Second, observing resistance formation, we need to check for long upper shadows or top formations. From the 1-hour candlestick perspective, after a rebound to around 76,500 in the early morning, a long upper shadow was formed, followed by a pullback, which fits the resistance feature. Third, the rebound lacks strength; although MACD has just turned positive, the rise of RSI from 36 has been limited, and the price has failed to effectively break through EMA55, indicating insufficient rebound momentum. In summary, short-sell conditions are forming but require waiting for clearer signals, such as the MACD histogram shortening again or a bearish engulfing pattern appearing.
For long conditions, the current price is below EMA55, and there have been 2 consecutive 1-hour candlesticks that did not close above EMA55, thus the long conditions are not satisfied. As a result, the system is currently not actively taking long positions.
On-chain Funding Situation
In terms of on-chain data, the Fear and Greed Index is at 26, indicating a state of fear. Historically, this position often corresponds to a phase bottom, but confirmation with technical indicators is needed. Bitcoin's market share is 58.01%, which is high, indicating that funds are still concentrating on Bitcoin, putting pressure on altcoins. U.S. Treasury yields are approaching 4.5%, with capital flowing out of risk assets, tightening liquidity in the crypto market. For large holders, although Hyperliquid bullish whales are betting on ETH, the overall macro bearish pressure is stronger, making it difficult to form effective support in the short term.
Key Support and Resistance Levels
The first resistance level above is near 76,650, where the 1-hour EMA55 is located, serving as the boundary for long and short positions and a strong resistance point for short-term rebounds. The second resistance level is at 77,180, corresponding to the 4-hour MA30. If the price can break through 76,650, this will be the next target. The first support level below is the 75,000 integer mark, which is close to the early morning low and serves as psychological support. The second support level is at 74,000, corresponding to the daily MA30 near 73,726. If 75,000 is broken, this will be the last line of defense for bulls.
Trading Strategy
Based on the current bearish trend and TPV system signals, my trading strategy is as follows.
Direction: Mainly bearish, but wait for a rebound to resistance levels before entering, do not chase short.
Entry Conditions: If the price rebounds to the 76,600-76,700 range and a 1-hour candlestick shows a long upper shadow or a top formation, while MACD histogram begins to shorten or RSI falls from a high position, then enter a short position. If the price directly breaks below 75,000 and shows volume, it can also be considered for shorting, but the position should be light.
Stop Loss Level: After entering a short position, set the stop loss above 77,200, which is above the 4-hour MA30. If the price breaks 77,200, the bearish logic will be invalidated.
Target Levels: The first target is 75,000, the second target is 74,000. If macro bearish factors continue to ferment, the possibility of breaking below 74,000 cannot be ruled out.
If the price unexpectedly breaks 77,200 and stabilizes, then the bearish outlook will pause, and I will shift to a wait-and-see position. However, given the current macro environment, this probability is relatively low.
Risk Warning
The macro bearish factors are concentrated, and market volatility may intensify. Please strictly control positions, with individual risks not exceeding 2% of total capital.
Follow Qinglan's Crypto Classroom for precise entry points! www.qinglan.org
📊 Qinglan TPV trading strategy backtest reference
🕒 Last backtest time 04-30 07:00:02
Total analysis: 1193 Backtests: 1187 Accuracy: 70.6% (838/1187)
免责声明:本文章仅代表作者个人观点,不代表本平台的立场和观点。本文章仅供信息分享,不构成对任何人的任何投资建议。用户与作者之间的任何争议,与本平台无关。如网页中刊载的文章或图片涉及侵权,请提供相关的权利证明和身份证明发送邮件到support@aicoin.com,本平台相关工作人员将会进行核查。