Bitcoin Market Analysis Reference for April 30:
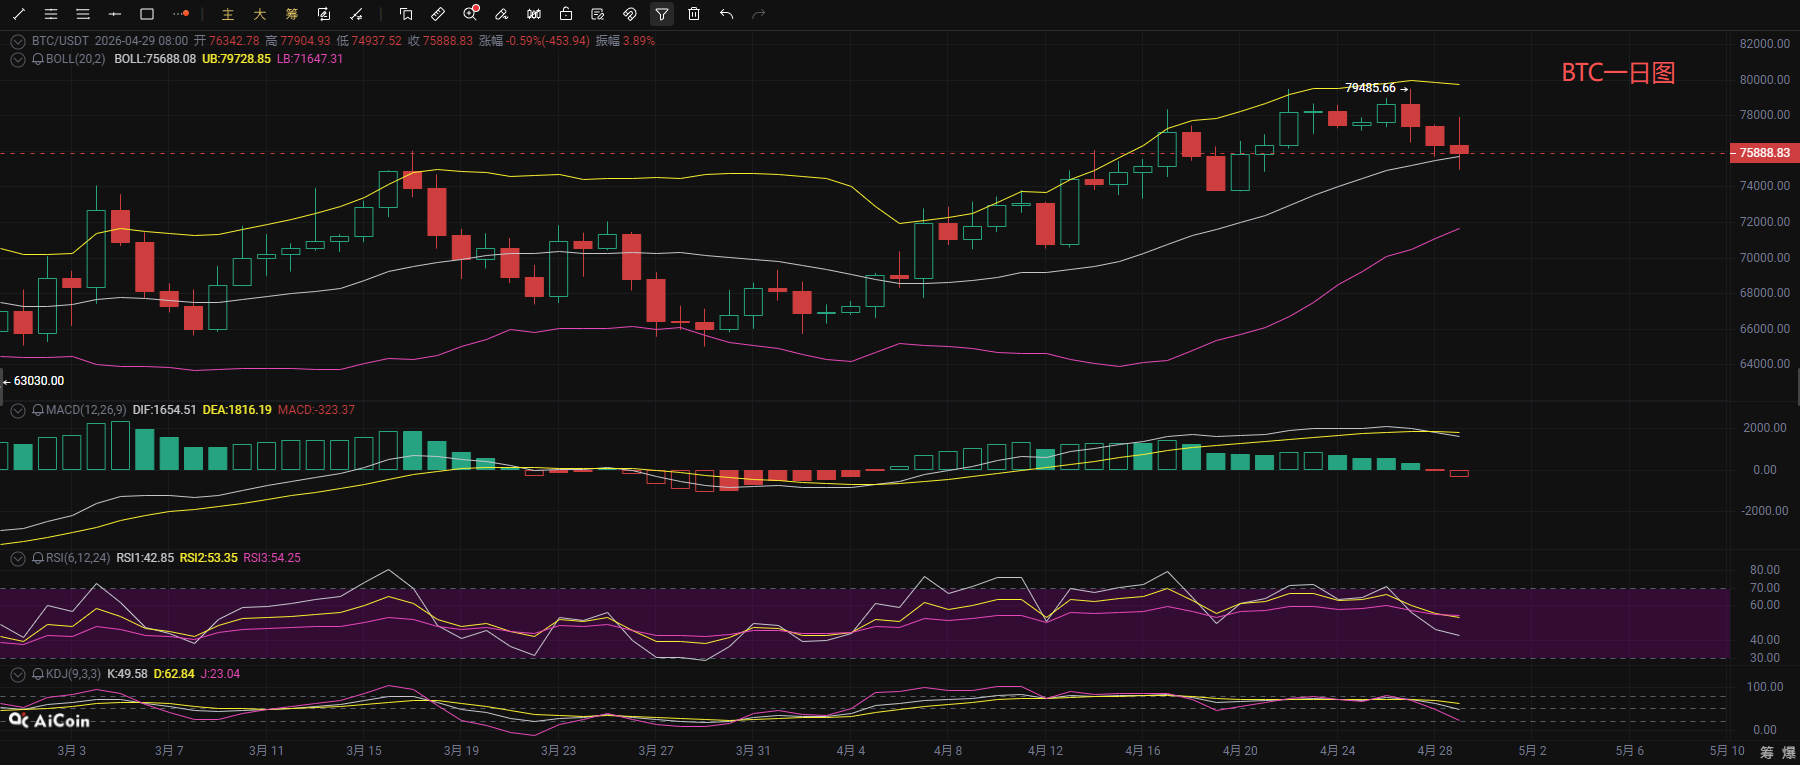
After reaching a recent high, Bitcoin has been continuously falling back, with a low point around 74900 stopping the decline and leading to a slight rebound. As of the time of writing, the price is running around 76000. Observing the daily chart, BTC’s current price is close to the middle track support level; the upper and middle bands of the Bollinger Bands are maintaining well, and the overall trend has not completely deteriorated. In the MACD indicator, the DIF and DEA have formed a high-point death cross, with the histogram continuously expanding and bullish momentum gradually fading; RSI is turning downwards, and KDJ indicators have formed a death cross, confirming clear short-term correction signals. The price is currently below the EMA7, with short-term moving averages forming pressure, and there is still a possibility of breaking the middle track of the Bollinger Bands; operations should still be viewed with a weak bias at high levels, focusing on the gains and losses of the support levels.
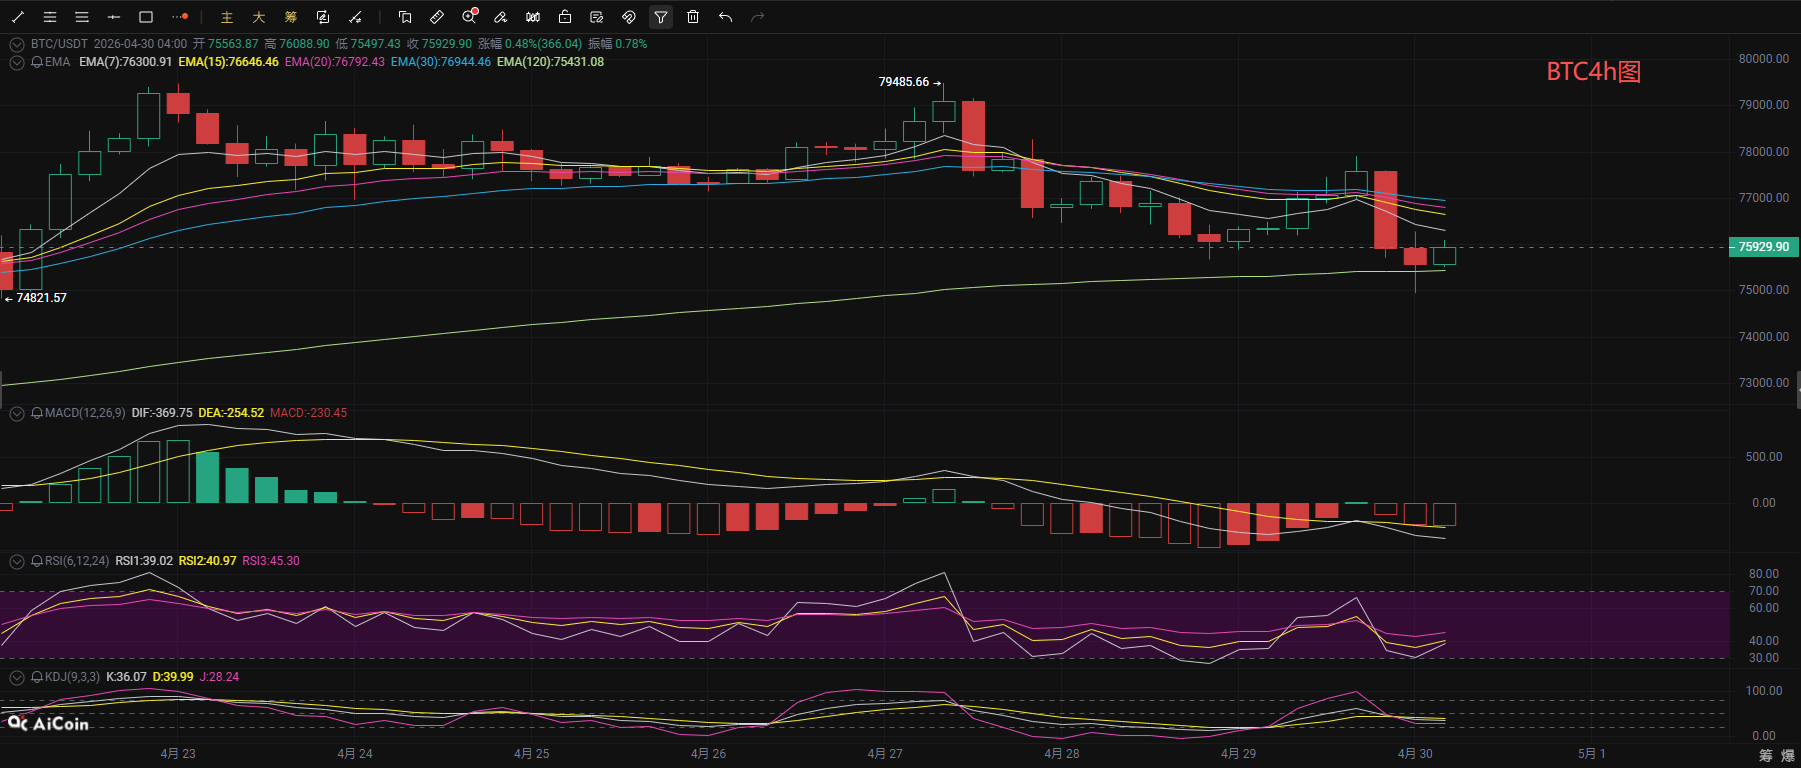
From the short-term 4-hour chart, BTC’s current price is between the middle and lower bands of the Bollinger Bands, which are opening downwards, and price pressure is evident. The MACD indicator shows the DIF running below the DEA, with the histogram continually releasing and bearish momentum dominating; RSI and KDJ indicators are fluctuating at mid-low levels, showing signs of a turn at low points. Although there is a demand for a rebound from the oversold state in the short term, the overhead pressure from EMA7 and EMA15 averages is dense, limiting the rebound potential. Support below looks at the 75000 round number and the lower band of the Bollinger Bands (75155). If it breaks below the recent low of 74937, it will open further downside space; resistance above is concentrated in the 77000-77500 range, and only a volumetric breakout of this range can alleviate the current weak pattern.
Bitcoin Short-term Reference for April 30:
Long Position: Buy in the range of 74200-75000, stop loss 500 points, target at 75500-76600,
Short Position: Sell in the range of 77600-76600, stop loss 500 points, target at 76000-75000,
【The above analysis and strategies are for reference only. Please bear the risks yourself. There may be delays in article review and publication, and the strategies may not have timeliness. Do not operate blindly】

This article content is originally shared by 【Bitcoin Market Waves】, representing personal opinions only. There may be delays in sending articles, and they are for reference only. Do not operate blindly! Want to get more real-time signals daily? Then follow my official account! Here you can engage in online technical learning, and also learn about knowledge regarding bailout and exit. I have years of research experience in the market, focusing on the major trends in the cryptocurrency space. I am mainly responsible for analyzing and guiding investment operations for BTC, ETH, SOL, BCH, etc. Welcome to research and learn together.
免责声明:本文章仅代表作者个人观点,不代表本平台的立场和观点。本文章仅供信息分享,不构成对任何人的任何投资建议。用户与作者之间的任何争议,与本平台无关。如网页中刊载的文章或图片涉及侵权,请提供相关的权利证明和身份证明发送邮件到support@aicoin.com,本平台相关工作人员将会进行核查。