Academician of the Coin Circle: What signals are hidden in the K-line of Bitcoin on April 29? Even beginners can understand at a glance! Latest market analysis and trading suggestions
Bitcoin is currently at 76300, stop blindly chasing highs and selling lows! The current price of Bitcoin is 76300, you understand how fierce the competition between bulls and bears is! Today, I will directly use the daily and four-hour dual time frames to calculate support, resistance, bull-bear points, and stop-loss points clearly, refusing to be led by the market, and you will know how to operate next after reading!
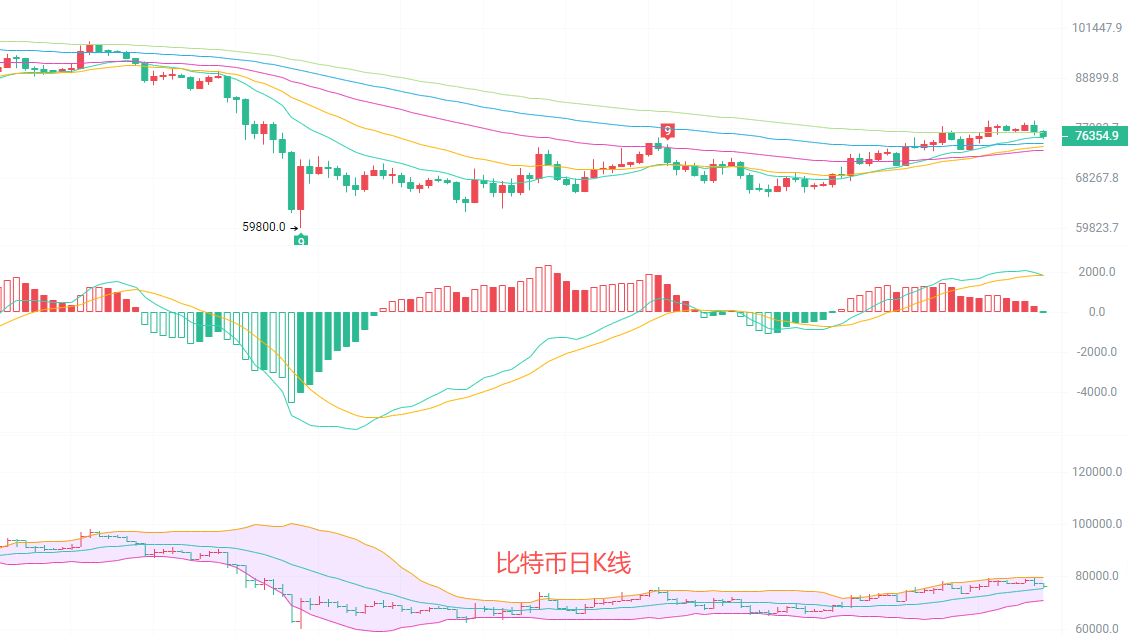
The daily K-line closed at 76319, down 1.31%, the price stabilized after retracing to the EMA30 moving average, and the moving averages continue to align upwards, with a long-term bullish trend. The MACD red column is shortening, and the upward momentum is slowing, indicating a lack of strength in short-term upward movement. The Bollinger Bands are narrowing, with the price oscillating between the middle and upper bands, the key support is the Bollinger middle band near 75400, if held, the oscillating bullish pattern remains unchanged; if broken, there is a risk of further retracement.
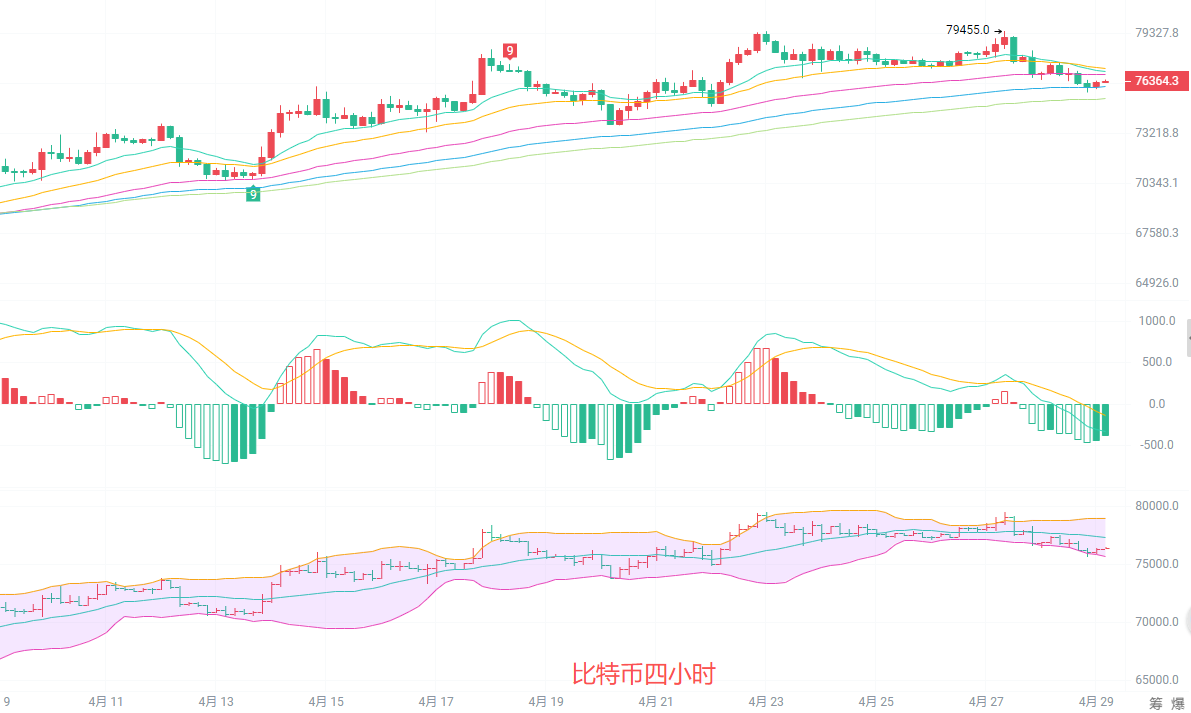
On the four-hour level, BTC encountered resistance at 79455 and fell back, breaking through the short-term moving average group, changing the short-term trend from bullish to weak. The MACD formed a death cross, with green columns continuously increasing, and the downward momentum prevailing. The Bollinger Bands are opening downwards, with the price running below the middle band, the upper band near 77400 is strong short-term resistance, the lower band near 75800 is support, and the four-hour is in an adjustment cycle, waiting for support confirmation; before this, hold onto your positions and stay alive.
Short-term trading idea reference: follow the trend of the larger cycle, small stop-loss and quick entry and exit
For the upward movement from 76000 to 75500, with a stop-loss at 75000, target at 77600 to 78500, and break point at 79400.
For the downward move from 77800 to 78000 encountering resistance, with a stop-loss at 78700, target at 76500 to 76000, and break point at 75500.
Opportunities in the market are never lacking, what is lacking is patience and discipline. Do not let temporary ups and downs affect your mindset; if uncertain, observe. A wrong stop-loss is a hundred times better than holding onto a position until liquidation occurs.

Warm reminder: The above content is solely created by the author of the public account, the advertisements at the end of the article and in the comments section are unrelated to the author, please discern carefully, thank you for reading.
免责声明:本文章仅代表作者个人观点,不代表本平台的立场和观点。本文章仅供信息分享,不构成对任何人的任何投资建议。用户与作者之间的任何争议,与本平台无关。如网页中刊载的文章或图片涉及侵权,请提供相关的权利证明和身份证明发送邮件到support@aicoin.com,本平台相关工作人员将会进行核查。