Master discusses hot topics:
Let's talk about the recent oil prices, the increase indicates that the situation in the Strait of Hormuz isn't over yet. The inflation in the U.S. hasn't eased at all, and in a high-inflation environment, wanting to easily lower interest rates in 2026 seems challenging.
It looks precarious! With continuous delays and back-and-forth movements, it's possible that the crazy antics of certain individuals will resume, so it’s better if things can be resolved quickly.
Back to the market, the trading volume is pitifully low, and the investors yesterday showed no reactions. Now, prices are fluctuating chaotically, mainly due to the conflict between the U.S. and Iran, combined with the inflation and recession expectations in the strait. If this issue isn't completely resolved, the prospect of a smooth transition into the next stage seems bleak.
As soon as U.S. stocks opened last night, some individuals began dumping their assets. Every few minutes, millions of dollars were sold off, and today's downward trend is likely to continue. Yesterday, the bulls barely managed to push up to 80K, only to be slapped back by the bears.
Recently, the main force has been pushing prices along the 20-day moving average at the 12-hour level, with each pullback resulting in a large green candle. However, yesterday it hit a high and was directly slapped down. The trading volume was terribly low, and it barely managed to rebound to 76.5k after a night pullback. Today, it broke below the 5-day moving average for the first time, making the outlook uncertain.
The beginning of May is crucial, and it's very likely a top for the daily and weekly charts! The highest point in April was firmly pressed at the 3-day moving average resistance around 79.5K, just one step away from 80K.
This week, the Federal Reserve's interest rate meeting is imminent, and I mentioned in my analysis yesterday that it might be a turning point. The level of 78.8K needs to be effectively broken through three times at least; yesterday morning was the second time, and it still stalled at 79.5K.
With just two days left in the month, the monthly line is about to close, so we'll have to see if the prices dare to continue climbing on the non-farm payroll day next Friday.
To conclude, I'm betting on a phase of both bulls and bears getting wiped out before a real drop begins. The fall from 79K has been so smooth that the market is already filled with shorts. It's not surprising to see people chasing the shorts now.
After years of trading, my experience tells me that the more obvious the openings seem, the more likely they are traps set by market manipulators. The drop from 79K is too natural, and with too many shorts accumulated, the probability of a drastic drop is low.
Master looks at the trend:
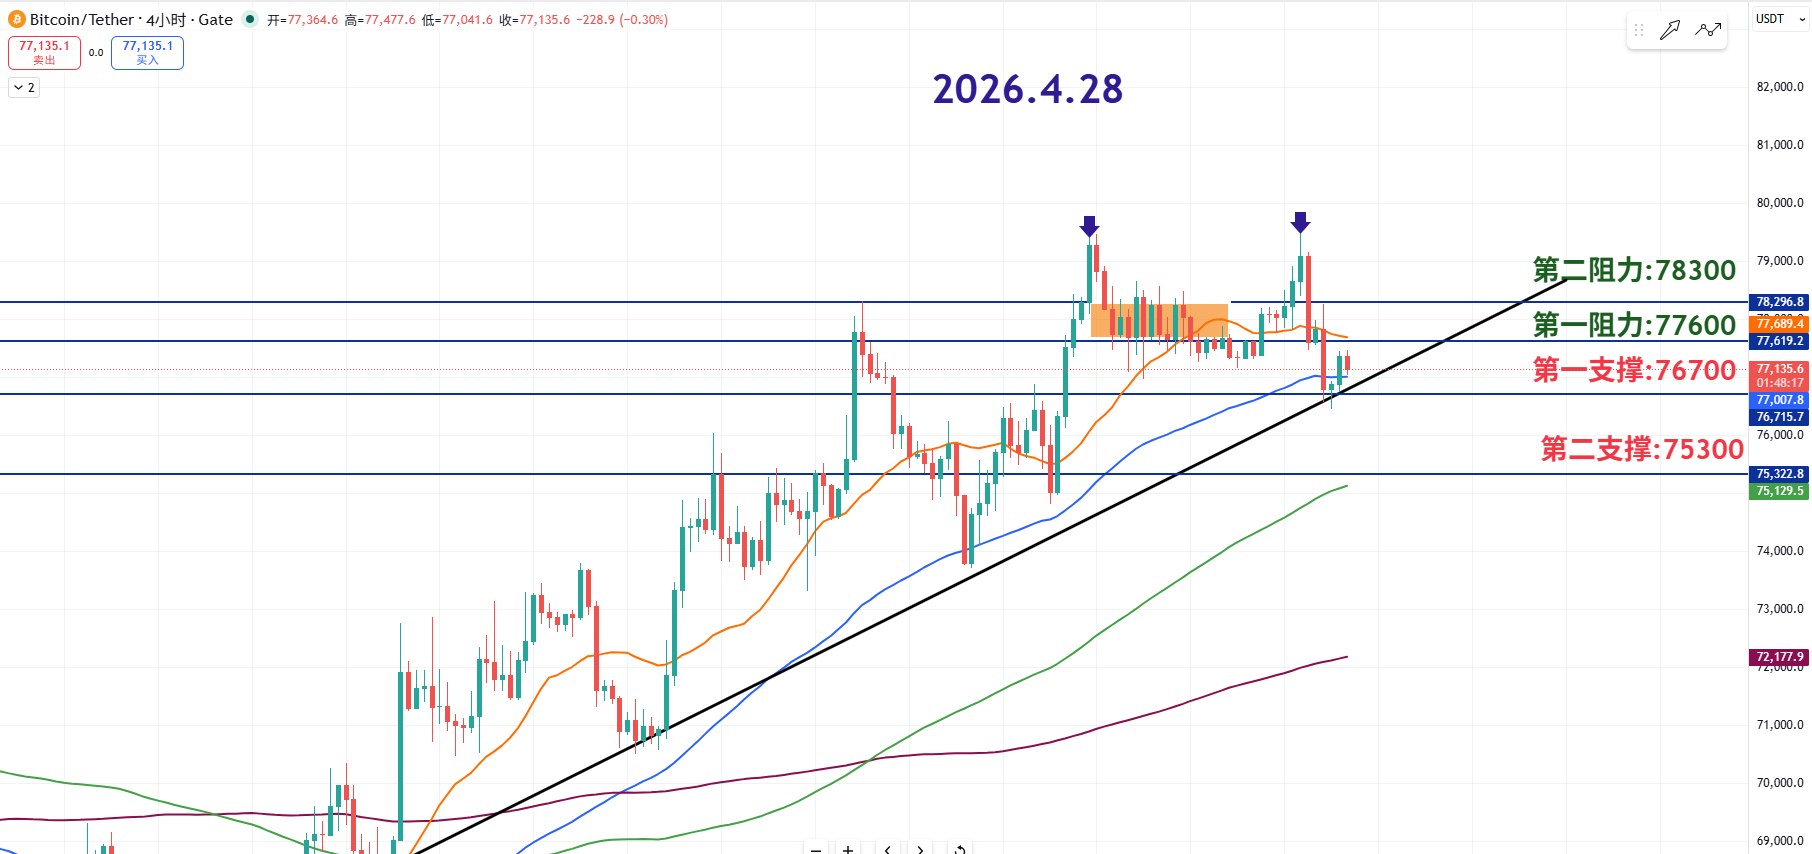
The current price is in the 77.3K range, and the overall structure is still in a short-term upward trend, but there is still a risk of pullback. The current position is right near the upward trend line, which belongs to the range of continuing upward movement after a pullback.
From a technical perspective, after rising from 74K to 78K, the current upward trend line also serves as important support. It’s likely to first experience some fluctuations before forming a range-bound market.
The current price is near the trend line and support level, but the probability of continuing to rise after an intraday pullback is still quite high. If it breaks below the support at 76.7K, there may be a significant drop in the short term.
The first support around 77.6K is likely to see a significant pullback, while the second support at 78.3K, if it cannot hold, will shift the overall trend into a range-bound market.
The 76.7K level is a significant support area where the upward trend and support lines coincide, making it very critical. If it can stop the decline and rebound here, the main force may launch another upward movement.
4.28 Master’s segment pre-set:
Long entry reference: Buy in the range of 76000-76700, Target: 77600-78300
Short entry reference: Sell in the range of 77600-78300, Target: 76700-75300
If you genuinely want to learn something from a blogger, you need to keep following them, not rush to conclusions after just a few glimpses of the market. This market is filled with performers, with screenshots of long positions today and summaries of short positions tomorrow, making it look like “always catching the tops and bottoms,” but in reality, it's all hindsight. The bloggers worth following are those whose trading logic is consistent, coherent, and stands up to scrutiny, rather than those who come out with big claims once the market moves. Don’t be deceived by exaggerated data and out-of-context screenshots; long-term observation and deep understanding are needed to distinguish who is a thinker and who is a dream-maker!
This content is exclusively planned and published by Master Chen (Public account: Coin God Master Chen), with the same name across the internet. For more real-time investment strategies, unlocking concepts, spot trading, short, medium, long-term contract trading techniques, operational skills, and knowledge about candlesticks, you can join Master Chen for study and communication. A free experience group for fans and community live streaming projects have now been established!

Friendly reminder: The only public account (pictured above) that contains this article is written by Master Chen, and any advertising in the comments section is unrelated to the author!! Please be cautious in distinguishing truth from falsehood, thank you for reading.
免责声明:本文章仅代表作者个人观点,不代表本平台的立场和观点。本文章仅供信息分享,不构成对任何人的任何投资建议。用户与作者之间的任何争议,与本平台无关。如网页中刊载的文章或图片涉及侵权,请提供相关的权利证明和身份证明发送邮件到support@aicoin.com,本平台相关工作人员将会进行核查。