In the cryptocurrency circle, Li Ying: Bitcoin is stuck at 77420! Historical high oscillation, is it accumulation or the eve of a reversal? Latest market analysis and trading advice
Dear ones! The current price of Bitcoin is 77420, and it feels like walking on a tightrope, in a delicate position with no upward or downward movement. A couple of days ago, it barely surged to the historical high of 79472, but it couldn't hold, and was pushed back down, now it is oscillating between 77000 and 78000. This indicates that while the bulls want to push up, the selling pressure above is too heavy; as soon as there is a pull, it is slammed down; the bears are also hesitant to sell off, fearing there is buying support below. The entire market seems to be on pause, with both bulls and bears observing, neither willing to make the first move. This kind of market tests patience, novices may easily become anxious and chase highs and lows, while veterans quietly wait for direction to become clear.
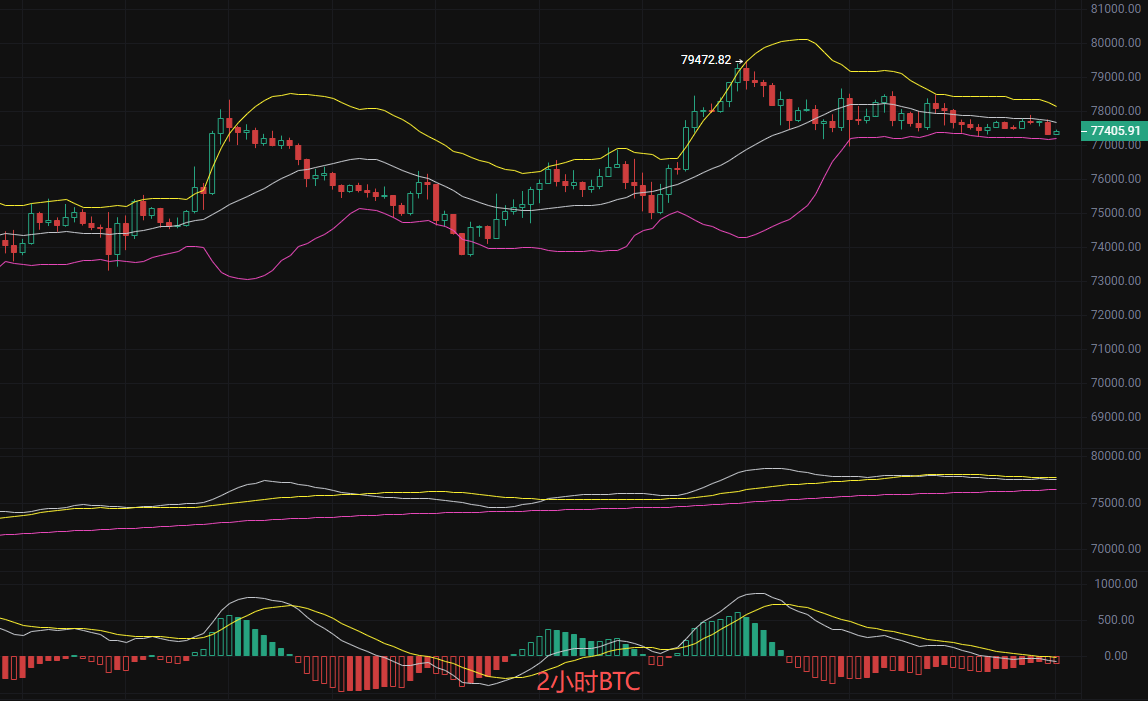
From the Bollinger Bands perspective, the current price is closely following the middle track at 77679, with the upper band at 78141 and the lower band at 77217 not far apart, showing that the channel is clearly narrowing, indicating extremely low market volatility, and it is on the eve of a trend change. In terms of the MACD indicator, both the DIF and DEA are operating above the zero axis, but the red bars are gradually shrinking, indicating a weakening of upward momentum, with a short-term adjustment needed. In the moving average system, MA7, MA30, and MA120 are intertwined, short-term moving averages are flat, and mid-term moving averages are slightly upward, suggesting that although the trend is generally bullish, there is short-term pressure. In summary, the indicators are in a critical state, lacking a clear direction, and a breakout or breakdown must be awaited for confirmation.
Short-term practical strategy (taught by Li Ying, accurately targeting the market)
Long strategy: Go long above 78000, target 78800 aiming for 79400, with a stop loss at 77200
Short strategy: Short below 77200, with a stop loss at 77800, target 76500 aiming for 76000
Key observation point: 77500 is the watershed for bulls and bears; if it holds, it leans bullish, if it breaks down, it leans bearish. Current advice is to stay on the sidelines and enter the market after clarity in direction is established, to avoid repeated stop-losses in oscillating markets. Position control should be at 10%-20%, with strict stop losses.
Risk warning: The above analysis by Li Ying is based on real-time market data and is for reference only, and does not constitute investment advice; trading risks are borne by the individual.

Warm reminder: The above content is solely created by the author on Weibo; the advertisements at the end of the article and in the comments section are unrelated to the author. Please discern carefully, thank you for reading.
免责声明:本文章仅代表作者个人观点,不代表本平台的立场和观点。本文章仅供信息分享,不构成对任何人的任何投资建议。用户与作者之间的任何争议,与本平台无关。如网页中刊载的文章或图片涉及侵权,请提供相关的权利证明和身份证明发送邮件到support@aicoin.com,本平台相关工作人员将会进行核查。