Coin Circle Li Ying: 4.25 Bitcoin stuck at 77420! Historical high volatility, is it a buildup or the eve of a reversal? Latest market analysis and trading advice
Family! The current price of Bitcoin is 77420, feeling overall like walking a tightrope, in a delicate position that is neither up nor down. Just a few days ago, it managed to surge to the historical high of 79472, but it couldn't hold that level and was knocked back down, now oscillating between 77000 and 78000. This indicates that although the bulls want to push upwards, the selling pressure above is too heavy; any rise is met with selling. The bears also do not dare to easily short the market for fear of support below. The entire market feels like it has been paused, with both bulls and bears watching, neither willing to act first. This kind of market tests patience the most; newcomers may easily chase highs and sell lows, while seasoned traders wait quietly for direction to clarify.
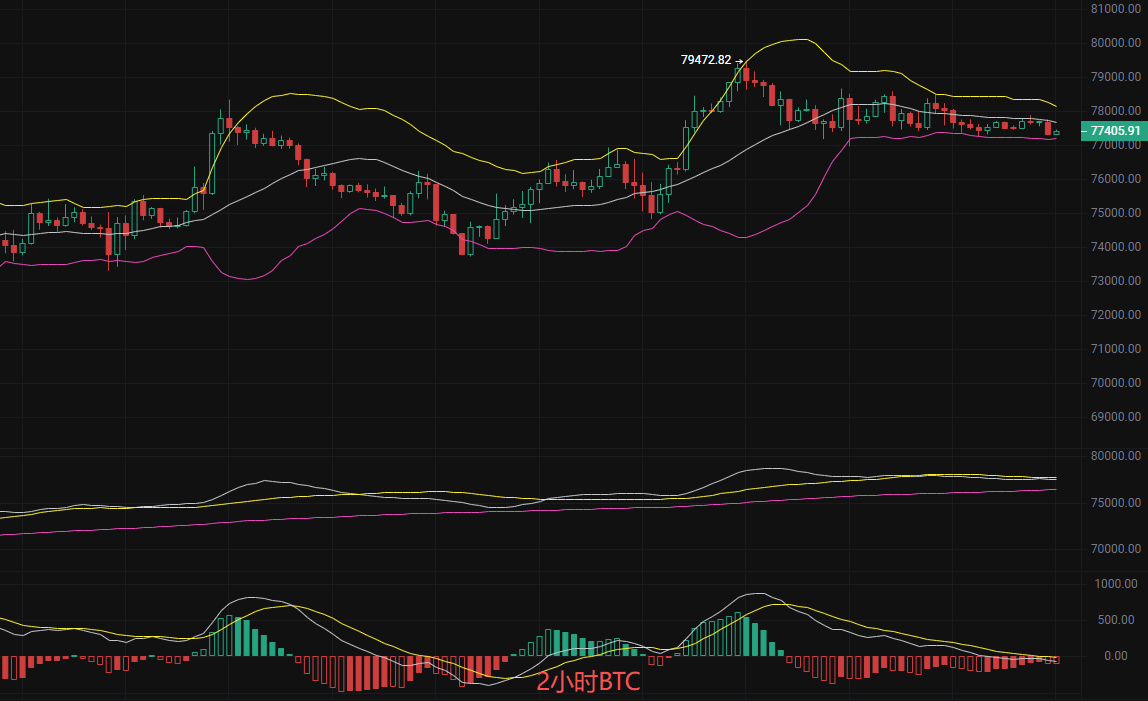
From the Bollinger Bands perspective, the current price is closely aligned with the middle band at 77679, with the upper band at 78141 and the lower band at 77217 not far off, indicating that the trading range is clearly narrowing and that the market volatility is extremely low, on the verge of a trend shift. In terms of MACD indicators, both DIF and DEA are operating above the zero line, but the red bars are gradually shortening, showing that the upward momentum is weakening, implying a short-term need for adjustment. In the moving average system, MA7, MA30, and MA120 are interwoven, with short-term moving averages flattening out and mid-term moving averages slightly rising, suggesting that although the trend leans bullish, there is short-term pressure. Overall, the indicators are in a critical state, lacking a clear direction, and need to wait for a volume breakout or a confirmed breakdown.
Short-term practical strategy (Li Ying's personal guidance, accurately aligned with the market)
Long strategy: Go long above 78000, target 78800 aiming for 79400, stop loss at 77200
Short strategy: Go short below 77200, stop loss at 77800, target 76500 aiming for 76000
Key observation point: 77500 is the dividing line between bulls and bears; holding above it indicates a bullish sentiment, while breaking below it indicates a bearish sentiment. The current suggestion is to wait and see, entering the market only when the direction is clear, to avoid repeated stop losses in a choppy market. Position size should be controlled at 10%-20%, with strict stop losses.
Risk warning: The above analysis by Li Ying is based on real-time market data and is for reference only, not constituting investment advice; trading risks are borne by individuals.

Warm reminder: The above content is solely created by the author on Weibo, and the ads at the end of the article and in the comment section are not related to the author; please discern carefully. Thank you for reading.
免责声明:本文章仅代表作者个人观点,不代表本平台的立场和观点。本文章仅供信息分享,不构成对任何人的任何投资建议。用户与作者之间的任何争议,与本平台无关。如网页中刊载的文章或图片涉及侵权,请提供相关的权利证明和身份证明发送邮件到support@aicoin.com,本平台相关工作人员将会进行核查。