Is Ethereum's main capital fleeing? What signals are hidden behind the stagnant price increase?
The current price of Ethereum is 2342, having climbed to a small plateau after surging up from the low of over 2100, now resting around 2340. The upper band of the Bollinger Bands is around 2436, like a small threshold; the previous high point of 2463 is an even more noticeable peak. Recently, the price has tried multiple times to break through 2400 but struggled, with buyers beginning to hesitate and sellers wanting to secure profits. Simply put, there is a desire to rise, but pushing straight up is a bit exhausting; there is a desire to fall, but there are many hands below supporting it, creating a tug-of-war between bulls and bears. Going forward, if it can push through 2463 with volume, the path will be clear; if it fails to break through multiple times, it might turn back to 2300 or even lower to find support.
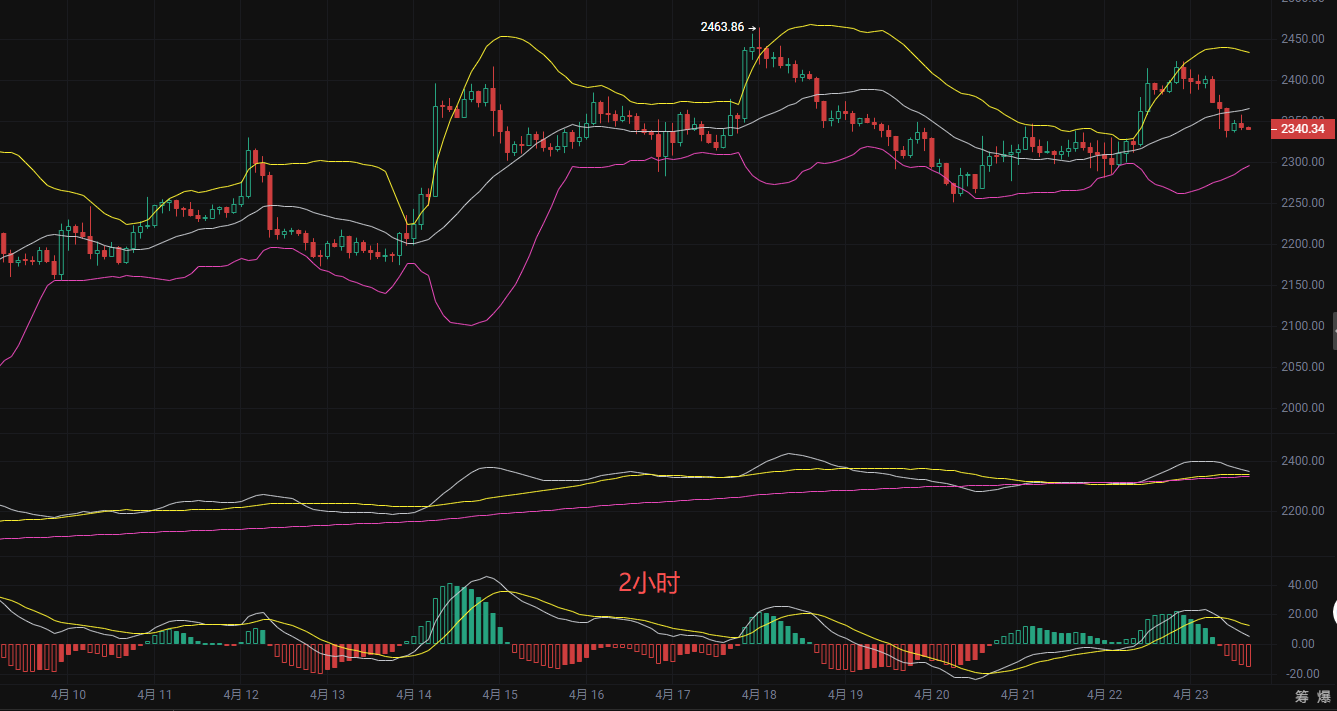
Technical analysis of various indicators shows that the price is running below the middle band of the Bollinger Bands at 2363 and above the lower band at 2290, with the Bollinger Bands in a narrowing state, suggesting that short-term volatility may contract and a direction is imminent. In the moving average system, the MA7, MA30, and MA120 are in a tangled state where the short-term and medium-term moving averages are almost fused, indicating that bullish and bearish forces are temporarily balanced. The lower MA120 and the lower Bollinger Band at 2290 together constitute a key support zone. The MACD indicator shows that the DIF and DEA have crossed downwards near the zero axis and are diverging, with the green momentum bars continuing to amplify, confirming that short-term bearish momentum prevails. However, it needs to be combined with the price structure: if the price breaks below 2300 and the lower Bollinger Band MA120, the risk of a correction will increase; if it stabilizes in the 2300-2340 range, there is still a possibility of a rebound to challenge 2400.
Bullish and bearish entry point suggestions
Enter long positions in batches at 2300-2320. Set a stop loss at 2280, with a target of 2450-2480.
Enter short positions lightly at 2390-2410. Set a stop loss at 2450, with a target of 2300-2280.

Friendly reminder: The above content is solely created by the author on Weibo. The advertisements at the end of the article and in the comments are unrelated to the author; please discern carefully, thank you for reading.
免责声明:本文章仅代表作者个人观点,不代表本平台的立场和观点。本文章仅供信息分享,不构成对任何人的任何投资建议。用户与作者之间的任何争议,与本平台无关。如网页中刊载的文章或图片涉及侵权,请提供相关的权利证明和身份证明发送邮件到support@aicoin.com,本平台相关工作人员将会进行核查。