Cryptocurrency Expert: 4.22 Ethereum Latest Market Analysis and Trading Suggestions
The current price of Ethereum is 2304. At present, this market for Ethereum is, frankly speaking, just stuck in a range that tests patience. There's no volume when it goes up, and there's support when it comes down, but chasing after the price will get you hit from both sides. Don’t listen to others shouting about a big market coming; it’s just a period of consolidation and accumulation now. Until the key levels are broken, don’t go all-in with heavy positions, and don’t hold onto positions randomly, especially for friends who have followed me from 1800 through the ups and downs, be prepared for taking profits on retracements.
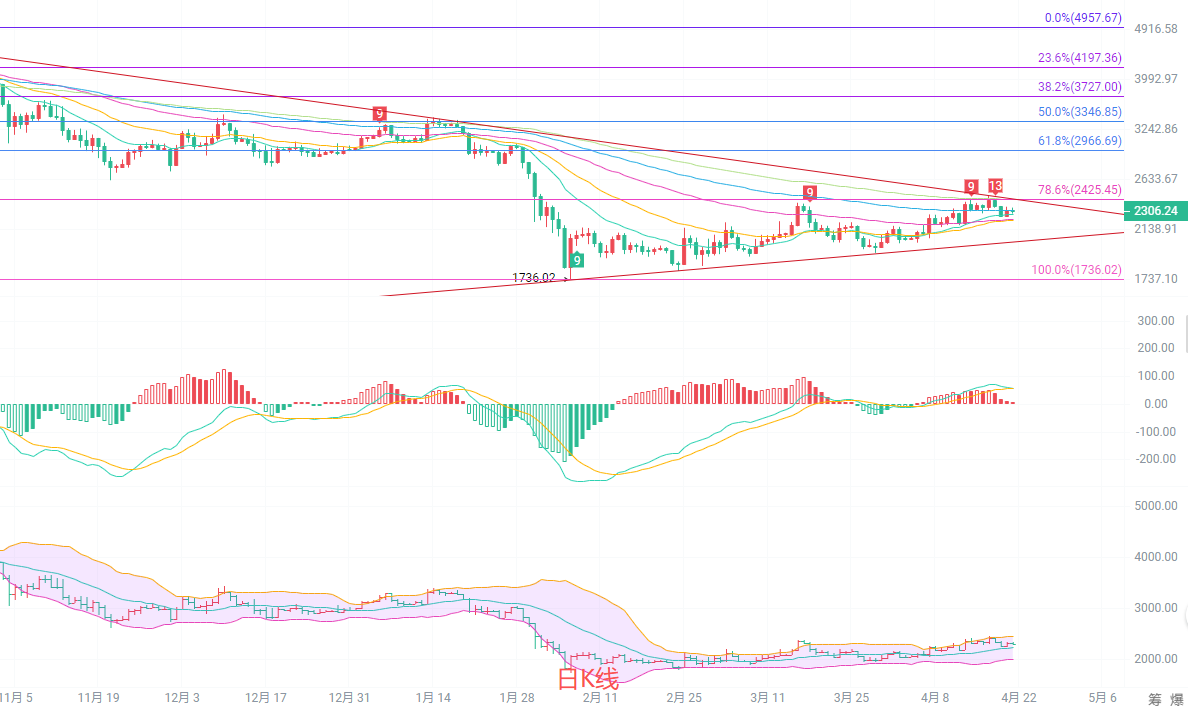
The daily candlestick is maintaining above the EMA15 and EMA30, with the bullish arrangement of moving averages still intact, indicating that the medium-term trend remains bullish. However, the MACD red bars are continuously decreasing in volume, with bullish momentum clearly weakening, and the Bollinger Bands are continuously narrowing, with prices repeatedly testing near the middle band, ranging between 2200 and 2400. From the low point of 1736’s rebound, it is currently in a high-level consolidation phase, with no significant volume breaking the previous high and no breach of key support, indicating a short-term period of directional choice.
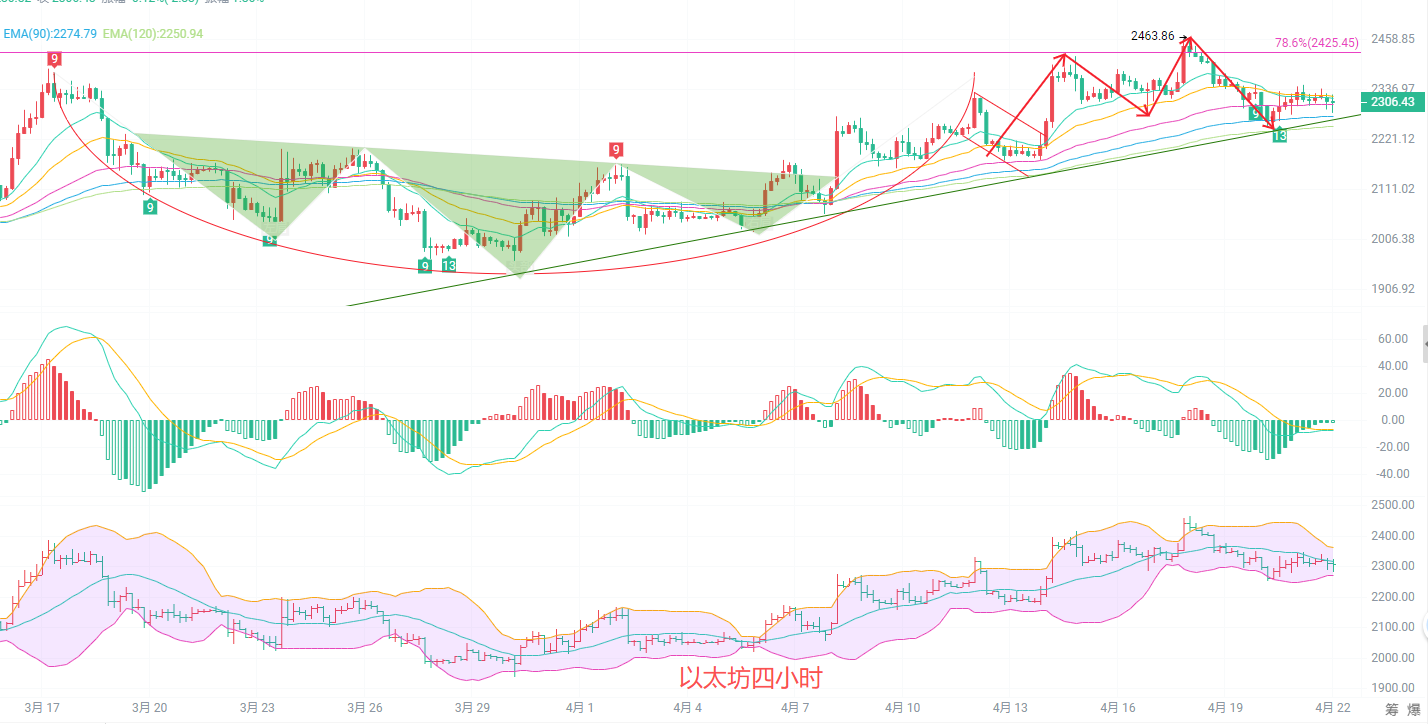
The four-hour candlestick is oscillating horizontally around 2300, with the EMA15 and EMA30 flattening out, signifying a balance between the bullish and bearish forces. The MACD green bars have slightly expanded, indicating a short-term pullback signal. The middle band near 2310 is forming resistance, and there is support near the lower band at 2270. The previous rise from 1936 to 2463 saw decreasing volume, and the selling pressure at high levels is clear. The current oscillation belongs to a correction after an increase, and without new incremental capital entering the market, it’s difficult for bulls to directly break the previous high.
Short-term reference: (Actual trading data has been updated; please consult the author for details)
For upward movement from 2270 to 2300, set a stop-loss at 2245 and aim for targets of 2350 to 2400.
For downward movement from 2390 to 2410, set a stop-loss at 2465 and aim for targets of 2320 to 2285.
In a volatile market, do not chase positions; test with light positions, take profits in batches, and don’t go all-in.
Specific operations should be based on real-time market data. For more detailed information, please consult the author. The publication may have delays; this is for reference only, and risks are to be taken by yourself.

Warm reminder: The above content is only created by the author of the official account. The advertisements at the end of the article and in the comment section are unrelated to the author. Please discern carefully, and thank you for reading.
免责声明:本文章仅代表作者个人观点,不代表本平台的立场和观点。本文章仅供信息分享,不构成对任何人的任何投资建议。用户与作者之间的任何争议,与本平台无关。如网页中刊载的文章或图片涉及侵权,请提供相关的权利证明和身份证明发送邮件到support@aicoin.com,本平台相关工作人员将会进行核查。