This week, the market is seeking direction amidst fluctuations, with opportunities and risks coexisting. The daily wave structure of HYPE is facing a critical validation point, where the success or failure of the $40.17 support will determine the subsequent trend; BTC is hovering between the continuation of the D wave rebound and pressure zones, with the core focus being the long and short competition in the $73,500 to $79,000 range.
Acting according to the trend and strictly adhering to discipline are essential for steady progress in a complex market.
This week's core trading viewpoints summary:
• Analysis of current HYPE price movements structure. (Detailed explanation in the first part)
• HYPE's expected market movement and short-term operational strategies for this week. (Detailed explanation in the second part)
• BTC multi-period movement structure analysis. (Detailed explanation in the third part)
• BTC's expected market movement and mid-short-term operational strategies for this week. (Detailed explanation in the fourth part)
Last week's trading strategy and core viewpoints market validation:
• Short-term trading effectiveness of HYPE: Last week, HYPE completed a short-term long position operation (1x leverage), achieving a cumulative profit of approximately 6.80%. (Detailed explanation in Table 1)
• Market validation of HYPE's predicted price movements: In previous articles, we pointed out that HYPE has initiated a rebound from the April 2 low of $34.44, which belongs to a potential wave 5 uptrend at the daily level. The current market movements validate our previous viewpoint. Last week's market rebound reached a high of $45.75, successfully breaking the wave 3 high of $43.78 from March 18, and setting a new high for this rising trend.
• Mid-term trading effectiveness validation of BTC: Bitcoin followed the established medium-term strategy last week, continuing to hold a short position established at $89,000 (1x leverage), ending last week with approximately 17.08% profit (around $73,800) and reaching a maximum profit of about 32.58% during the period.
• Market validation of BTC's predicted price movements: In last week's article, we pointed out that the market would maintain a wide range oscillation pattern. The current market movements validate our previous predictions.
1. HYPE: Movement Structure Analysis
HYPE 4-hour K-line chart
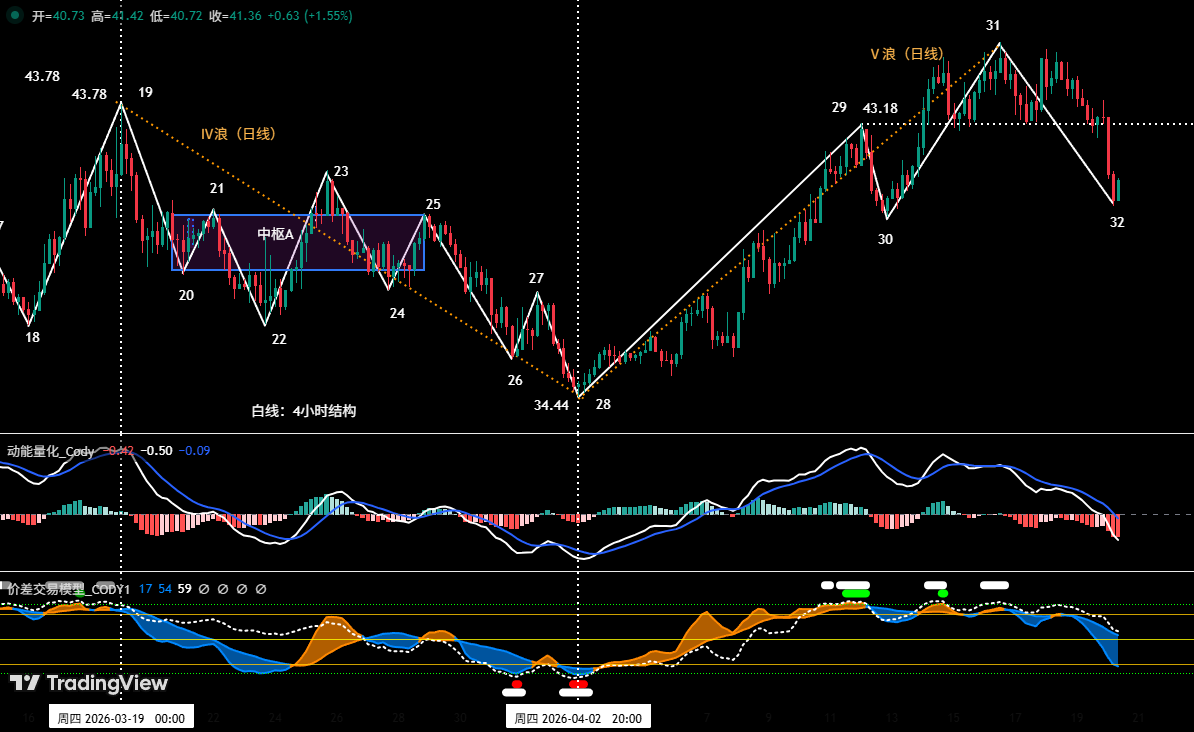
Figure 1
1. As shown in (Figure 1), HYPE reached a new high of $45.76 on April 16, creating a rebound high since the January 21 low of $20.46, and has surpassed the previous high of $43.78 from March 18 (the wave 3 high). Therefore, the upward trend that started from the April 2 low of $34.44 can be temporarily viewed as a wave 5 rising structure at the daily level and is currently in operation.
2. As shown in (Figure 1), this daily wave 5 can be further subdivided into four segments of upward structure: 28-29, 29-30, 30-31, and 31-32.
3. The current market is running in the adjustment phase from 31 to 32.
• In HYPE's 4-hour structure, our self-built momentum quantification model has detected that two momentum signal lines have synchronized to run below the zero axis, indicating that this adjustment may extend.
• Currently, the potential adjustment endpoint (i.e., endpoint 32) is nearing the previous support level of $40.17 (i.e., endpoint 30).
2. HYPE's Expected Market Movement and Short-term Operational Strategies for This Week
1. Expected movement of HYPE this week:
As shown in (Figure 1), pay attention to whether endpoint 32 breaks below endpoint 30 (i.e., $40.17):
• If it stabilizes above, then maintain a box oscillation between $40.17 and $45.76;
• If it breaks this support level, and the following rebound high cannot exceed $45.76 (i.e., endpoint 31), it will form a classic technical pattern of "adjustment breaks previous lows, but subsequent rebounds do not create new highs." This would indicate that the wave 5 rising structure at the daily level that started from the April 2 low is very likely to have ended at $45.76.
2. HYPE's Short-term Operational Strategies for This Week:
• Based on the overall upward trend prediction, one should follow the "act according to the trend, buy low" strategy.
• Based on the self-constructed quantification model signals, using 30 minutes / 60 minutes as the operation cycle, utilize 30% of the position to capture buying opportunities.
• Opening strategy: HYPE faces an adjustment requirement at the beginning of the week. If the price approaches the key support at $40.17 and confirms signals to stabilize above the support, combined with bottom buying signals triggered by the two models, one may consider entering long positions and strictly adhere to stop-loss discipline.
3. Bitcoin Multi-Period Movement Structure Analysis
1. BTC Daily Wave Structure Division: (Based on the market after the peak on October 6, 2025)
Bitcoin _ Daily K-line chart:
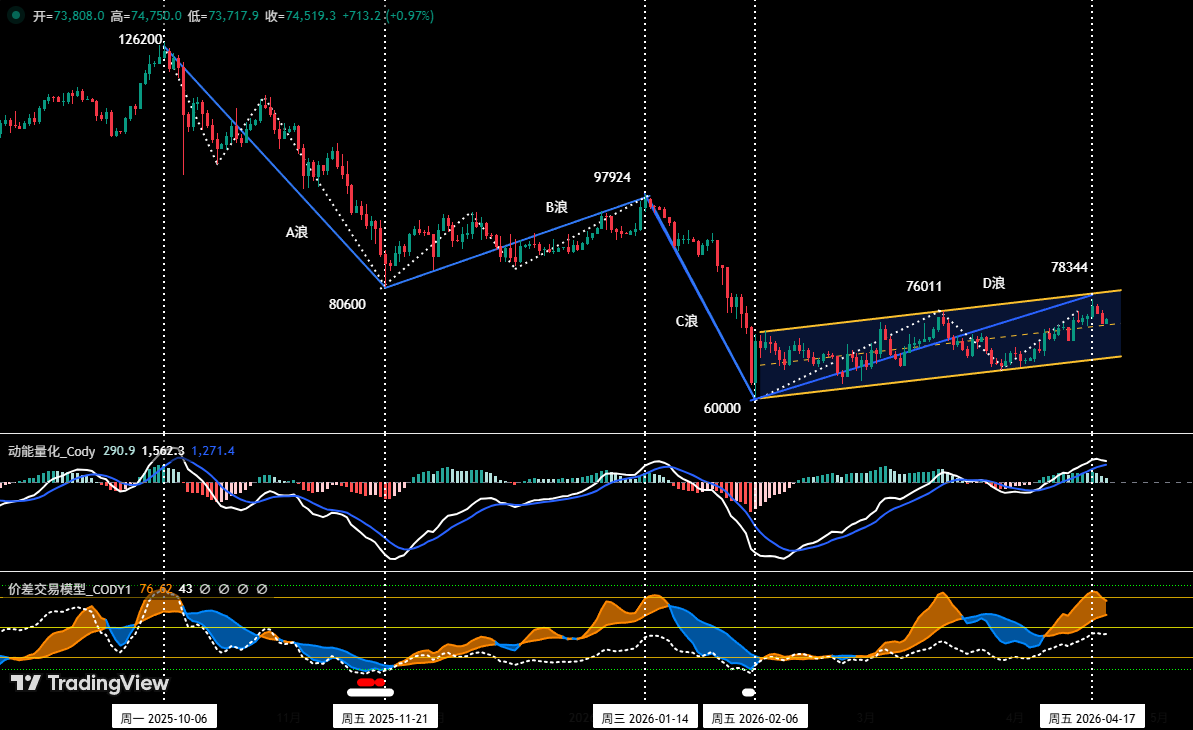
Figure 2
As shown in (Figure 2), since Bitcoin started its rebound from the February 6 low of $60,000, it not only created a new rebound high of $78,333 on April 17, but also has been running for approximately 73 trading days as of April 19, significantly exceeding our previous prediction of "C wave adjustment within the C-2 wave rebound" in both time and space (for example, its duration has far exceeded the 54 days of the B wave rebound). Therefore, based on the principles of wave theory analysis, the original framework may need to be adjusted. We prefer to redefine the current upward trend starting from $60,000 as a larger-level "D wave rebound," which more closely aligns with the current market's objective reality of trading time for space and extending rebound cycles.
The specific mid-term adjustment wave structure division can be optimized as follows:
• Wave A Adjustment (driving decline): began at the October 6, 2025, peak of $126,200 and ended at the November 21, 2025, low of $80,600, lasting about 46 days with a maximum decline of about 36%. This wave established the mid-term adjustment pattern.
• Wave B Rebound (complex adjustment): began at the low of $80,600 on November 21, 2025, and ended at the high of $97,924 on January 14, 2026, lasting about 54 days with a maximum rise of about 21.5%. This is a correction against the decline of wave A.
• Wave C Adjustment (main decline wave): began at the high of $97,924 on January 14, 2026, and touched the low of $60,000 on February 6, 2026, in a rapid decline manner, lasting about 22 days with a maximum decline of about 38.7%. This wave completed the main spatial part of the adjustment.
• Wave D Rebound (currently ongoing/possibly unfinished): began at the low of $60,000 on February 6, 2026, and as of April 19, has run for about 73 days with a maximum rise of about 30.6% (from $60,000 to $78,333). This round of rebound is characterized by prolonged time, complex structure, and currently faces key time windows and price resistance zones (e.g., $79,000 to $80,600) challenge. If wave D is established, a corresponding "wave E" adjustment may follow after the price rebound ends.
2. BTC: In-depth Structure Analysis
Bitcoin _ 4-hour K-line chart
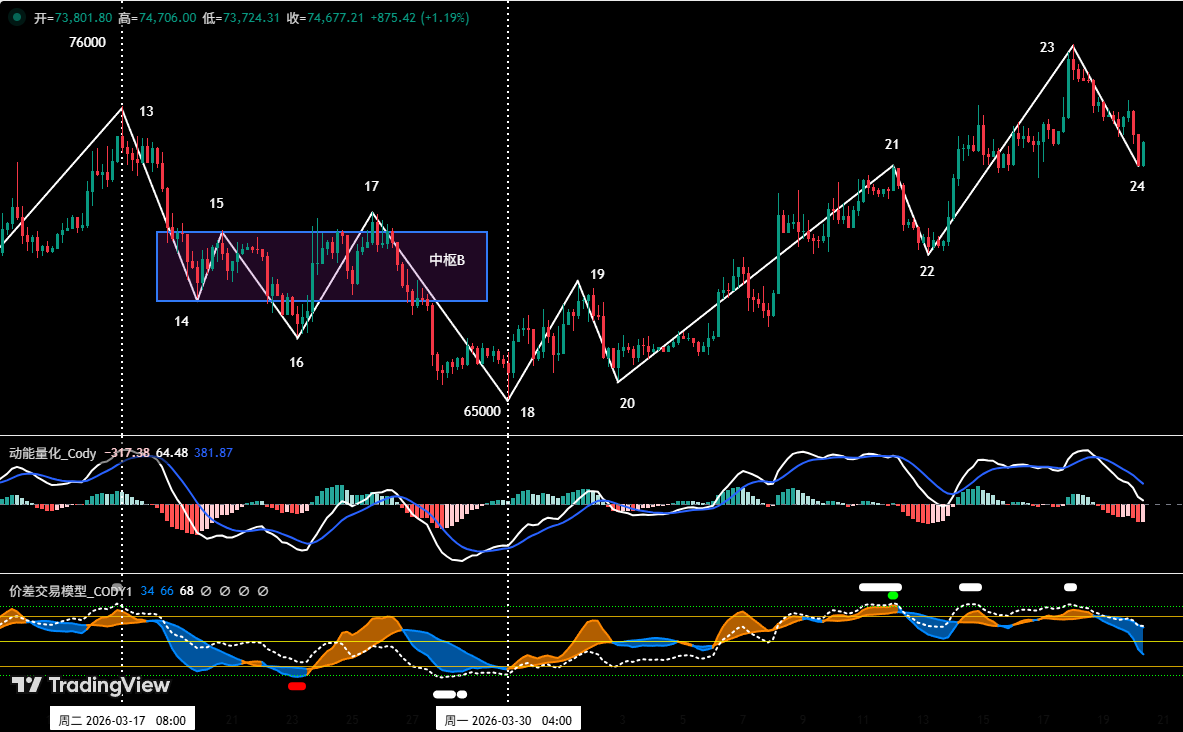
Figure 3
• Based on the market evolution after the March 30 low of $65,000.
• As shown in (Figure 3), BTC started oscillating upwards from the March 30 low. The structure from endpoint 18 to endpoint 24 consists of six segments: 18-19, 19-20, 20-21, 21-22, 22-23, and 23-24.
• The chart shows that from endpoint 18 to endpoint 23, a clear 5-wave rebound structure has developed, and it is currently in operation from 23 to 24. From our self-built arbitrage trading model, signals have been continuously issued indicating a potential top (green dots and white dots), suggesting that technical indicators are in a seriously overbought state and the market requires short-term adjustment.
4. Expected Market Movement and Operational Strategies for Bitcoin This Week
1. BTC Expected Movement This Week:
• Core viewpoint for this week:
The market currently maintains a range of $73,500 to $79,000, pay attention to the competition between bulls and bears near the upper and lower bounds. If there is a rebound that breaks the upper bound, the market will experience oscillating rebounds, but the space will be limited; if it effectively breaks below the lower bound, the price may further test the key support around $69,500.
2. Core Resistance Levels:
• First resistance area: $79,000 to $80,600 (near the November 2025 low)
• Second resistance area: $83,500 to $84,500 (previously dense trading area of both bulls and bears)
3. Core Support Levels:
• First support level: around $73,500 (previous important support level)
• Second support level: around $69,500 (previous important support level)
• Third support level: $65,000 to $66,000 (near the lower range of oscillation)
4. Operational Strategies for This Week (excluding sudden news impact): (04.20–04.26)
① Mid-term strategy:
Bitcoin _ Daily K-line chart: (Position Monitoring Model)
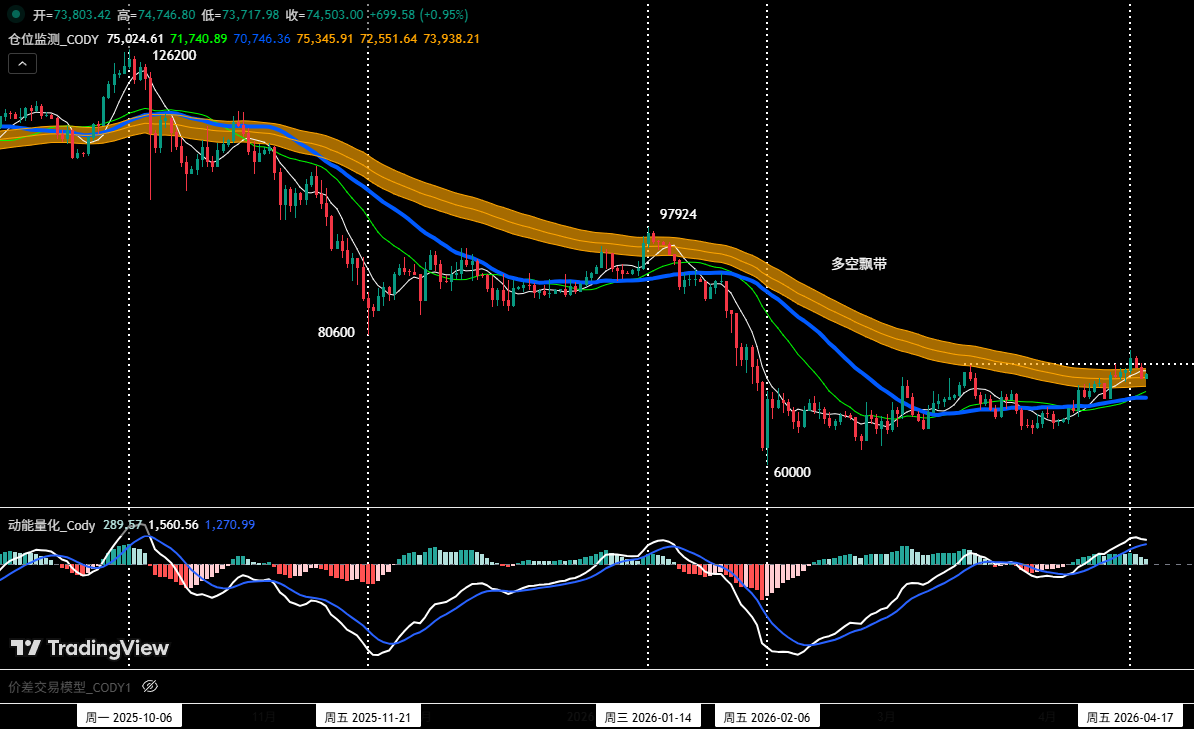
Figure 4
Position monitoring model: As shown in (Figure 4), currently, the price is oscillating near the bull-bear floating band. According to our strategy rules, we will hold the short position established at $89,000 (January 28) of 60%.
• If the price rebounds and effectively stabilizes above the bull-bear floating band this week, we will clear all mid-term positions.
② Short-term strategy: Utilize 30% of the position, set a stop-loss point, and look for trading "arbitrage" opportunities based on support and resistance levels. (Using 30-minute / 60-minute as the operation cycle).
③ Based on our prediction of the mid-term bearish trend, we should currently adhere to the operating principle of "trading with the trend". To dynamically respond to the market's complex evolution and integrate signals generated from our trading model, we will outline two short-term operation plans, A/B:
• Plan A: Rebound encounters resistance, sell high.
• Opening: When the price rebounds to the $76,500 to $79,000 area and triggers resistance signals while combined with the model's top signals, one may establish a 30% short position.
• Risk control: Initially set the stop-loss above $80,600.
• Closing: When the price falls to near important support levels and combines with model signals, one may gradually close positions to realize profits.
• Plan B: Trade short upon breaking the support.
• Opening: If the price continues to adjust and effectively breaks below the $73,500 support while combining with model top signals, one may establish a 30% short position.
• Risk control: Initially set the stop-loss above $74,500.
• Closing: When the price falls to a support level and combines with model signals, one may gradually close positions to realize profits.
5. HYPE: Operations Review
1. Short-term Operation Review: (See Table 1)
We strictly followed the operational plan, utilizing the trading signals issued by our self-constructed arbitrage trading model and momentum quantification model, completing a short-term (long position) operation last week, achieving a cumulative trading profit of 6.80%.
2. Summary of Short-term Trading Details of HYPE: (Leverage *1x)
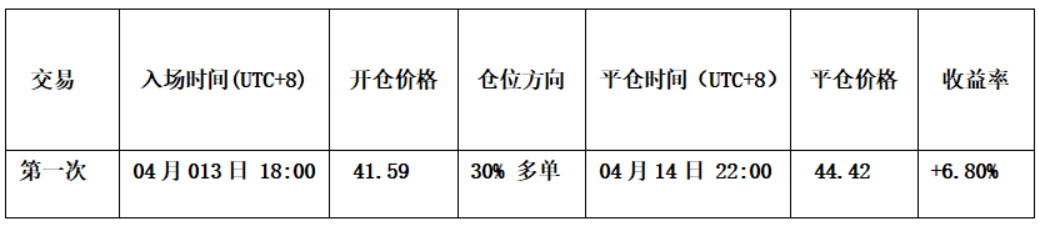
Table 1
3. Review of Short-term Trades: (See Figure 5)
• Opening strategy: First based on the assessment of the market's wave 5 upward trend; secondly, the arbitrage trading model issued early bottom warning signals (green dots in the chart); and lastly, both momentum lines in the momentum model simultaneously ran above the zero axis, and both models triggered a resonance with upward signals. We established a 30% long position at $41.59.
• Closing strategy: When the price reached near $45, it encountered resistance, and the arbitrage trading model triggered a strong top warning signal (green and white dots), leading us to clear all positions near $44.42.
• Summary: This trade successfully earned approximately 6.80% profit.
HYPE 60-minute K-line chart: (Momentum Quantification model + Arbitrage Trading model)
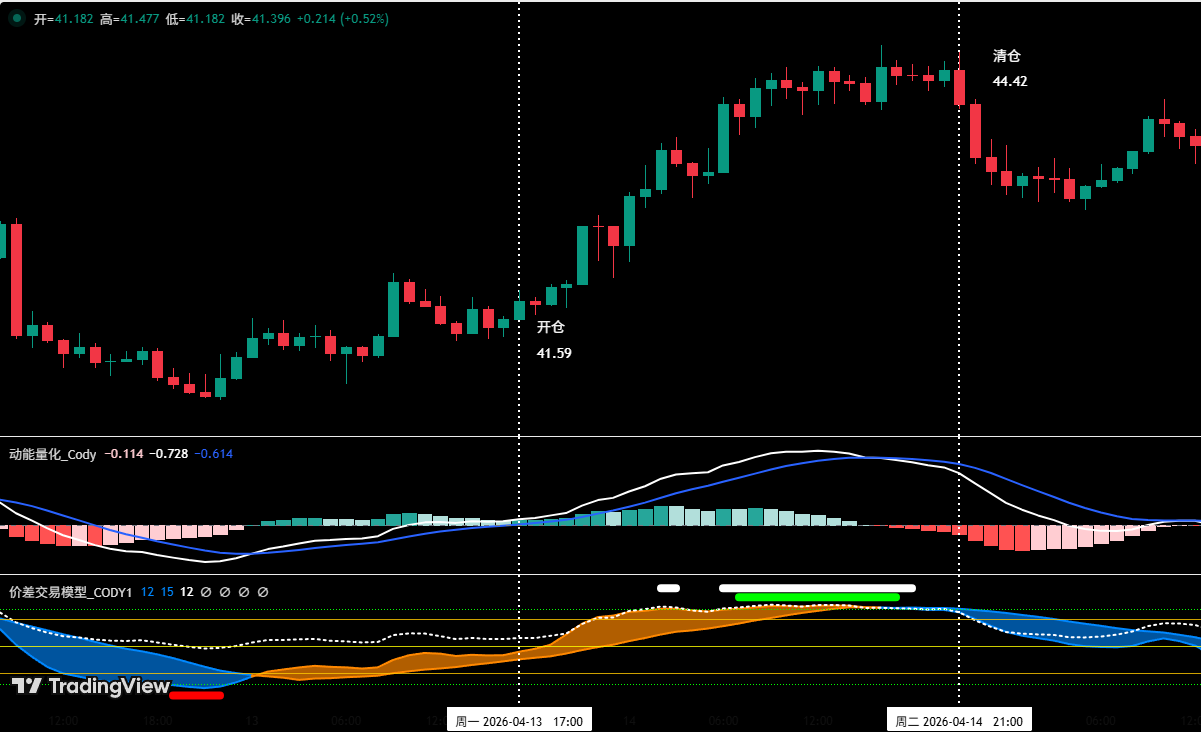
Figure 5 (Short-term Trading Graph)
6. Special Reminder:
1. When opening a position: immediately set the initial stop-loss level.
2. When profit reaches 1%: move the stop-loss to the opening cost price (break-even point) to ensure capital safety.
3. When profit reaches 2%: move the stop-loss to the position where profit is 1%.
4. Continuous tracking: thereafter, for each additional 1% profit, move the stop-loss by 1% concurrently to dynamically protect and lock in profits.
The financial market is rapidly changing, and all market analyses and trading strategies need to be adjusted dynamically. All viewpoints, analytical models, and operational strategies mentioned in this article are derived from personal technical analysis, serve only as a personal trading log, and do not constitute any investment advice or operational basis. The market has risks, and investment requires caution; please do not make decisions based on this.
免责声明:本文章仅代表作者个人观点,不代表本平台的立场和观点。本文章仅供信息分享,不构成对任何人的任何投资建议。用户与作者之间的任何争议,与本平台无关。如网页中刊载的文章或图片涉及侵权,请提供相关的权利证明和身份证明发送邮件到support@aicoin.com,本平台相关工作人员将会进行核查。


