Cryptocurrency Circle Academician: Bitcoin plummeted from a high of 4.20! Support level and key entry signals explained thoroughly! Latest market analysis and practical teaching
Bitcoin's current price is 74700, it's truly a sleepless night, many crypto friends can't sleep and are in a panic, just yesterday they were shouting to aim for 80,000, and today it has dropped back to 74,000. Many crypto friends have started to panic and cut losses, fearing being trapped at the peak. But I want to say, don’t let short-term fluctuations scare you! Today, I will use two candlestick charts to explain Bitcoin’s current trend, support, resistance, how to enter, and how to set take profits and stop losses clearly. No matter if you want to go long or short, after reading, you will have a solid understanding and not become a chopped cabbage.
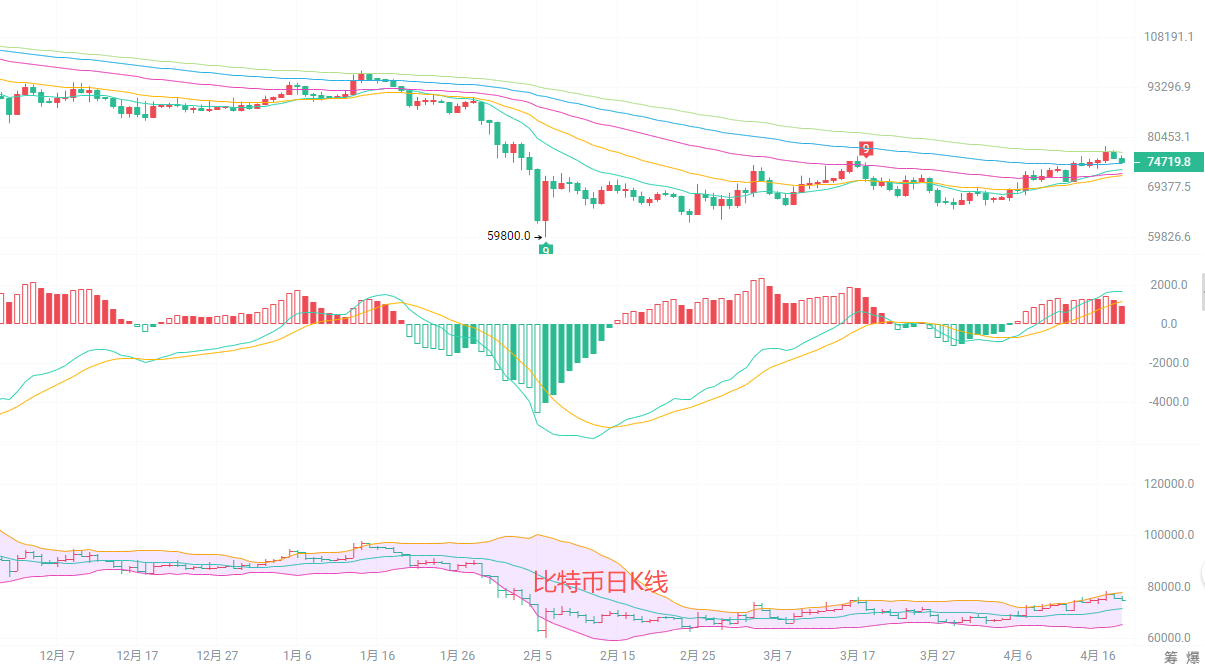
The daily candlestick chart price is still above all medium to long-term EMA averages, and the moving averages are still effectively arranged northwards, indicating that the medium-term upward trend has not fundamentally changed. The MACD red bars continue to shorten, showing that the upward momentum has weakened. The Bollinger Band is opening upwards, with the middle track at 71600 forming strong support. The current price is in the oscillation range between the upper track and the middle track, which is a normal adjustment within the upward process, and no trend reversal signals have appeared yet.
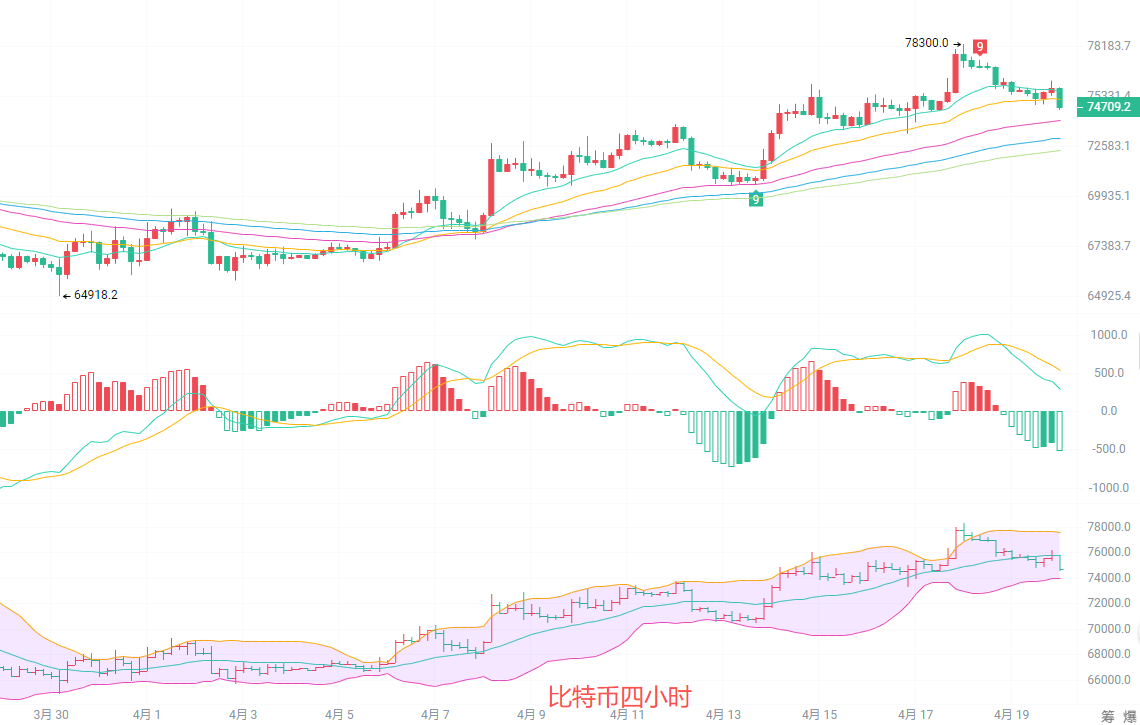
The four-hour candlestick has retreated from the high point of 78300 and is currently oscillating around 74600. The MACD has formed a death cross, with green bars continuing to release, and short-term downward forces dominating the adjustment trend. The price has fallen below the short-term rising trend line and is running toward the middle track of the Bollinger Band below 75800. The EMA15 moving average has turned downwards, indicating clear short-term pressure, with support concentrated in the range of 73500-74000. If this level is lost, the adjustment amplitude may further expand, conversely, the upward trend remains effective.
Short-term strategy reference: Follow the large cycle trend, quick entries and exits with small stop losses
For upward movement from 73500 to 74000, stop loss at 72600, target looking at 75500 to 76500, breaking above previous highs
For downward movement from 76500 to 76800 facing resistance, stop loss at 77500, target looking at 74500 to 73500 for quick entries and exits
In fact, the most tormenting thing in the cryptocurrency circle is not the ups and downs, but your greed and fear. When it rises, you want to earn more; when it falls, you fear losing more, and in the end, you get led by the market. At this stage, don’t think about a full investment to double, being able to steadily earn money from the trend is already good. Remember, set your stop losses well, control your position, even if this time you missed the opportunity, don’t rush, the market will always give you the next chance to get on board.

Friendly reminder: The above content is solely created by the author on the public account, and the advertisements at the end of the article and in the comment section are unrelated to the author. Please discern carefully, thank you for reading.
免责声明:本文章仅代表作者个人观点,不代表本平台的立场和观点。本文章仅供信息分享,不构成对任何人的任何投资建议。用户与作者之间的任何争议,与本平台无关。如网页中刊载的文章或图片涉及侵权,请提供相关的权利证明和身份证明发送邮件到support@aicoin.com,本平台相关工作人员将会进行核查。