Coin Circle Liying: 4.20 Ethereum volume contraction consolidation, gaining momentum to challenge the previous high resistance! Latest market analysis and operation suggestions
Family! The current price of Ethereum is 2317, the trend structure is upward, pay attention to the upper resistance. From the trend structure, Ethereum is currently operating in a bullish pattern. The current price is reported at 2325, which is above the middle track of the Bollinger Bands and gradually approaching the upper track of 2406, indicating that the market is currently dominated by bullish forces in the short term. At the same time, the key moving average system shows a standard bullish alignment, with the 7-day moving average at 2324 providing immediate support for the price, and the 30-day moving average at 2369 and the 120-day moving average at 2299 rising sequentially, outlining a clear medium-term upward trend channel. Especially, the 120-day moving average serves as an important boundary between bullish and bearish trends; its solid upward position below the price provides a strong base support for the overall trend. In summary, Liying sees that the price operating above the cluster of moving averages and between the middle and upper tracks of the Bollinger Bands establishes the main tone of the current market's oscillation upward, but the upper track of the Bollinger Bands will also become an intuitive pressure test point for short-term upward space.
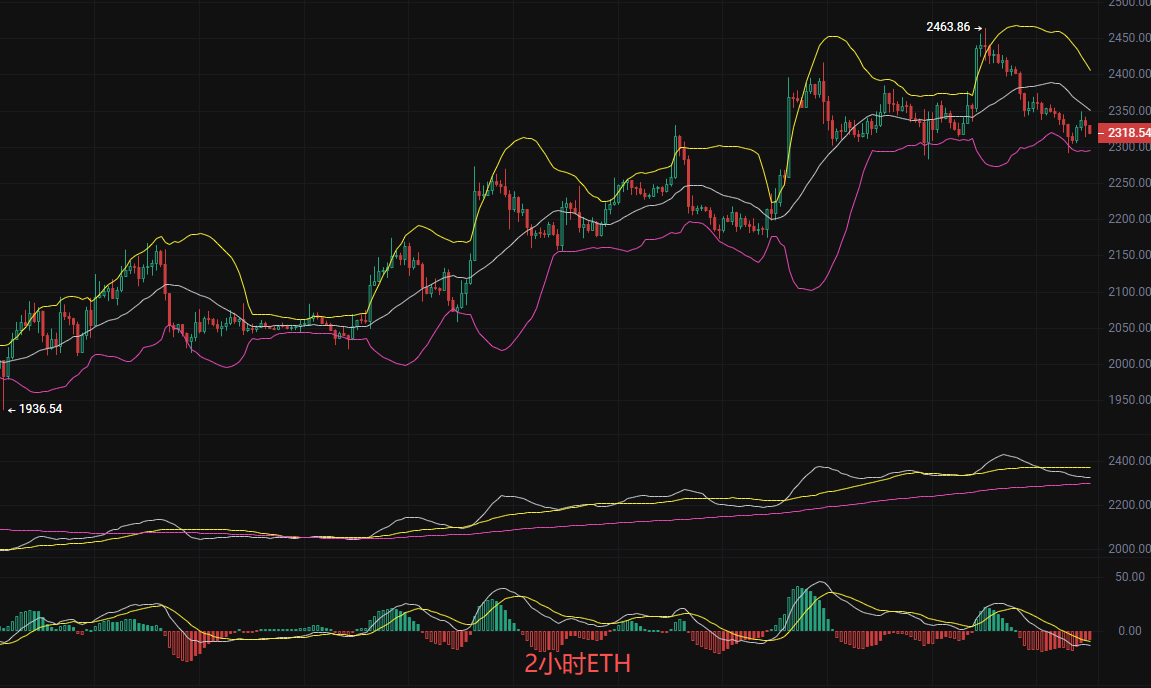
However, momentum indicators reveal a potential need for consolidation in the short term. The MACD indicator shows subtle signals with the DIF below the DEA, and the green histogram continues to appear, which is often viewed as a technical sign of a slowdown or reversal in short-term momentum. This signal resonates with the pressure point of the price approaching the upper track of the Bollinger Bands, suggesting that after a continuous rise, some bulls may choose to take profits, leading to a technical pullback in prices. However, such pullbacks are often considered healthy digestion within a robust upward trend. Given the strength of the long-term moving average system and the price being far from strong support below, the short-term divergence in MACD more suggests a rhythm adjustment during the upward process rather than a reversal of the trend. Future attention should be on whether the moving average system below can provide effective support during price pullbacks.
Short-term practical strategy (Liying personally teaches, accurately targeting the chart)
Bullish strategy: Breakout on volume above 2355-2360 to go long, stop loss at 2320, target 2420 aiming for 2450
Bearish strategy: Break below 2296 to short at 2290-2285, stop loss at 2330, target 2220 aiming for 2180
The market will always reward those who respect the trend and strictly follow the rules!
Note: The above analysis is purely based on Liying's technical logic and does not constitute investment advice. The market has risks, and investment should be cautious.

Warm reminder: The above content and only Weibo is created by the author; the advertisements at the end of the article and in the comment section are unrelated to the author, please discern carefully, thank you for reading
免责声明:本文章仅代表作者个人观点,不代表本平台的立场和观点。本文章仅供信息分享,不构成对任何人的任何投资建议。用户与作者之间的任何争议,与本平台无关。如网页中刊载的文章或图片涉及侵权,请提供相关的权利证明和身份证明发送邮件到support@aicoin.com,本平台相关工作人员将会进行核查。