Cryptocurrency Scholar: On April 19, is Bitcoin's next move a pullback or a rebound? These two key levels determine the short-term direction! Latest market analysis and trading suggestions
Current price of Bitcoin is 75500, after dropping from 78300 to 75600, has the market been doused with cold water again? Many people who just chased the high are now trapped, and those who short are afraid of it rising again, feeling stuck? Don’t panic, today we won't shout slogans or hype a bull market, but will analyze the current volatile market using technical analysis, clearly explaining where to go up and where to go down, so that even beginners can understand and apply it.
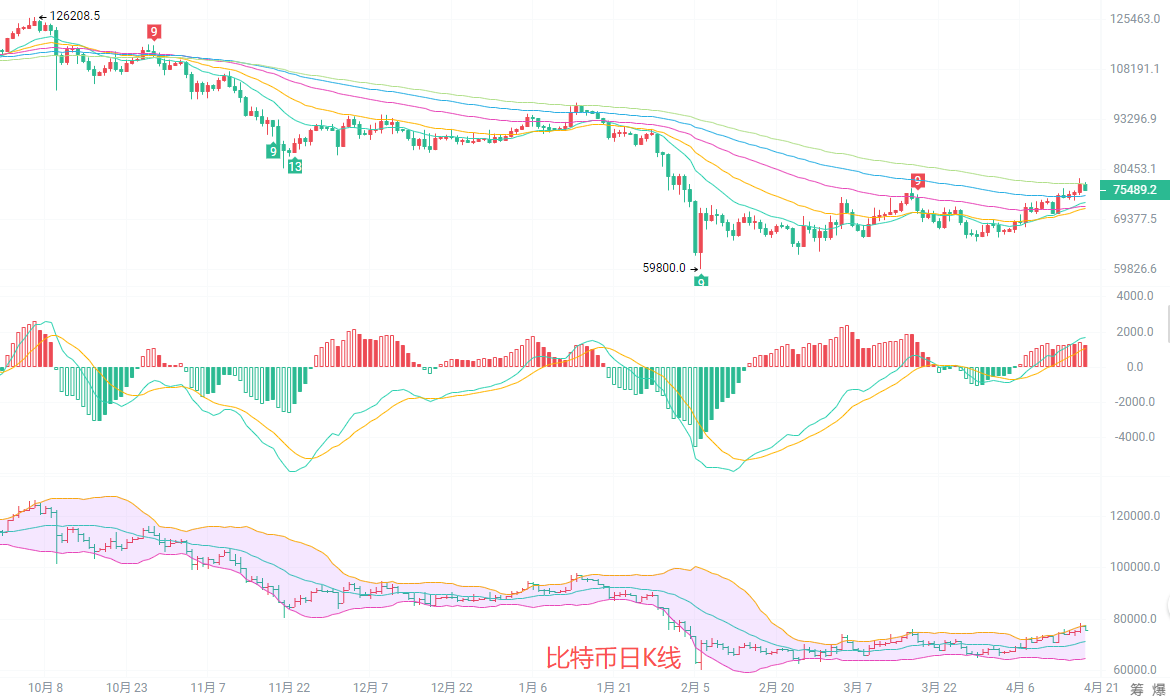
The daily candlestick closed with a long upper shadow and a bearish candle, falling from the upper Bollinger Band. Although the Bollinger Bands have not tightened, the pace of rise has obviously slowed down. The MACD red bars continue to shorten, and the difference between DIF and DEA is narrowing, with upward momentum gradually diminishing. The moving average system is still arranged for upward movement, with a strong support forming at the EMA60 moving average line of 72134. As long as this position is not broken, the upward trend will not be damaged.
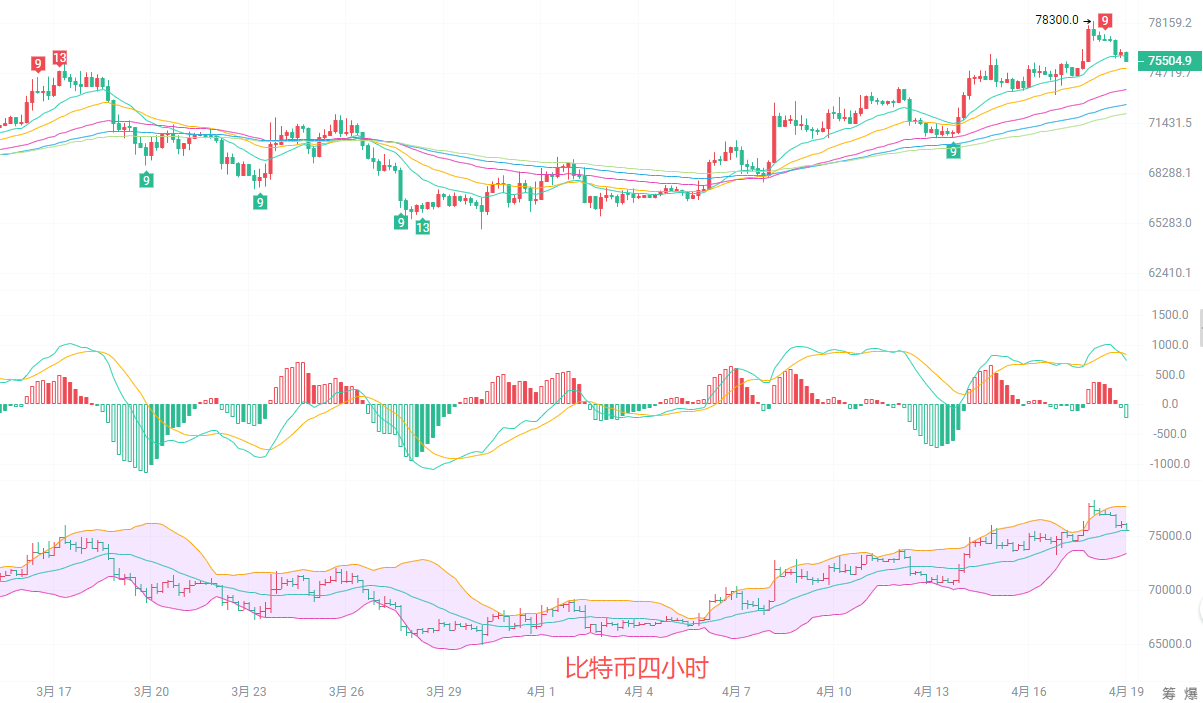
In the four-hour chart, it encountered resistance at 78300 and formed a double top pattern, currently breaking below the EMA15 moving average and oscillating near the EMA30 moving average, with clear resistance from the upper Bollinger Band. The MACD indicator’s red bars continue to shorten, and a death cross signal is about to appear, with downward pressure becoming dominant in the short term, and the support around the middle Bollinger Band at 75579 is facing a test. The current trend belongs to a correction following an upward move, and before a clear reversal signal appears, it is advisable to operate with a consolidation mindset. High position oscillation is most likely to upset one’s mindset, resulting in buying high and selling low repeatedly. In fact, the current market is quite simple; don’t chase trades randomly, only trade at key levels, set proper stop losses, run if wrong, hold if right. The market never lacks opportunities; don’t get thrown off rhythm due to one mistake; maintaining a stable mindset is more important than anything else.
Short-term strategy reference: Follow the trend of the larger cycle, small stop loss, fast entries and exits
Upward from 74200 to 74800, stop loss at 73500, target at 76500 to 77000
Downward from 76800 to 77300, stop loss at 77850, target at 75200 to 74500
In the cryptocurrency world, those who see first eat meat, those who understand later drink soup, and those who are unaware take over.
Specific operations should be based on real-time data, for more information details can consult the author, there may be delays in article publication, suggestions are for reference only, risks are self-borne.

Kind Reminder: The above content is solely created by the author of the public account. The advertisements at the end of the article and in the comment section are unrelated to the author. Please discern carefully; thank you for reading.
免责声明:本文章仅代表作者个人观点,不代表本平台的立场和观点。本文章仅供信息分享,不构成对任何人的任何投资建议。用户与作者之间的任何争议,与本平台无关。如网页中刊载的文章或图片涉及侵权,请提供相关的权利证明和身份证明发送邮件到support@aicoin.com,本平台相关工作人员将会进行核查。