Abstract
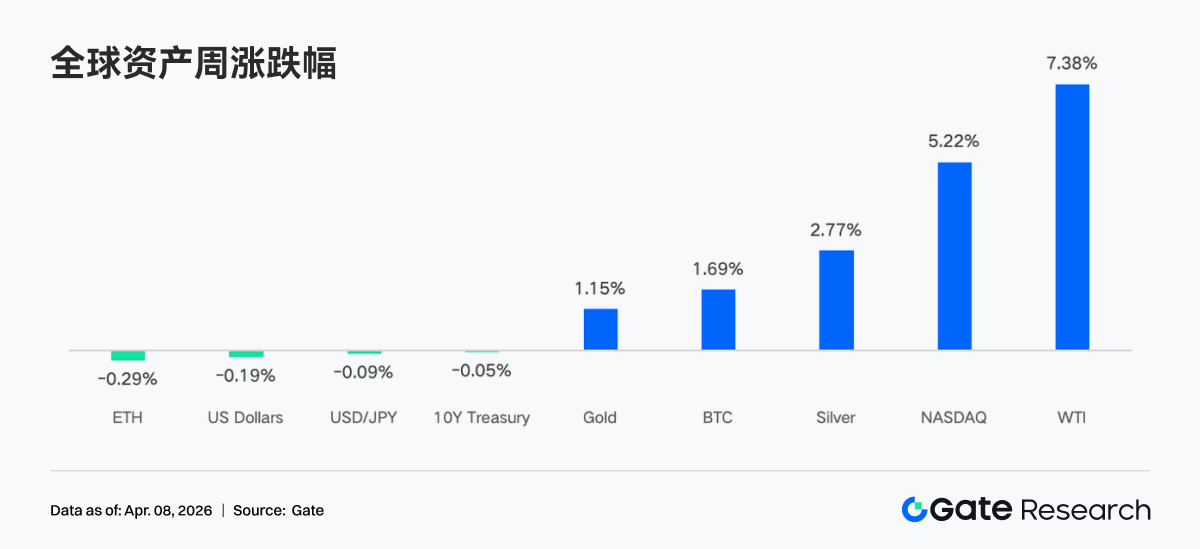
• In the past week, the market was primarily driven by repeated expectations of geopolitical conflict and better-than-expected economic data. The U.S. and Iran switched between statements regarding ceasefire and military strikes, leading to significant fluctuations in oil prices, with WTI rising over 7% weekly; at the same time, retail sales, ISM, and non-farm data all exceeded expectations, reinforcing economic resilience and prompting a sharp rebound in U.S. stocks. Under the resonance of inflation and risk aversion, gold and silver continued to reach new highs.
• From a funding perspective, there were minor fluctuations and structural disturbances. BTC ETFs saw a slight net inflow of approximately $22.3 million, a noticeable improvement from the previous week, though the scale remained limited; ETH ETFs continued to experience net outflows. At the end of the quarter, rebalancing combined with holiday factors led to a V-shaped fluctuation where funds quickly flowed in and then out after showing inflows from late March to early April, reflecting that institutional allocation rhythms were still dominated by macro and structural factors.
• On-chain and trading structures concentrated around high-volatility assets. Trading volume in spot DEX and CEX showed a significant tilt towards crude oil and precious metals, with the proportion of energy commodities rising significantly while precious metals remained at high levels; DEX structure underwent a reshuffle, with Meteora's trading volume surging to the top position, resulting in liquidity concentrating in a few high-efficiency protocols, and a divergence appeared within the Solana ecosystem.
• The structure of stablecoins and DeFi continued to adjust. The total amount of stablecoins remained in a high-level oscillation, USDT remained basically flat, while USDC saw a slight decline; more funds flowed into DeFi-native stablecoins. In liquid staking, Lido and Rocket Pool on the ETH side saw rebounds, while Solana LST continued to adjust. Aave's lending volume overall recovered, with the main market and sub-chains synchronously improving.
• The revenue structure of protocols returned to normal. The issuance of stablecoins remained the main source of income; revenues from trading platforms decreased compared to the previous week, whereas wallets and frontend access points, such as Pump, Phantom, and Jupiter, saw rising revenues, indicating that funds returned to distribution stages.
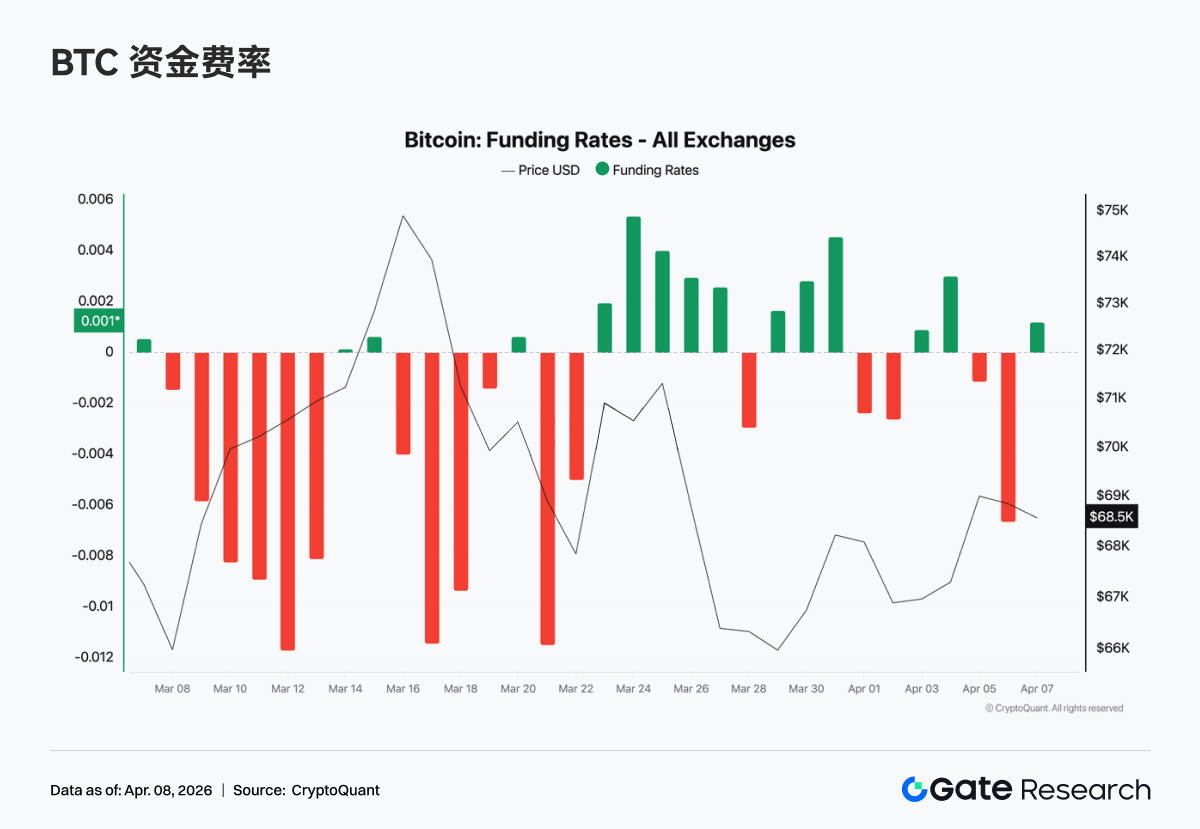
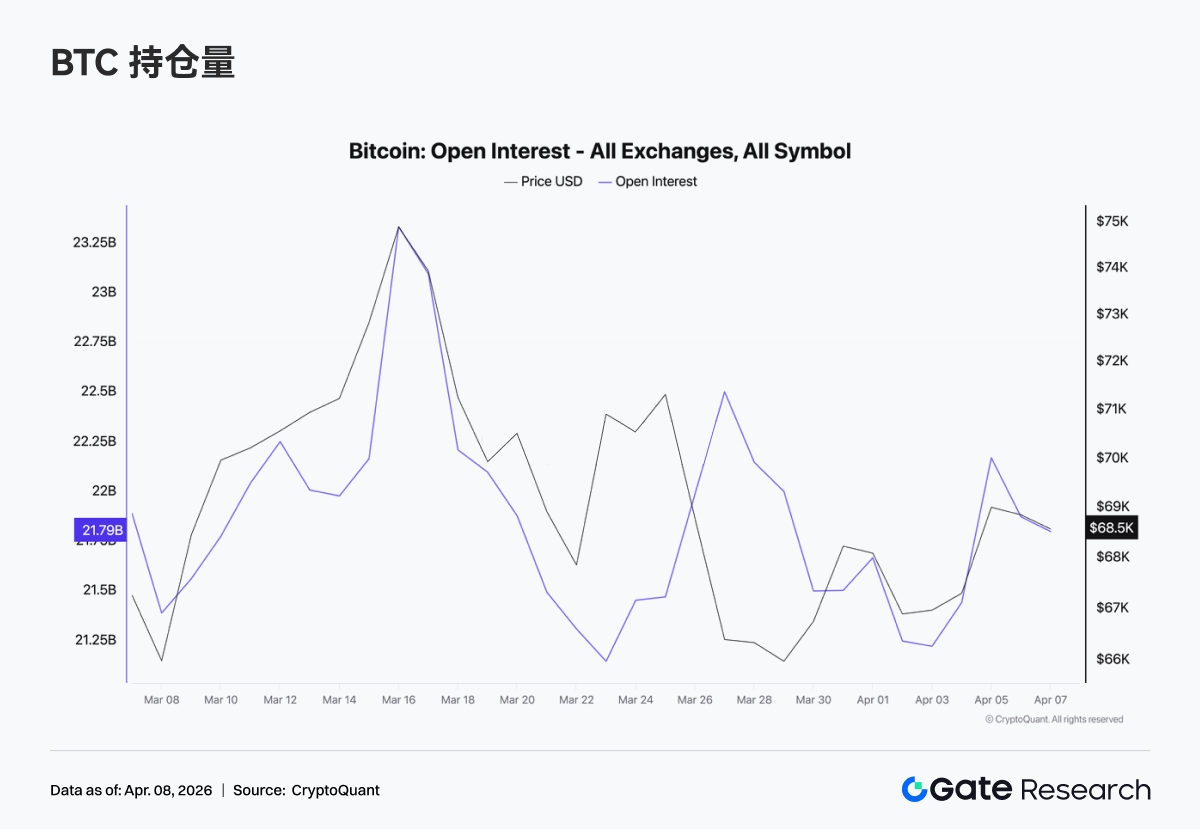
• The derivatives market entered a neutral range. The BTC funding rate rose to around 0, and open interest fell back to approximately $21 billion after spiking; option positions concentrated on the short end, demand for puts increased, skew maintained a negative range, and DVOL remained high and volatile, indicating that the market was primarily pricing in short-term uncertainties.
1. Market Focus Interpretation
On Monday, reports indicated that the U.S. and Iran were discussing a potential 45-day ceasefire agreement and terms for reopening the Strait of Hormuz, which boosted market sentiment significantly. Dow Jones futures surged by 1,100 points overnight, and Brent crude oil prices briefly fell below $100 for the first time since early March. However, on Wednesday evening, Trump's speech stating that the U.S. would continue military strikes on Iran for "two to three weeks" abruptly reversed market optimism. Oil prices soared above $113, with WTI crude oil rising over 7% weekly.
Recent economic data show that the economy continues to demonstrate resilience. Retail sales and ISM manufacturing index released last week both exceeded expectations, indicating that consumer spending remains healthy and manufacturing is still expanding. The non-farm employment numbers announced on Friday showed growth and improvement in the unemployment rate, with the monthly non-farm employment number reaching its highest level since December 2024, alleviating market fears of an economic recession and driving the Nasdaq index to surge with its best weekly performance since November 2025. Amid rising inflation expectations and risk aversion, gold and silver continued to set new highs, while cautious statements from Fed officials kept the dollar index fluctuating in a narrow range at high levels. The U.S. treasury market saw a tug-of-war between strong employment data and inflation worries, leading to slight fluctuations in 10-year Treasury futures prices.
Cryptocurrencies participated in risk appetite trading, with Bitcoin approaching the $70,000 resistance level that has been in place for weeks and Ethereum breaking through the $2,100 mark. After four consecutive months of outflows, Bitcoin spot ETFs recorded a net inflow of $1.32 billion in March.
2. Liquidity Analysis
2.1 Net Flows of Crypto ETFs
Last week, BTC ETFs showed a "V-shaped bump" intraday, with a net inflow of $117.6 million on March 31, the strongest single day at the end of the month, and then abruptly reversed to -$173.7 million on the first trading day of April. The weekly net inflow for BTC ETFs was about $22.3 million, while ETH ETFs saw a weekly net outflow of $42.2 million. Comparatively, last week's BTC ETF flows showed significant improvement from the previous week (-$296 million net outflow), but the absolute amount remained the smallest positive week in recent months, with an overall cautious sentiment rather than optimism.
Top net inflow products for BTC ETFs:
1. ARKB (ARK 21Shares) weekly net inflow of $34.2 million
2. IBIT (BlackRock) weekly net inflow of $16.4 million
Top net inflow products for ETH ETFs:
1. ETHB (BlackRock Staked ETH ETF) weekly net inflow of $10.7 million
2. ETH mini with a weekly net inflow of $6.5 million
The largest net outflow came from ETHA (BlackRock) at -$64.0 million, followed by FETH (Fidelity) at -$7.3 million.
March 31 marked the end of Q1, where institutional passive rebalancing concentrated at quarter-end. If Bitcoin outperformed stocks and bonds in Q1, allocation models would automatically reduce over-allocated positions, explaining why substantial outflows followed two days of inflows at the end of the month—this was mechanical and anticipated, not a bearish signal. On April 3, approaching the long weekend for Good Friday, the CME futures and ETF subscription and redemption mechanism simultaneously paused, causing the disappearance of institutional buy anchors. Additionally, economic data dampened interest rate cut expectations, further suppressing risk assets, with ETF flows exhibiting characteristics of "signals of slow down already showing in early April."
The next key point will be the April 9 CPI data, which will directly impact the market's repricing of the interest rate cut timetable, at which point the directional flow of ETFs is expected to become clearer.
2.2 TradFi Liquidity
In the past week, TradFi segment trading volumes in Perp DEX showed noticeable structural redistribution. The energy category (represented by CL and Brent Oil) significantly increased its share, becoming the dominant factor driven mainly by rising crude prices and geopolitical risk disturbances, with short-term fluctuations amplifying and attracting trading funds. Meanwhile, precious metals (XAU, XAG) maintained a relative high share but slightly receded, indicating that risk aversion demand persists but was marginally diverted to energy. The proportion of individual stocks (e.g., NVDA) continued to contract, reflecting a reduced trading appeal for single equity assets under macro-dominated phases.
In the CEX side, TradFi trading volumes showed a pronounced increase at high levels but were highly concentrated in commodity categories, with precious metals (XAU, XAG) remaining the absolute core source of transactions, maintaining a dominant position long-term, contributing over 70% of TradFi trading volume on certain platforms, hence becoming a liquidity anchor. Additionally, energy categories (crude oil CL, Brent) significantly enlarged and elevated their proportion during the week. Driven by rapid oil price increases and amplified volatility, daily trading volumes for crude perpetual contracts reached hundreds of millions, swiftly becoming core trading targets, reflecting a preference for "high volatility + macro β."
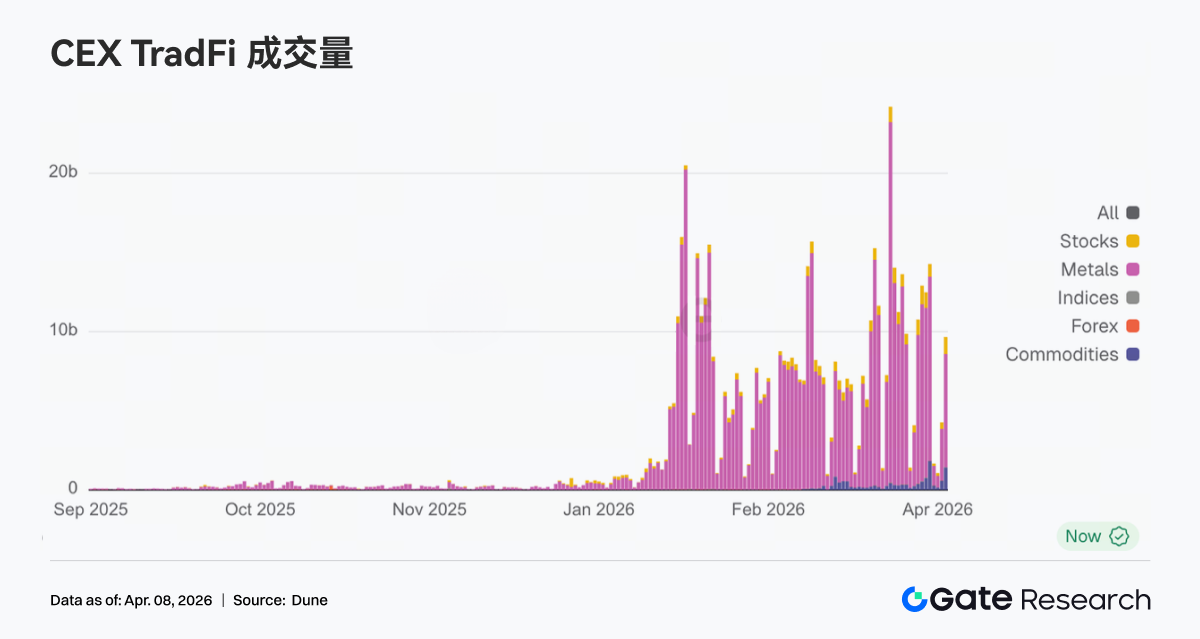
In the past week, the number of TradFi asset categories further expanded, with three mainstream CEXs increasing the total number of TradFi asset categories (counting TradFi and CFD segments only, excluding perpetual contracts) from 678 to 802, a week-on-week growth of 18.3%. Among them, the stock category saw the most significant growth, increasing from 379 to 487, a week-on-week growth of 28.5%; stock indices ranked second in growth rate, increasing from 69 to 81, a week-on-week growth of 17.4%.
We selected XAUT, which had the highest TradFi trading volume, and analyzed its order book depth (Delta). Last week it showed a typical "price up → continued net selling pressure → phase repair" structure, reflecting that funds focused on profit-taking at high levels.
• Uptrend phase: Depth turned negative with continued selling pressure. From March 31 to April 2, the XAUT price quickly rose (corresponding to a strengthening gold), but the order depth clearly turned negative, showing multiple large negative Deltas. This indicated that during the uptrend, proactive sell orders (profit-taking/hedging) continuously pressed down, and the market was not driven by chasing gains but went through a distribution phase of "price rising, chips exiting." This aligns with gold's characteristic as a safe-haven asset—rises are often accompanied by profit-taking needs.
• High level and fluctuation phase: Negative Delta peaked, with liquidity passively absorbed. An extreme negative Delta (approaching -2M) occurred around April 1, corresponding to a price peak, indicating that large funds were consolidating profits or hedging shorting, with buyers being predominantly passive absorbers (liquidity providers). Subsequently, Delta gradually turned positive with multiple positive impulses, indicating some funds started to absorb dips, but bullish confidence had not fully restored.
3. On-Chain Data Insights
3.1 Solana Trading Volume Concentrating in Meteora, DEX Rankings Significantly Restructured
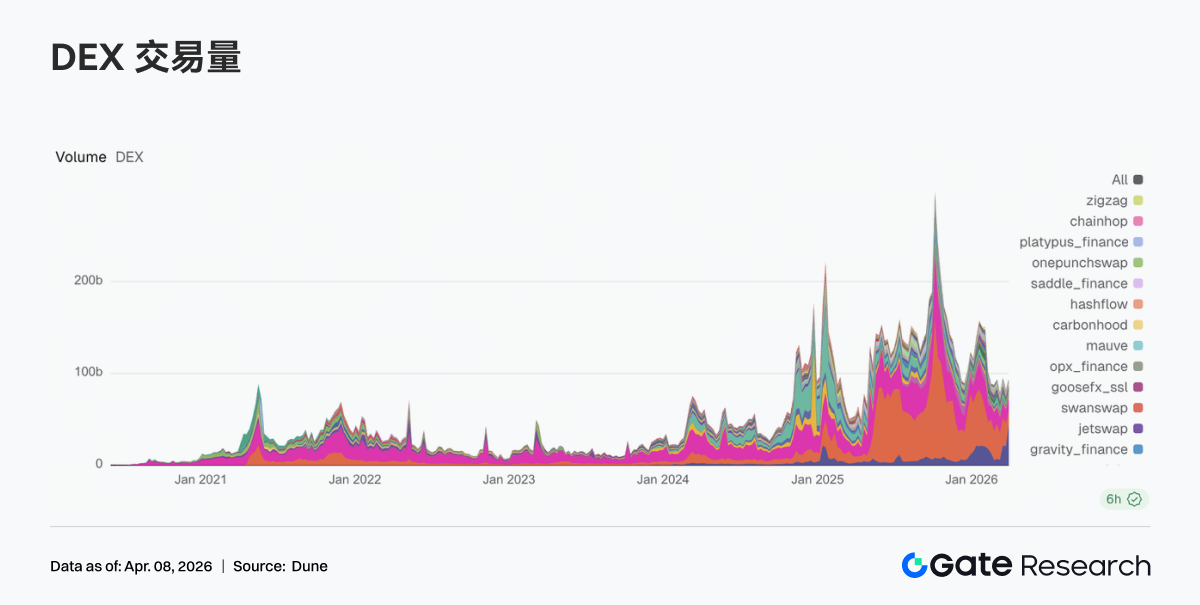
Last week, there was a notable reshuffle in DEX structure. Meteora’s trading volume surged to $43.215 billion, significantly amplifying from $20.631 billion the previous week and taking first place. From a mechanism perspective, Meteora's DLMM model benefited more from a high-volatility environment and active market-making demand. PancakeSwap dropped from $25.185 billion to $15.640 billion, and Uniswap slightly decreased to $13.100 billion, with mainstream spot platforms overall failing to follow this round of Solana's traffic expansion. Divergence also appeared within the Solana ecosystem. Raydium fell from $2.390 billion to $1.384 billion, while Whirlpool rose to $1.968 billion, and Pumpswap increased from $0.343 billion to $0.471 billion. Overall, last week the market pricing leaned significantly towards trading elasticity and liquidity capture capabilities, with liquidity concentrating in a few high-efficiency entry points.
3.2 Total Stablecoins Remain High, Incremental Flows Concentrate in Core DeFi Assets
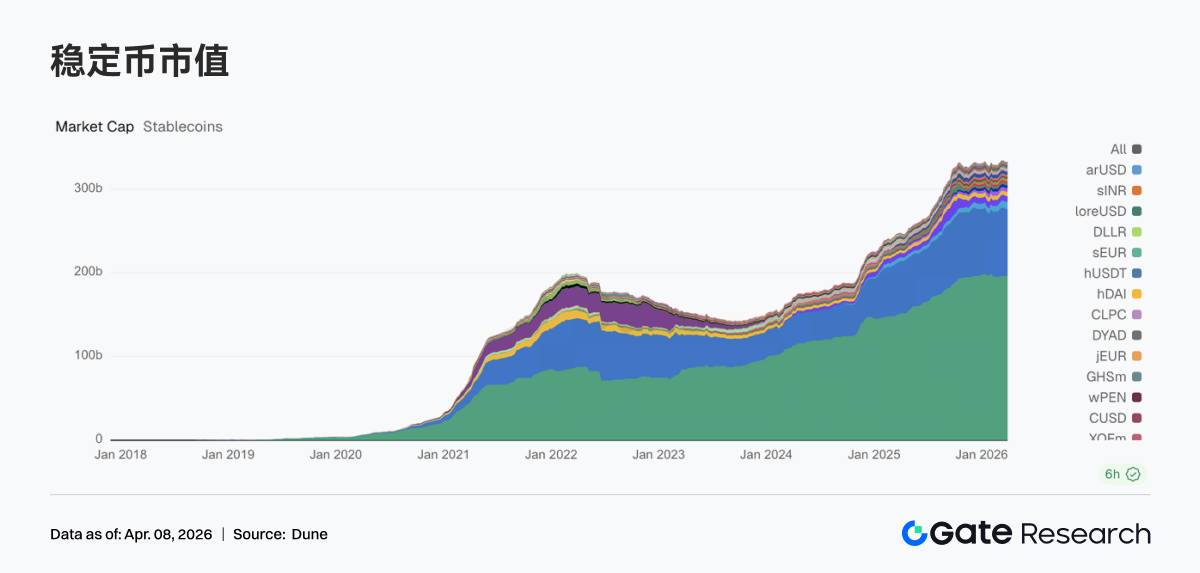
Last week, the overall stablecoin amount maintained a high-level oscillation. USDT remained basically flat; USDC saw a slight decline, continuing the trend of slowed growth post-mid-March. Funds tilted toward DeFi-native stablecoins. USDS increased from $8.405 billion to $8.695 billion, DAI rose from $5.213 billion to $5.461 billion, emerging as the main incremental absorbers last week. PYUSD slightly rebounded to $3.170 billion, whereas USDT0 dropped to $2.485 billion, reflecting a capital diversion between payment channels and cross-chain mapped assets. Overall, last week, on-chain funds were more inclined to allocate stablecoin assets that could directly participate in DeFi.
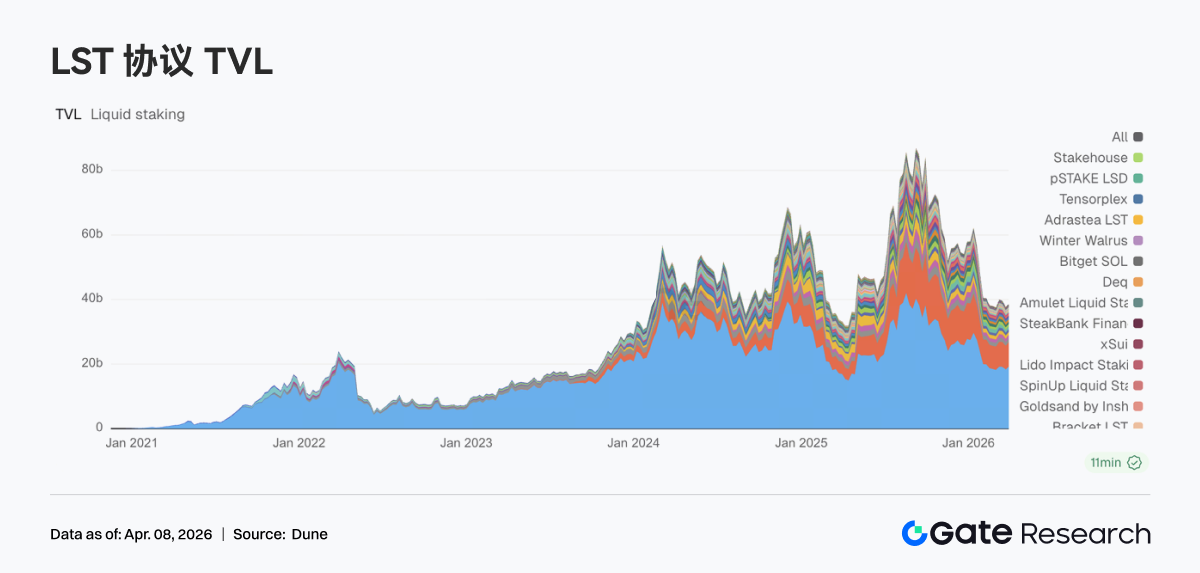
3.3 Liquid Staking Returns to ETH Mainline, SOL Ecosystem Remains in Internal Adjustment Phase
Last week, the liquid staking sector showed divergence. The ETH side overall recovered, with Lido rising from $18.329 billion to $19.193 billion and Rocket Pool rebounding to $1.192 billion, basically recovering last week's pullback. In contrast, the Solana LST sector continued to adjust. Jito fell from $1.021 billion to $0.906 billion, and Jupiter Staked SOL and Kinetiq both saw declines. In terms of products, Lido continued to push institutional income tools (such as EarnETH, EarnUSD), with a progressively完善收益体系; while on the Solana side, the structural selection stage was still ongoing.
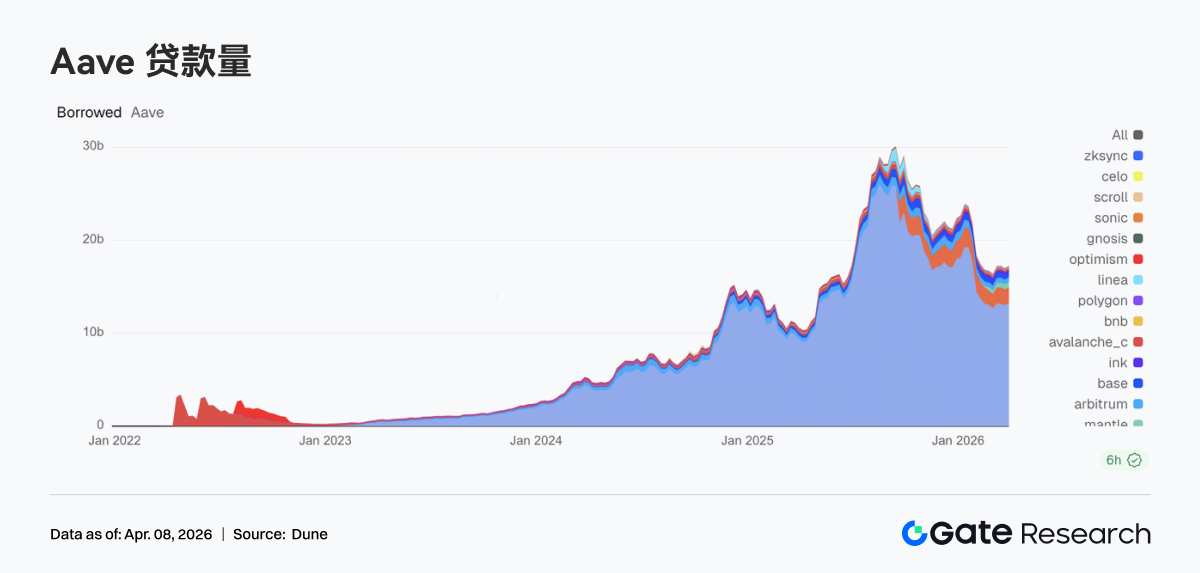
3.4 Aave Lending Volume Rebounds, Core Markets and Sub-Chains Synchronously Improve
Last week, Aave's lending volume ended its pullback and began to grow again. The Ethereum main market rose from $13.050 billion to $13.266 billion, becoming the main support for overall recovery. Sub-chain markets improved simultaneously: Mantle increased to $0.591 billion, Base rebounded to $0.496 billion, and Arbitrum slightly grew to $0.498 billion. Plasma remained at a high of $1.664 billion, with high-yield or new scenario markets remaining firmly attractive to funds. Combined with Aave's current push for the V4 Hub-and-Spoke architecture, this round of rebound resembles a rebuilding of leveraged positions, laying the groundwork for subsequent cross-market liquidity integration.
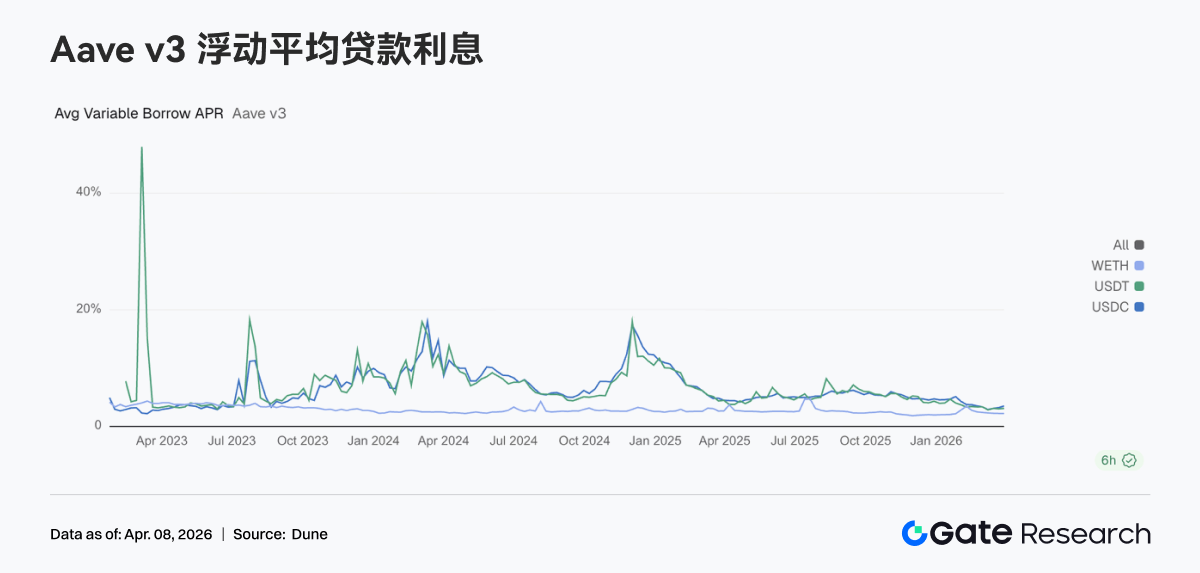
3.5 Interest Rate Divergence Intensifies, USDC Financing Costs Rise Significantly
Last week, the interest rates of Aave's three core assets further diverged. The USDC borrowing APR rose from 3.23% to 3.51%, showing the most significant increase; USDT slightly rose to 3.10%; while WETH remained around 2.23%. As lending volumes recovered, funds primarily flowed toward stablecoin loans, with ETH loan demand not synchronously enhanced. Market behavior has been more inclined towards capital allocation, arbitrage, and position rolling rather than directional leverage expansion. Under the expectation of the V4 architecture, the divergence in funding costs between different assets may further increase. The rise in USDC rates last week has already reflected this trend in advance.
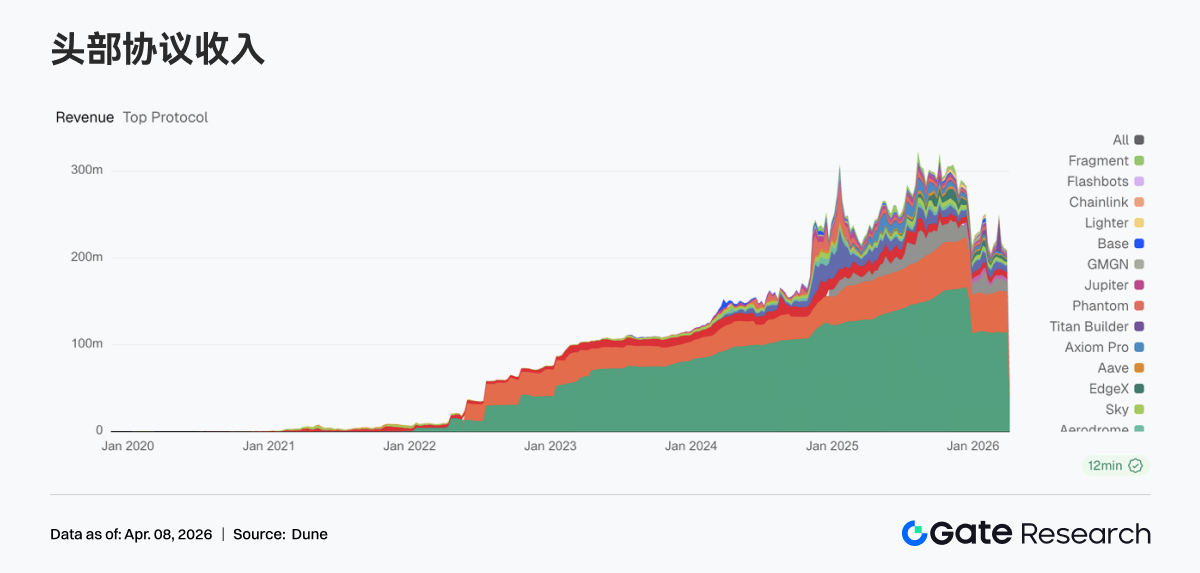
3.6 Protocol Revenue Returns to Fundamentals, Stablecoins and Traffic Entry Form Dual Support
Last week, the protocol revenue structure returned to normal. Tether’s revenue was $114.29 million, Circle’s $46.6868 million, with the stablecoin issuance end still being the most stable source of income. Revenue from trading platforms saw a decline, with Hyperliquid and EdgeX both dropping compared to the previous week, and trading elasticity phase converging. At the same time, traffic entry began to rise: revenues from Pump, Phantom, and Jupiter all saw growth, with funds flowing back to wallets and frontend distribution stages. Overall, the revenue structure reflects a pattern of stablecoins laying the groundwork, enhanced traffic entry, and differentiation among trading platforms.
4. Derivatives Tracking
4.1 BTC Funding Rates Stabilize After Turning Positive, Market Enters Neutral Game Phase
Last week, BTC funding rates continued their repair trend, gradually rising from previously sustained negative values to around 0, and briefly turning positive midweek, indicating a market transition from a short-driven defensive state to a long-short balance. At the beginning of the week, there remained slight negative rates as risk appetite was weak; as prices stabilized and rebounded, rates quickly converged, driven by shorts covering and arbitrage funds. By the weekend, funding rates basically maintained narrow fluctuations around 0, without significantly amplifying leverage, with capital behavior primarily focused on short-cycle rolling and strategic trading. Overall, last week’s changes in funding rates reflect a rebalancing after the emotion clearing, with the market entering a neutral range and not forming a clear trend signal.
4.2 BTC Open Interest Surged and Then Retracted, Leverage Momentum Weakens
Last week, BTC open interest surged and then fell back, peaking midweek at approximately $23 billion and subsequently quickly retracting to around $21 billion, with only slight recovery afterward and failing to reach new highs. In the upward phase, open interest was amplified alongside new leverage entering; however, during the high-level retraction process, open interest notably decreased, indicating that some positions were actively closed or passively liquidated. Currently, open interest has not sustained high levels, and leverage expansion has been interrupted, aligning with the funding rates returning to neutral, suggesting a near position switch within a fluctuation.
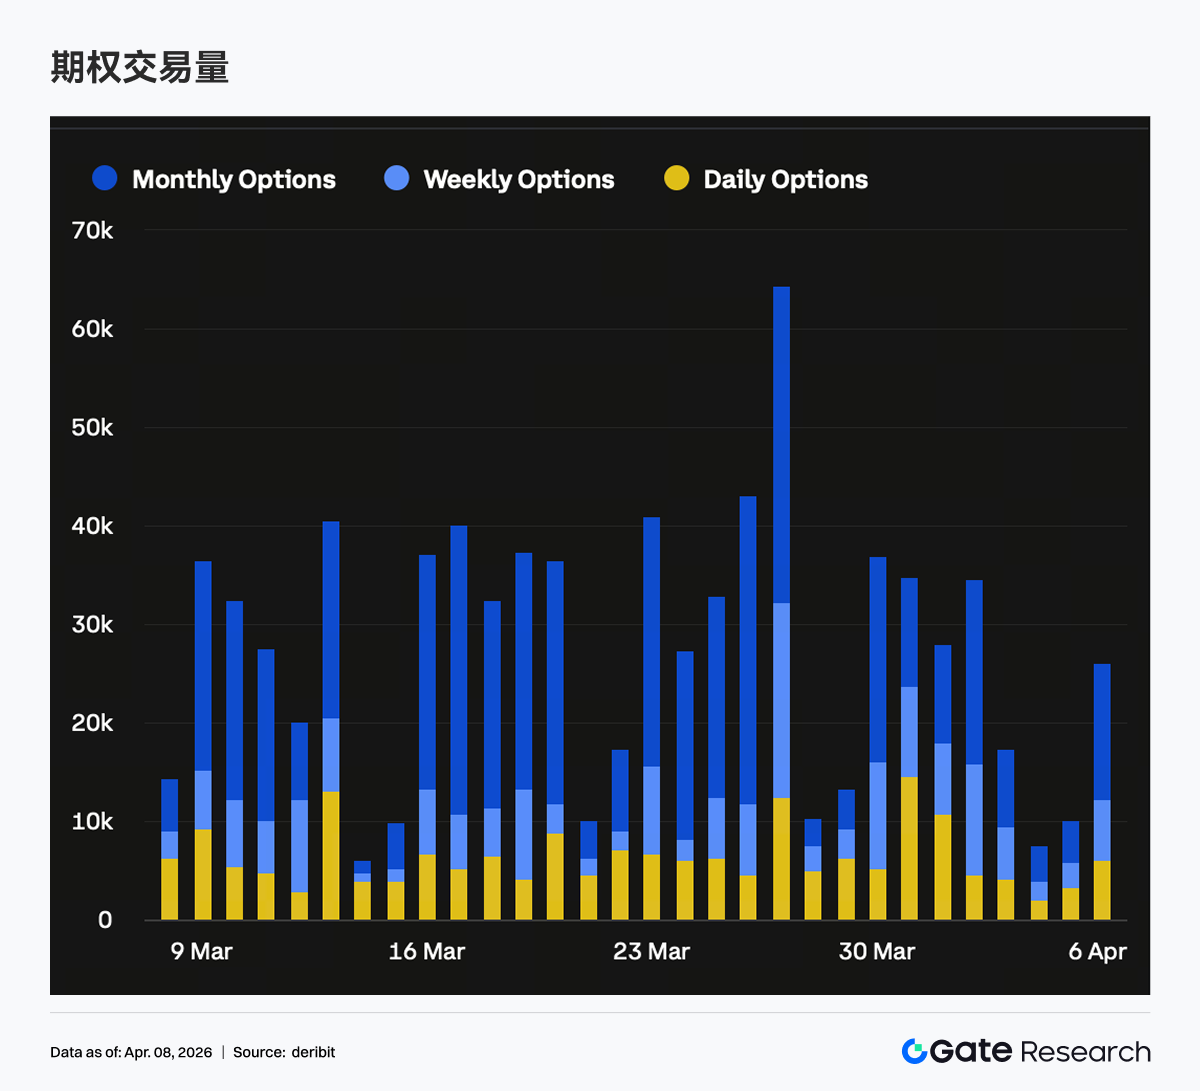
4.3 Options Open Interest Not Expanding, Positions Concentrated at Short End
Last week, options scale did not show significant growth, with limited new funds entering the market. The market was still primarily adjusting existing positions. The short-end open interest proportion rose, while mid-term and long-term (especially monthly and further out) positions decreased, consistent with the large contraction in monthly options trading, indicating that institutions were actively reducing mid-term directional exposures at this stage. In terms of directional distribution, put open interest proportion significantly increased at the short end, with skew continuing to remain in negative ranges, indicating that protective demand primarily focused on near-expirations. This structure typically corresponds to a combination of short-term defense and medium-to-long-term observation.
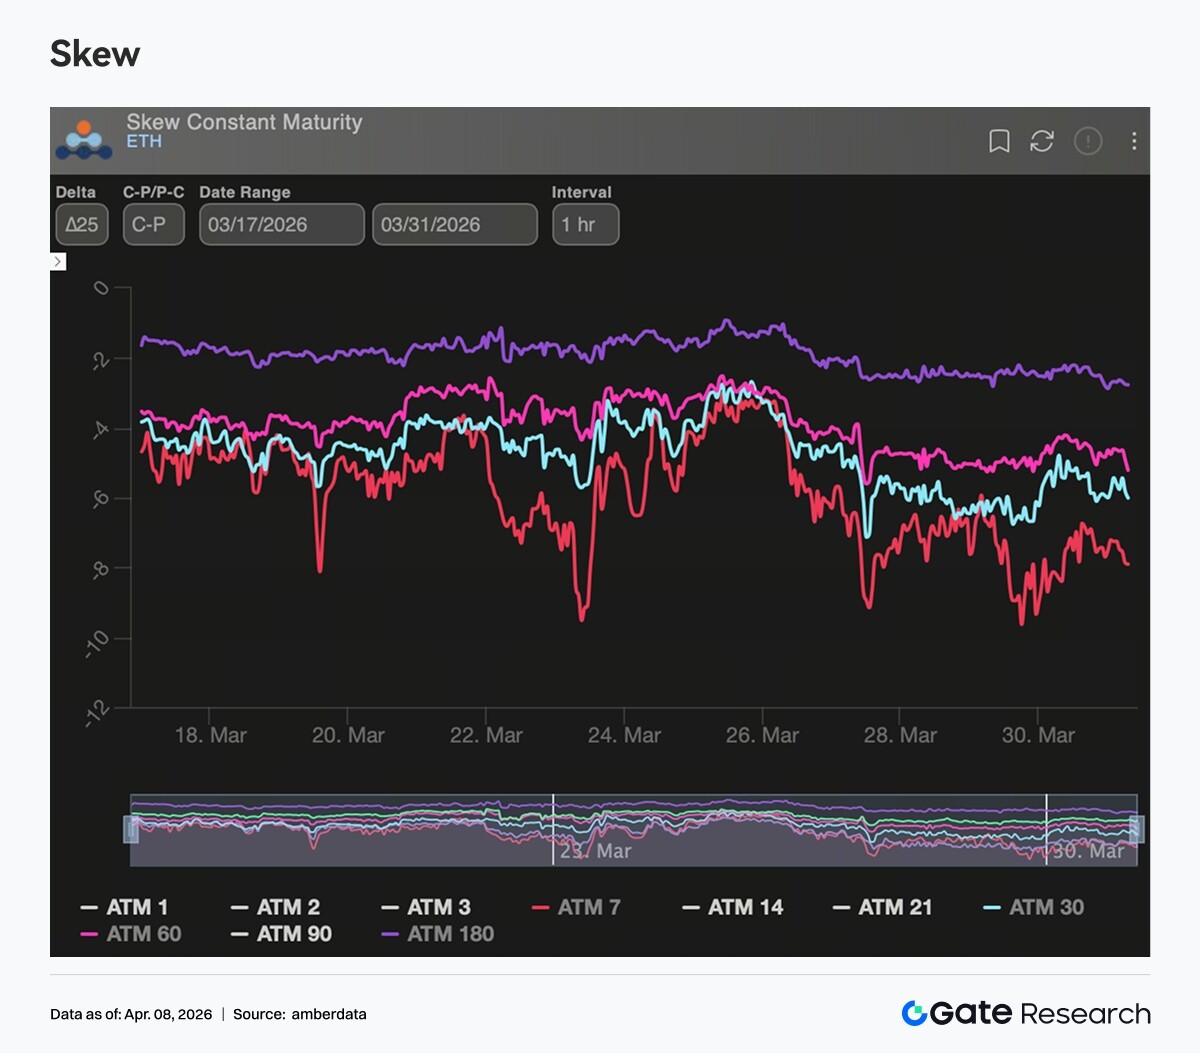
4.4 Short-End Skew Weakens Again, Protective Demand Resurfaces
Last week, skew remained in negative ranges (approximately -6 to -10), with the structure showing a form of short-end probing and long-end stability. From the end of March to early April, the 7D/30D skew quickly declined to approximately -12; although there was some recovery afterward, it has not returned above neutrality, currently maintaining in the -7~-8 range, indicating a clear rise in short-term protective demand. Meanwhile, long-end skew changed little, remaining overall more stable, with the market not forming a consistent pessimistic expectation for medium-to-long-term direction. Currently, the market primarily prices in short-term uncertainties, with short-end puts continuously being purchased corresponding to risk hedges before event-driven or expiring nodes.
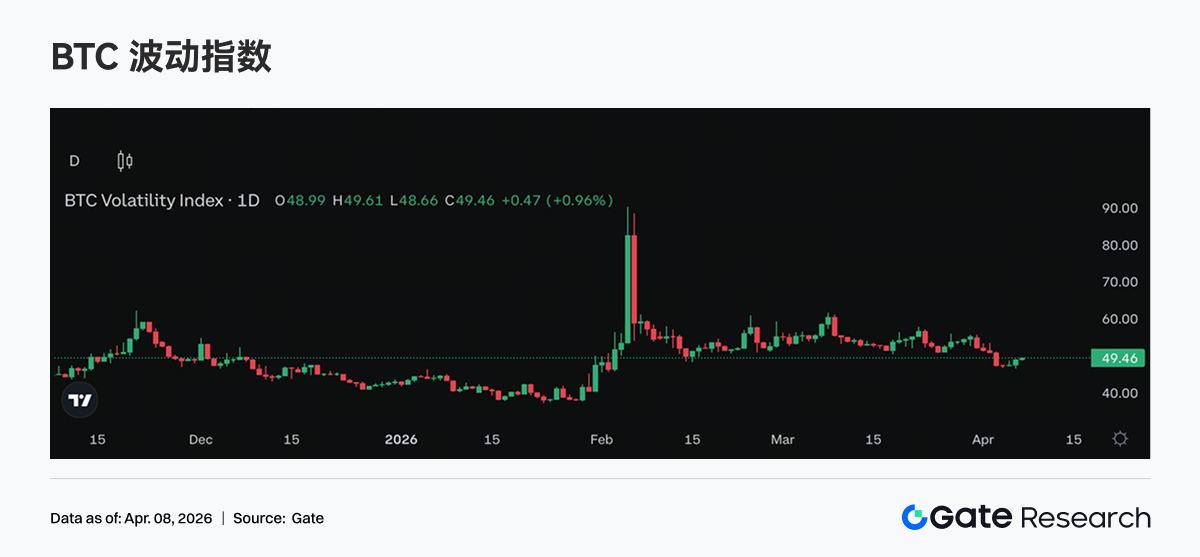
4.5 DVOL High Fluctuations, Volatility Expectations Not Further Elevated
Last week, DVOL remained fluctuating in a relatively high range without showing significant upward breakthroughs. BTC DVOL stabilized around the 40%-50% range, while ETH DVOL continued to maintain around 60%-70%, following the previous elevated plateau consolidation state. The absence of further upward movement in DVOL indicates that the market's expectation for higher volatility has not been further strengthened, meaning that short-term risk premiums remain. Combining skew and options trading structures, the current volatility pricing primarily arises from short-term protective demand. Overall, DVOL reflects a maintenance state under high volatility conditions, meaning the market has accepted that volatility exists but has not yet bet on further amplifying it.
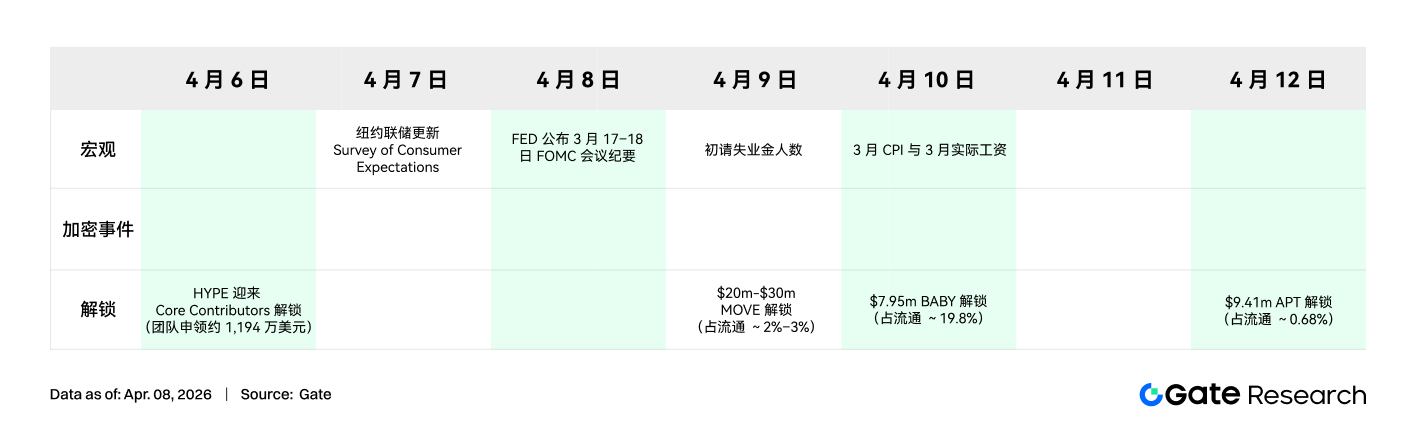
5. This Week’s Outlook
6. Gate Institutional Dynamic Update
Market Share and Institutional Proportion Double Increase
• Gate’s institutional Q1 mainstream spot trading pair market share continues to rise, becoming the only platform in the industry to achieve growth.
• The proportion of institutional trading volume in leading exchanges has increased significantly, with spot and contract proportions growing by 18% and 45% respectively.
Trading and Funding Performance Continues to Warm Up
• Trading volume significantly rebounded in the first week of April, with spot and contracts performing better than the market.
• Funding business scale has expanded, with lending volumes continuing to grow, while Gate institutional explores implementing a spread model, further stimulating capital demand.
Product Breakthroughs and Technological Upgrades
• CrossEx ecosystem is accelerating its formation, with Q2 aiming to further connect OTC loans and asset management, releasing synergy value.
• Q2 will further focus on major clients and latency issues, establishing specialized optimization mechanisms.
• Continuous optimization of low-latency performance has been maintained, and future upgrades to the 3.0 architecture will be advanced.
Data Sources
• Investing, https://investing.com/currencies/xau-usd-historical-data
• Gate, https://www.gate.com/trade/BTC_USDT
• CMC, https://coinmarketcap.com/real-world-assets/?type=all-tokens
• Coinglass, https://www.coinglass.com/pro/depth-delta
• Dune, https://dune.com/gateresearch/gate-institutional-weekly-report
• Bybit, https://www.bybit.com/future-activity/en/tradfi
• Bitget, https://www.bitgettradfi.com/tradfi/XAUUSD
• CryptoQuant, https://cryptoquant.com/asset/btc/chart/derivatives
• Amberdata, https://pro.amberdata.io/options/deribit/btc/current/
Gate Research Institute is a comprehensive research platform for blockchain and cryptocurrency, providing readers with in-depth content, including technical analysis, hot insights, market reviews, industry research, trend forecasts, and macroeconomic policy analysis.
Disclaimer
Investing in the cryptocurrency market involves high risks; users are advised to conduct independent research and fully understand the nature of the assets and products they purchase before making any investment decisions. Gate is not liable for any losses or damages resulting from such investment decisions.
免责声明:本文章仅代表作者个人观点,不代表本平台的立场和观点。本文章仅供信息分享,不构成对任何人的任何投资建议。用户与作者之间的任何争议,与本平台无关。如网页中刊载的文章或图片涉及侵权,请提供相关的权利证明和身份证明发送邮件到support@aicoin.com,本平台相关工作人员将会进行核查。


