Hello everyone, I am Sister Qinglan, welcome to the crypto classroom! Today we will use the TPV three-point verification system to analyze the market in detail, all practical insights!
Step 1: Look at the big picture
Let's go from large to small:
Daily chart: The trend is bullish! The moving averages are MA5 at 74640.93, MA10 at 73280.94, and MA30 at 70153.90, all displaying a clear bullish alignment. The current price is at 74690.85, just hovering near the MA5 moving average, slightly testing the support. Key resistance is at the recent high of 75534.76, and support is at the recent low of 73309.85. On-chain sentiment shows "extreme fear," with an index of 21, which forms a clear "bullish divergence" against the backdrop of the larger trend upward, indicating that retail investors are quite fearful, but the overall trend remains intact.
4-hour chart: The trend is also bullish! The moving averages MA5 at 74892.02, MA10 at 74771.20, and MA30 at 73506.89 show similar bullish alignment. The current price at 74690.85 has broken below the MA5 and MA10, showing some weakness in the short term. Resistance is at 75342.99, and support is at 74131.55. The 4-hour level is also shrouded in market fear sentiment.
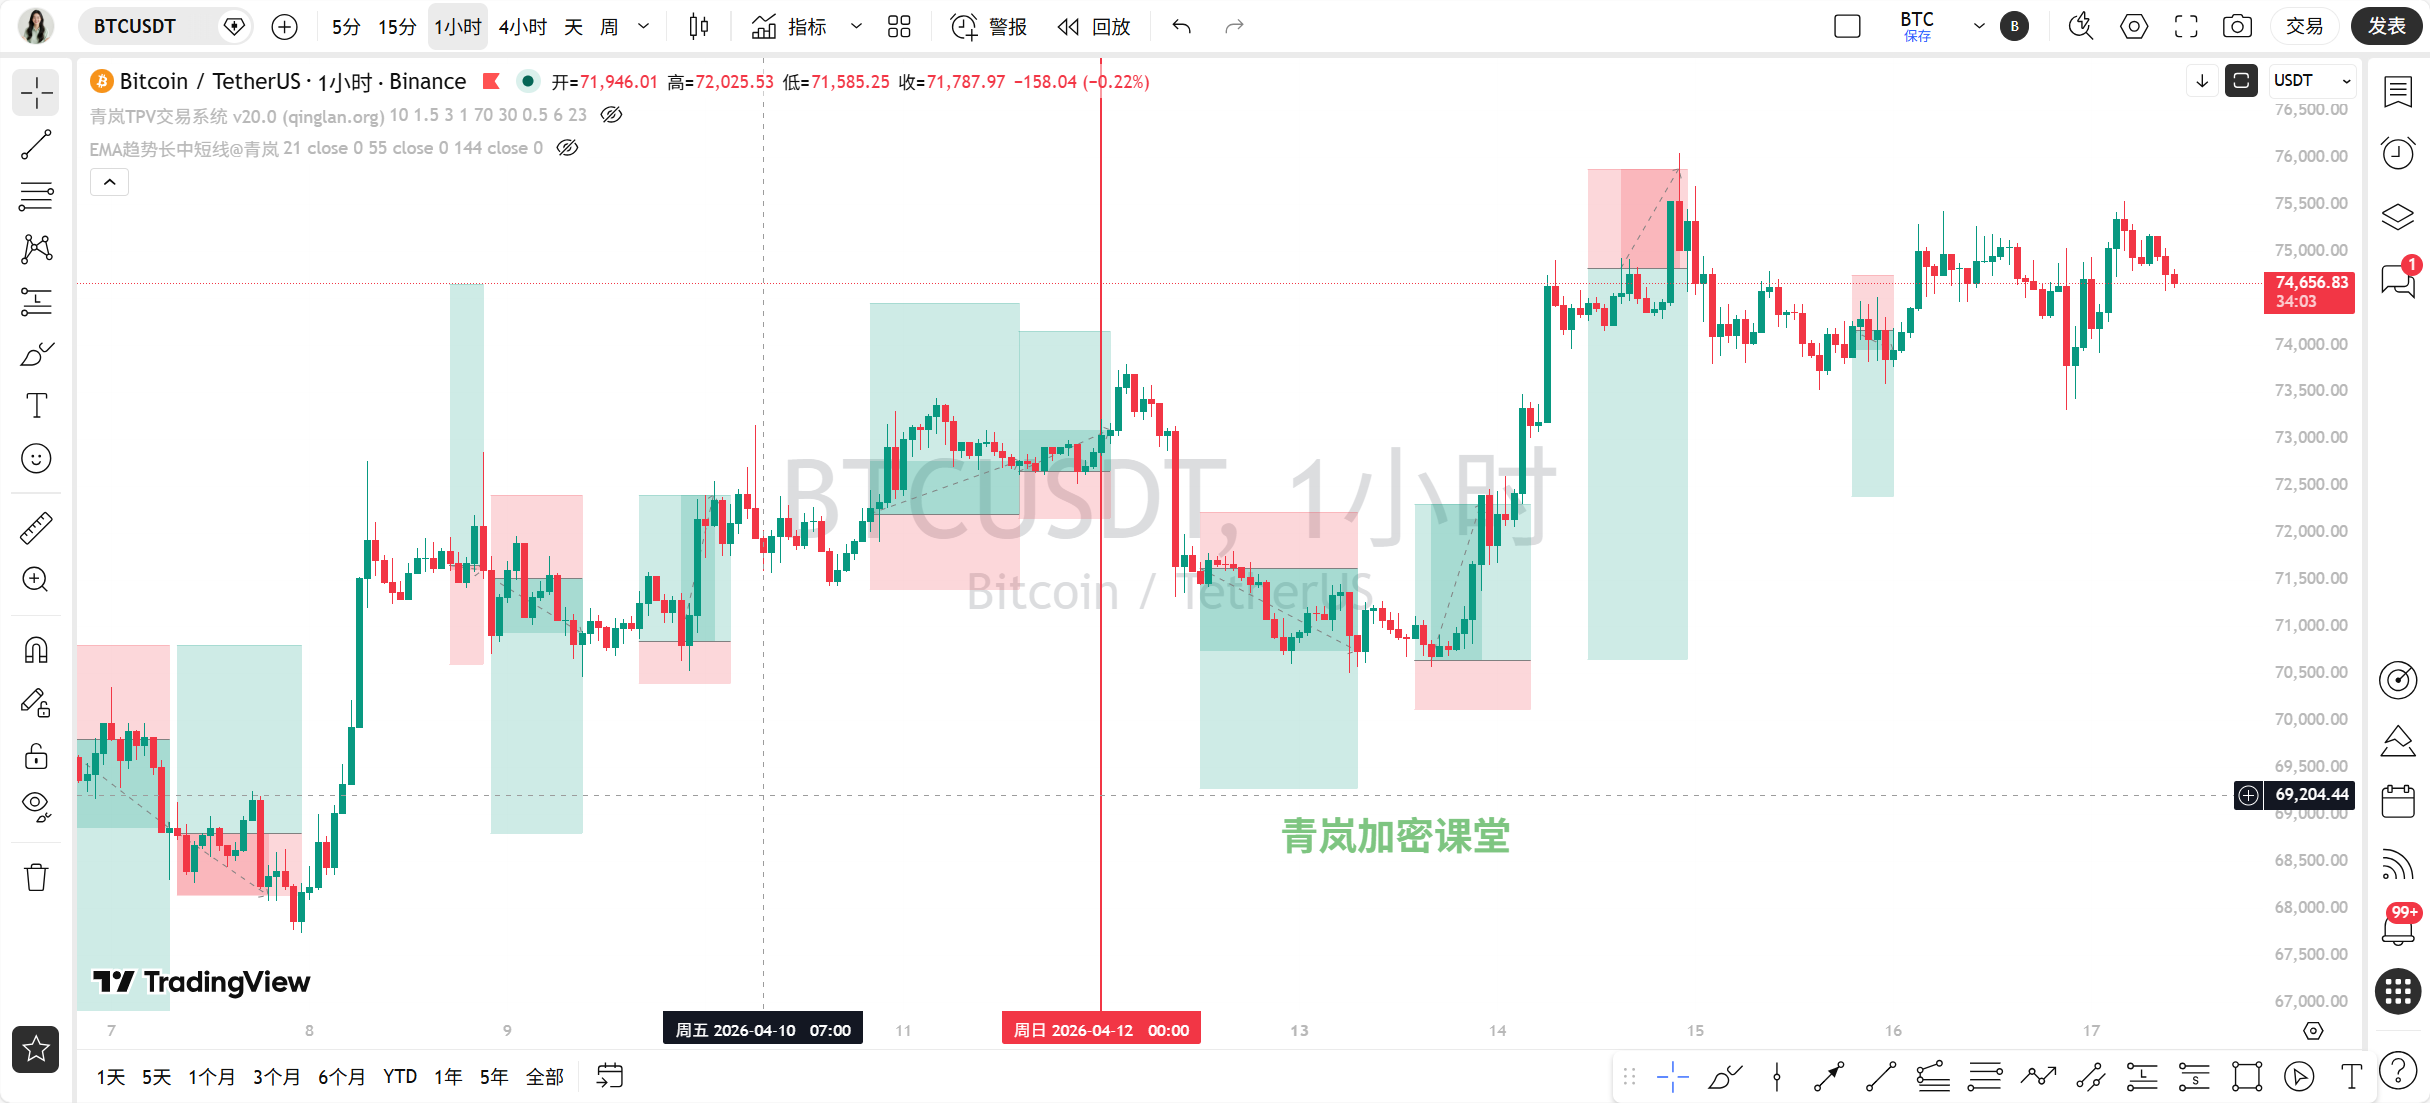
1-hour chart: The trend is sideways! The moving averages MA5 at 74881.61, MA10 at 74927.87, and MA30 at 74740.05 are intertwined, displaying typical moving average congestion. The price is below the moving averages, leaning bearish. Resistance is at 75043.48 and support is at 73844.08. This indecision at the hourly level reflects the market's hesitation.
15-minute chart: The trend is bearish! The moving averages MA5 at 74760.65, MA10 at 74881.74, and MA30 at 74998.20 show a clear bearish layout. The price is below the moving averages, indicating weakness. Resistance is at 74887.24, and support is at 73514.0. The smaller timeframe is completely under the control of bears.
On the news side, regarding "miners dumping 32,000 BTC," and "listed mining companies sold 32,000 bitcoins in Q1", these messages may have intensified short-term selling pressure, aligning with the weakness seen in the 15-minute and 1-hour charts.
Step 2: Identify pivot points and draw key lines
Effective highs (resistance) and effective lows (support):
Daily chart: Effective high at 75534.76 (confirmed), effective low at 73309.85 (confirmed). A rising trend line can be drawn connecting the lows, with the current price near the trend line.
4-hour chart: Effective high at 75342.99 (latest high), effective low at 74131.55 (tested multiple times). Draw a rising support line from the low.
1-hour chart: Effective high at 75043.48 (recent high), effective low at 73844.08 (key support). This forms a consolidation range.
15-minute chart: Effective high at 74887.24, effective low at 73514.0. Downtrend is evident.
The news mentioning "BTC breaks through the key resistance level of $75,000" corresponds closely with the key resistance areas on the 1-hour and 4-hour charts, indicating the importance of this level.
Step 3: Indicators for assistance
Daily chart: MACD's DIF is 1540.61, DEA is 1011.05, and the histogram is 529.56, showing strong bullish momentum without divergence. RSI is 74.30, approaching the overbought zone but not yet changing direction, indicating a strong daily trend but caution for retracement risks.
4-hour chart: MACD's DIF is 645.23, DEA is 689.17, and the histogram is -43.93, indicating weakening momentum but no death cross yet. RSI is 54.76, neutral and slightly strong. Indicators support bulls but momentum is insufficient.
1-hour chart: MACD's DIF is 100.23, DEA is 101.21, and the histogram is -0.98, indicating a death cross! This is a short-term bearish signal. RSI is 50.72, neutral. The indicators confirm the bearish bias on the hourly chart.
15-minute chart: MACD's DIF is -19.29, DEA is 33.36, and the histogram is -52.65, showing clear bearish momentum. RSI is 37.57, close to oversold. The smaller timeframe indicators are completely bearish.
Currently, there are contradictions in the indicators across timeframes, with daily max strong and hourly below weak, without clear cross-period divergence.
Step 4: Bull and bear showdown
News aspect:
Bullish factors: "BTC breaks through the key resistance of $75,000," "Bitcoin breaks through the $75,000 mark," "ORDI surges 190% leads, altcoin rebound remains hot" – these indicate market attempts to break through and local hotspots.
Bearish factors: "Miners dump 32,000 BTC, is the market about to turn bearish?" "Listed mining companies sold 32,000 bitcoins in Q1, setting a record for single-quarter sales," "Over $392 million wiped out in the crypto market in 24 hours, over 140,000 people liquidated," "Ethereum whale activity... may plan to sell" – these are solid selling pressure and risk events.
The core factor is "selling by miners and institutions" vs "price attempts to break through key resistance." Technically and on the news front, there is a resonance in the short term, with selling news corresponding to the weakness seen below the hourly level.On-chain data:
The fear and greed index is at 21, extreme fear! This creates a huge contrast with price fluctuating at highs, a typical "contrary market sentiment" signal that often indicates potential upward space in the mid-term, but in the short term also reflects insufficient retail investor confidence.
BTC's dominance is 56.96%, still very high, with funds still centralized in Bitcoin.
Total market capitalization is $2.627 trillion, with a 24-hour change of 0.26%, almost unchanged, indicating the market is observing.
On-chain data (extreme fear) and daily technicals (bullish) are in divergence, which is usually a noteworthy "contrary indicator."
Step 5: The path of least resistance
In summary, the larger timeframe (daily, 4-hour) is upward, but the smaller timeframe (1-hour, 15-minute) is downward, with the market in a critical position of indecision. The path of least resistance may be "down first, then up," as the short-term selling pressure and death cross need to be digested.
Current recommendations do not support chasing highs. If you want to go long, wait patiently for a retracement to key support areas, such as near the effective low of 74131.55 on the 4-hour chart, or the support area of the daily trendline, and observe whether the smaller timeframe stops falling. The stop-loss can be set below lower support, such as below 73514.0. The target can initially be set to the 75000-75342.99 area.
If shorting, it's a short-term maneuver against the daily trend, and can only be tried lightly near the hourly resistance at 75043.48, with a stop-loss above 75534.76, targeting the 74000 area. The risk is relatively high.
Step 6: How to move today
Currently (within a few hours): It is highly likely to continue fluctuating weakly, operating within the 1-hour range of 73844.08 – 75043.48, more likely to first test support downward.
Today and the near-term key: Today's most important support is the 4-hour level at 74131.55 and the daily level at 73309.85. The most important resistance is at 75043.48 and 75342.99. The trendline support needs close attention.
Trading strategy: The most suitable approach currently is to "wait for a pullback to go long." Reason: The daily and 4-hour trends are intact, the on-chain extreme fear is a contrary indicator, and it's safer to wait for the bearish momentum on the smaller cycle to release and look for stabilization signals at key support levels. Avoid chasing gains at the upper end of a range.
Summary: The current core conflict in the market is the game between "long-term upward trend and short-term selling pressure from miners and market fear psychology."
Trading maxim: Regardless of how loud the "fear" wave from miner selling may be, don't forget to seek the gifts of opportunity left for the brave amidst "extreme fear."
[Sister Qinglan's personal perspective]
Ah, looking at the market, Sister Qinglan feels it’s a bit like a "tug-of-war," both bulls and bears are tussling over the rope at $75,000. Personally, my heart leans towards the bulls, as the daily framework remains intact, and the more fearful the market is, the less likely it tends to be a peak. But we cannot be reckless; we must wait for the bears to exhaust their strength and securely catch the support before proceeding. Remember, when others are fearful, we should start paying attention to opportunities, but certainly not charge in with our eyes closed!
This TPV system has been honed over the years through watching the market, reviewing trades, and practicing; I can't guarantee 100% accuracy, but at least it can help us have more confidence at key positions. To get the latest entry opportunities captured according to the TPV system in real-time, feel free to visit the official website of Qinglan Crypto Classroom www.qinglan.org
免责声明:本文章仅代表作者个人观点,不代表本平台的立场和观点。本文章仅供信息分享,不构成对任何人的任何投资建议。用户与作者之间的任何争议,与本平台无关。如网页中刊载的文章或图片涉及侵权,请提供相关的权利证明和身份证明发送邮件到support@aicoin.com,本平台相关工作人员将会进行核查。