Crypto Circle Academy: 4.17 Ethereum is in a phase of upward fluctuation, a trading risk control guide that beginners can understand! Latest market analysis and trading suggestions
The current price of Ethereum is 2327. Many people say that making money in the crypto world relies entirely on luck, but this time Ethereum's rise from 1700 to 2300+ is not just guesswork. Look at the arrangement of moving averages and the golden and dead crosses of MACD; each signal represents the voice of capital. Today, I will use two candlestick charts to clearly break down the current trend of Ethereum, from the direction of the trend to specific entry points, and I've even marked the stop-loss for you, so after reading this, you'll know how to operate next without searching for news everywhere and getting liquidated.
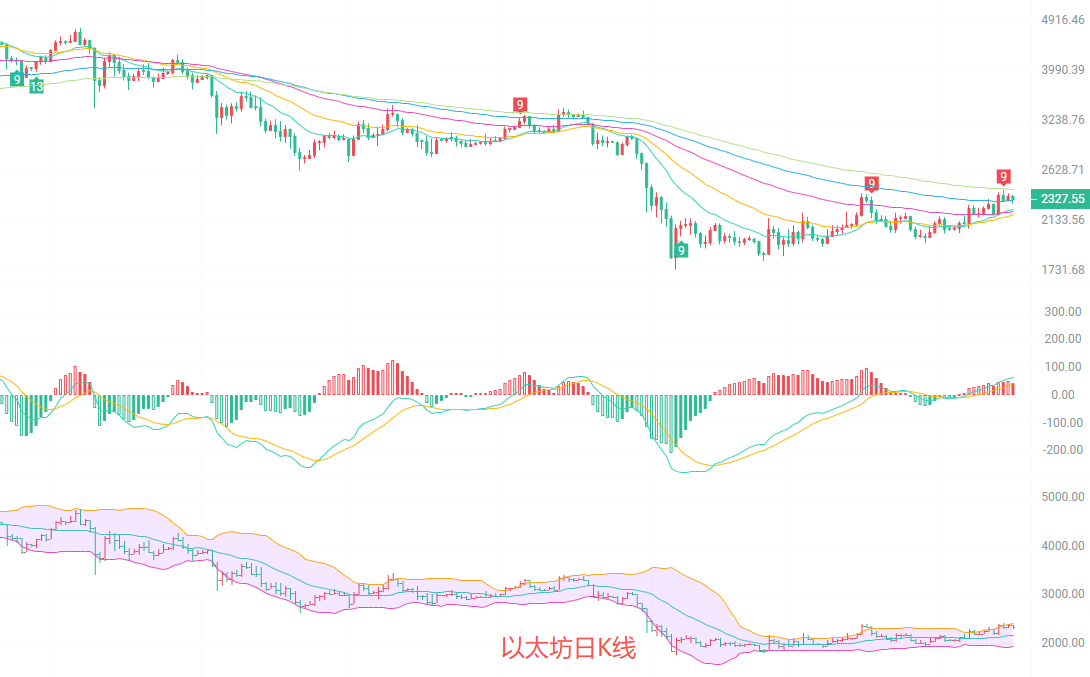
The daily candlestick chart has stabilized above the 15-day and 30-day EMA moving averages. The moving averages have turned upwards forming a bullish arrangement. After the MACD golden cross, the red momentum continues to strengthen. The Bollinger Bands are opening upwards, with the price running along the upper band, indicating a clear bullish trend. The current price of 2327 is between the middle band at 2167 and the upper band at 2406. There is strong resistance near the previous high of 2450 and critical support around 2200 below. The short-term trend leans towards a fluctuating upward movement, and no top signal has appeared yet.
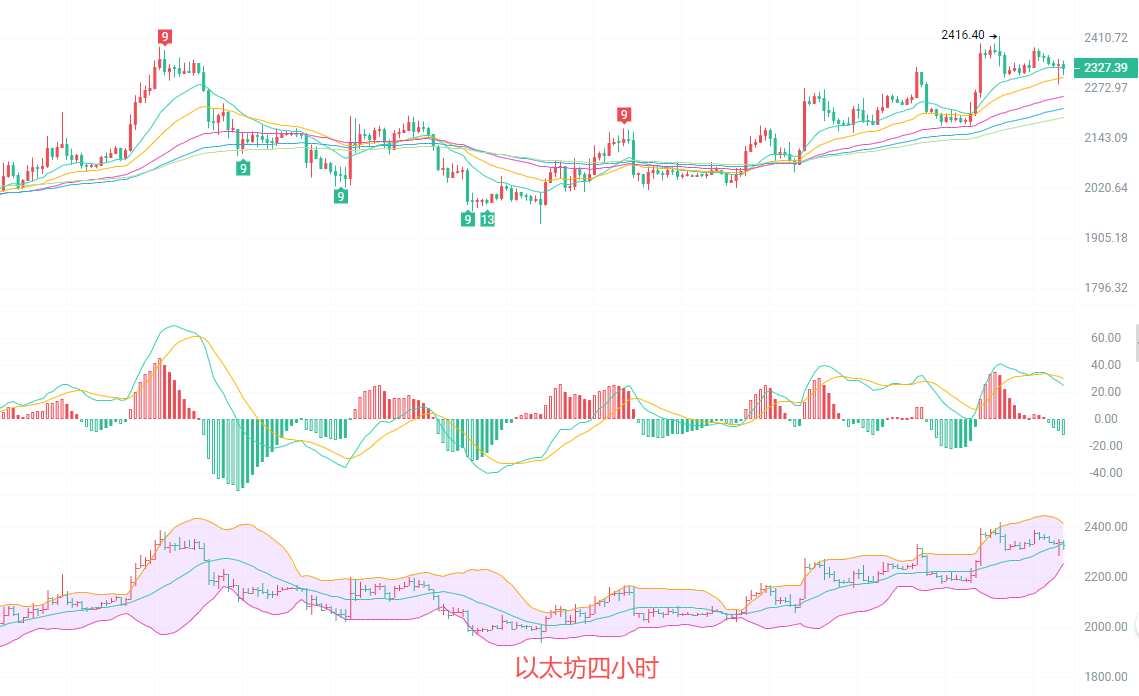
On the four-hour chart, it is in a clear upward channel, with EMA moving averages in a bullish arrangement. Short-term moving averages continuously support the price, and the Bollinger Bands are opening upwards, with the price consistently running along the upper band. The current DIF line of MACD is above the DEA line, but the red momentum bars have decreased, indicating a weakening of bullish strength and a need for short-term pullback. The bullish sequence of the TD indicator has entered its final phase, and short-term volatility may increase, requiring attention to the effectiveness of support near 2300.
Short-term reference: (Real time data has been updated; consult the author for details)
For the range below 2290 to 2310 upwards, set stop-loss at 2250, target looking at 2365 to 2400; if broken, look at 2440
For the range above 2400 to 2420 downwards, set stop-loss at 2460, target looking at 2350 to 2300; if broken, look at 2280
Specific operations should rely mainly on real-time market data. For more information, details can be consulted with the author. The article is published with a delay, suggestions are for reference only, and risks are borne by the reader.

Kind reminder: The above content is solely created by the author of this public account. The advertisements at the end of the article and in the comments section are unrelated to the author. Please discern carefully. Thank you for reading.
免责声明:本文章仅代表作者个人观点,不代表本平台的立场和观点。本文章仅供信息分享,不构成对任何人的任何投资建议。用户与作者之间的任何争议,与本平台无关。如网页中刊载的文章或图片涉及侵权,请提供相关的权利证明和身份证明发送邮件到support@aicoin.com,本平台相关工作人员将会进行核查。