Cryptocurrency Circle Scholar: Detailed Analysis of Bitcoin Repair Market on April 17, Major Trend Determination, Precise Entry Points for Minor Levels! Latest Market Analysis and Operation Suggestions
Bitcoin's current price is 74400, and many cryptocurrency friends are asking: Is it still possible to enter now? Will there be a risk of chasing high? In fact, there is no need for guesswork; the candlestick chart has already provided the answer. Indicators like moving averages, MACD, and Bollinger Bands are free signals from the market. Today, I will use two charts to clarify the current long-short logic, entry points, and stop-loss lines for you. Whether you are a beginner or an experienced trader, you will understand after reading, and you won't be swayed by market emotions anymore.
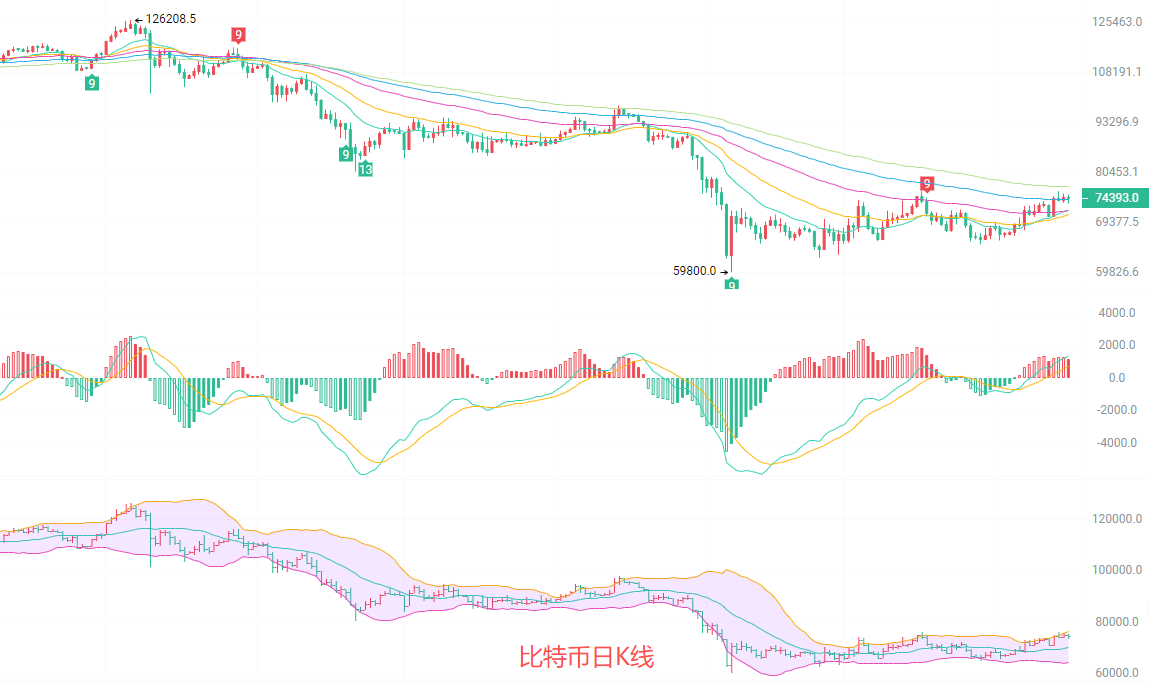
The daily candlestick is in the oscillation and repair phase after a decline, with the current price of 74343 standing above all short-term EMA moving averages. The MACD golden cross is expanding the red momentum continuously, and the Bollinger Bands are opening upwards, with the price running above the middle line, indicating a bullish trend is dominant. The upper Bollinger Band near 76000 is a strong resistance in the short term, while the moving average support near 70000 is quite solid. Overall, the daily trend is biased towards bullish, with limited correction space and a relatively stable upward rhythm.
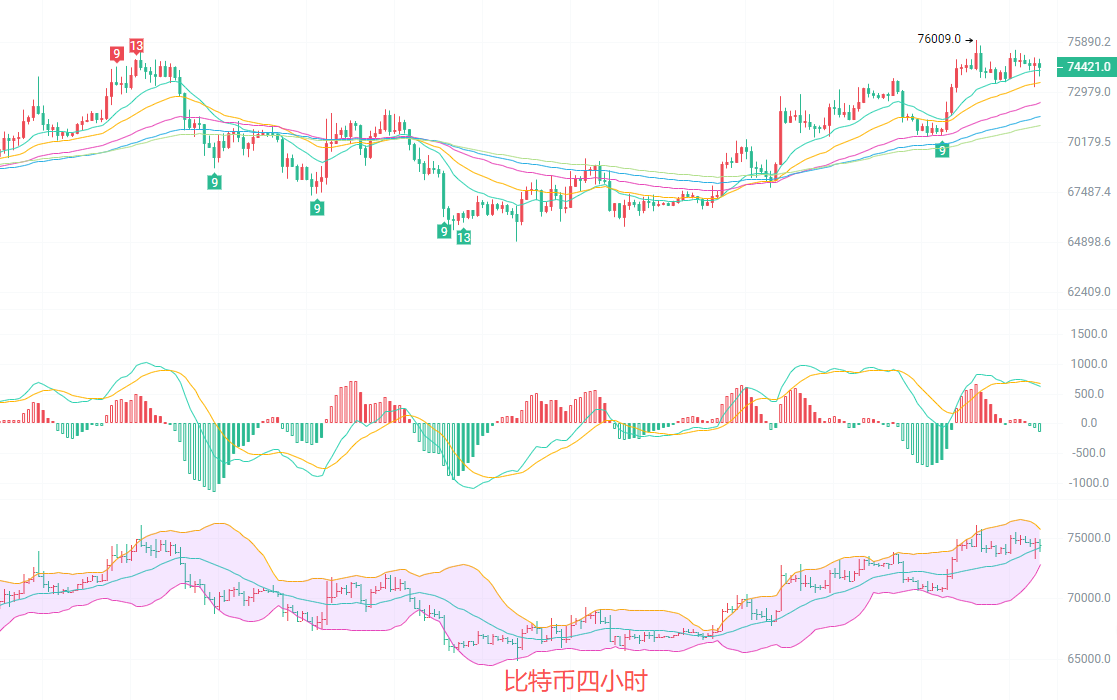
In the four-hour timeframe, the bullish trend is clear, the EMA moving averages are in a bullish arrangement, and the price consistently runs above the middle line of the Bollinger Bands, with the Bollinger Bands opening upwards and a complete ascending channel. The MACD is currently above the zero axis, but the red momentum bars are continuously shrinking, indicating a weakening of bullish force, with a short-term need for correction. The TD indicator shows it is currently at the end of the bullish sequence, and caution is needed for short-term correction to the support level around 74000. If the support holds, an upward continuation is very likely.
Short-term strategy reference: Follow the trend of the larger cycle, small stop-loss, fast entry and exit
Enter from 73500 to 73000 upwards, with a stop-loss of 72500, targeting 75500 to 76500
Enter from 76000 to 76500 downwards, with a stop-loss of 77200, targeting 75000 to 74000
The cryptocurrency circle has always been one where the foresight and awareness eat meat, those who are late to realize drink soup, and those who remain unaware take over.
Specific operations should be based on real-time market data. For more information, you can consult me. There may be delays in article publication; suggestions are for reference only, and risks are to be borne by yourself

Warm Reminder: The above content is only created by the author of this public account. The advertisements at the end of the article and in the comments section are unrelated to the author. Please discern carefully, and thank you for reading.
免责声明:本文章仅代表作者个人观点,不代表本平台的立场和观点。本文章仅供信息分享,不构成对任何人的任何投资建议。用户与作者之间的任何争议,与本平台无关。如网页中刊载的文章或图片涉及侵权,请提供相关的权利证明和身份证明发送邮件到support@aicoin.com,本平台相关工作人员将会进行核查。