Market Waves: April 16 Ethereum (ETH) Market Analysis Reference:
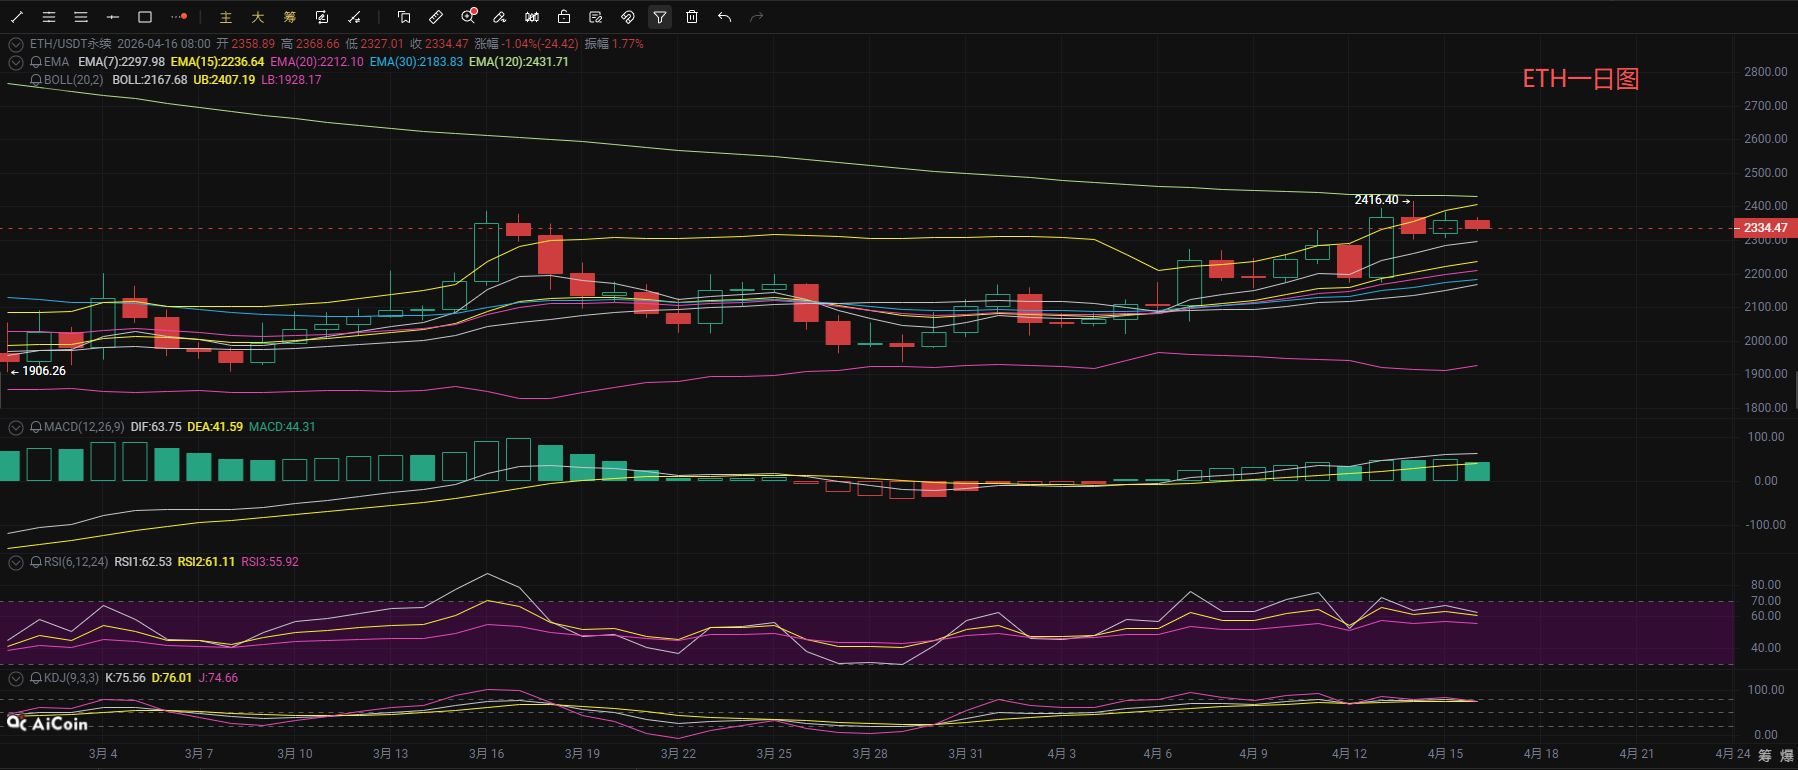
Ethereum has surged and retreated again, with the current price around 2330 on the daily chart. The EMA moving averages are in a bullish arrangement, and the price is supported by short-term moving averages; the medium-term trend is slightly bullish. However, after hitting resistance near the previous high of 2416, it has continuously closed with bearish candles, indicating a decrease in upward momentum. The MACD indicator's DIF and DEA remain above the zero axis, with shrinking bars, showing a gradual weakening of bullish strength; RSI's three lines have turned downward, with RSI1 retreating to around 62, alleviating the overbought state; the KDJ indicator's J line turns downward, and the three lines converge, indicating that the short-term fluctuation adjustment continues. The Bollinger Bands show that the price is below the upper band, which is exerting pressure on the price, while the lower EMA7 is the key support. Overall, the mid-term upward trend on the daily chart remains intact, but the short-term has entered a phase of high-level fluctuation adjustment, requiring caution for a pullback to confirm support.
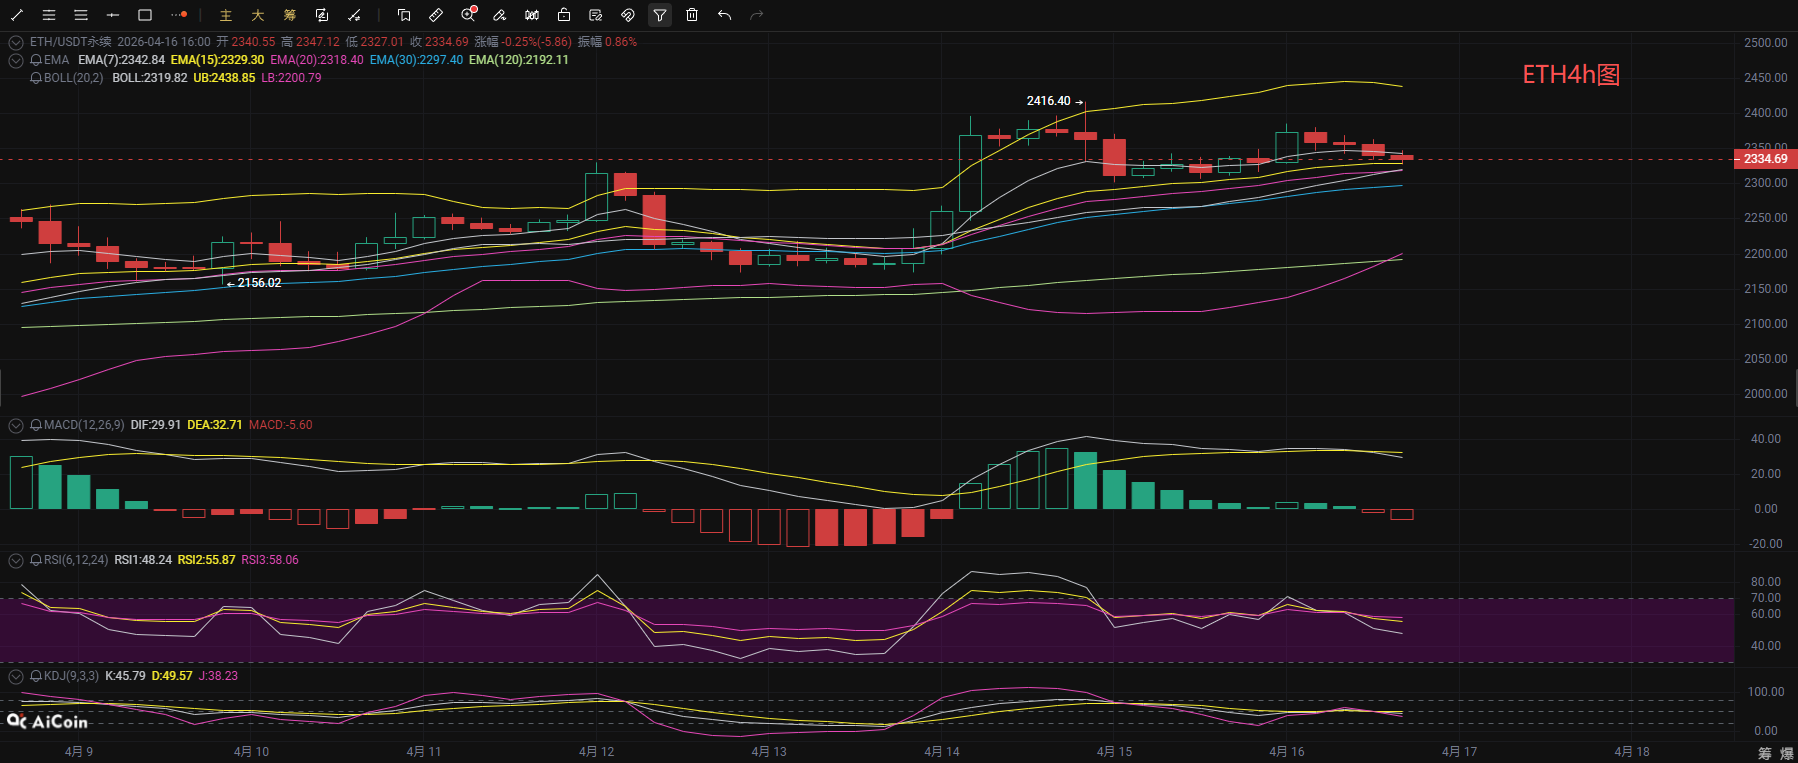
On the 4-hour chart, the price has fluctuated downwards after reaching the high of 2416, currently around 2330. The Bollinger Bands have contracted, with the price falling from the upper band to the middle band, indicating a slight bearish short-term fluctuation. The MACD indicator's DIF has crossed below the DEA, forming a death cross, releasing bearish momentum; the RSI three lines have retreated to the 50-60 range, falling from the overbought area, indicating insufficient bullish momentum; the KDJ indicator has three lines diverging downwards, with the J line entering a weak area, suggesting a short-term adjustment is needed. Although the EMA moving averages are still in a bullish arrangement, the price has fallen below the short-term EMA7 moving average, with EMA15 (2328) and EMA20 (2318) providing immediate support. Overall, the 4-hour chart is in a correction cycle after an increase, with the primary focus on short-term fluctuation adjustment, needing attention on the strength of support levels; at present, the overall trend structure remains intact, and this adjustment could be a healthy buildup, still providing opportunities for further upward movement in the future.
Market Waves: April 16 Short-Term Reference for Ethereum:
Short position: short in the range of 2430-2400, stop loss 30 points, target at 2360-2320,
Long position: long in the range of 2300-2330, stop loss 30 points, target at 2350-2400,
[The above analysis and strategies are for reference only. Please bear risks yourself; publication or timing of the article may be delayed, strategies may lack timeliness, do not operate blindly.]

This article's content is originally shared by [Market Waves] and represents only personal views. The delivery of the article has a delay and is for reference only. Do not operate blindly! Want to get more daily real-time trades? Then follow my public account! Here, you can engage in online technical learning of market trends, and also learn about knowledge related to exiting positions. I have years of research experience in the market, focusing on the big trends in the cryptocurrency world. Mainly responsible for analysis and guidance on investment operations of BTC, ETH, SOL, BCH, and other cryptocurrencies. Welcome to study and explore together.
免责声明:本文章仅代表作者个人观点,不代表本平台的立场和观点。本文章仅供信息分享,不构成对任何人的任何投资建议。用户与作者之间的任何争议,与本平台无关。如网页中刊载的文章或图片涉及侵权,请提供相关的权利证明和身份证明发送邮件到support@aicoin.com,本平台相关工作人员将会进行核查。