Original Author: Glassnode
Translation by: AididiaoJP, Foresight News
The price of Bitcoin remains stable at around $74,000, approximately 5% below the key resistance level of $78,000. Demand for spot and exchange-traded funds has improved, but profit-taking behavior, weak market breadth, and cautious options positioning suggest that the current rally is driven by capital flows and remains fragile, lacking strong market confidence.
Summary
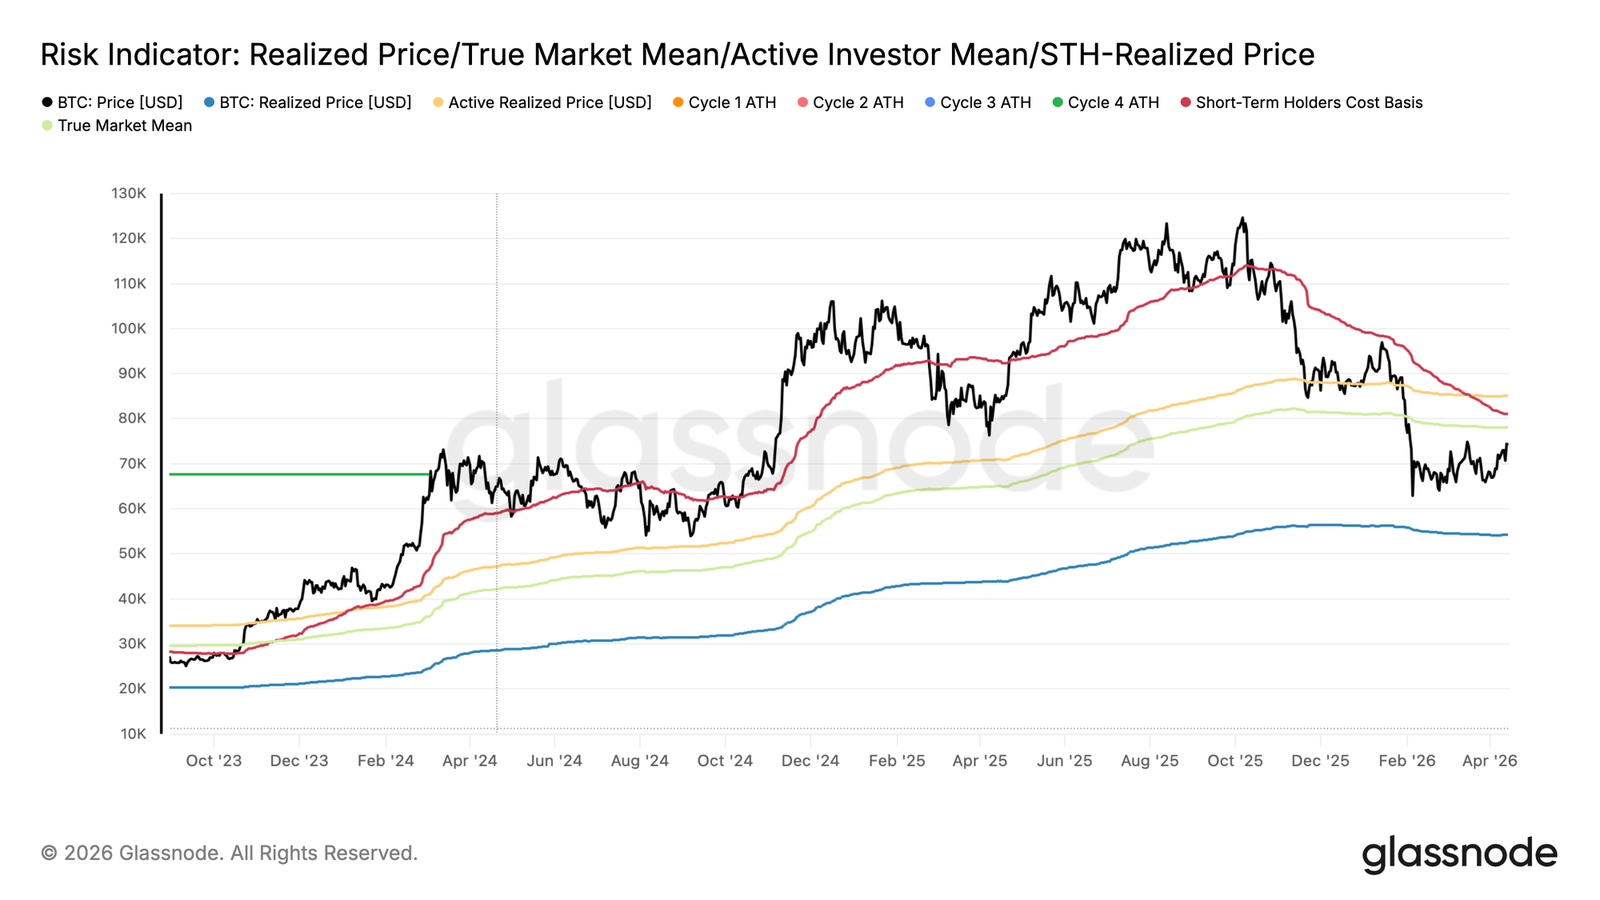
- The price of Bitcoin has risen to around $74,000, which is currently 5.2% lower than the true market average of $78,100, which remains a key resistance level recently. The profit supply from short-term holders accounts for 43.2%, indicating there is still room for further upside before reaching a typical distribution threshold.
- Profit-taking activity is warming up, with a 30-day exponential moving average of realized profit-loss ratio at 1.16, indicating that investors are selling into strength. To maintain stability above $78,100, the market must be able to absorb this upper supply pressure.
- Institutional positions are stabilizing, with inflows into exchange-traded funds and Chicago Mercantile Exchange exposure rebounding. However, participation remains below previous highs, showing that institutional investors are re-entering cautiously and selectively rather than fully shifting to a risk-on mode.
- Spot and liquidity dynamics reflect uneven demand. Binance leads in buying power, with its buying intensity stronger than that of Coinbase, while data from ultra-liquid platforms indicate that the market is operating within a liquidity-driven range, with prices reacting back and forth between clustered long and short liquidations.
- Derivative and on-chain signals point to a structurally neutral yet weak stance. Funding rates remain balanced, implied volatility is in a compressed state, and exchange fund flows have shifted to moderate net inflows, indicating early accumulation behavior, though market conviction is limited.
On-chain Analysis
Approaching the Upper Limit
Last week, this report defined the true market average of $78,100 as potentially the mid-term upper limit for any rebound in the current bear market structure.
Since then, the price of Bitcoin has gradually risen, currently trading at around $74,000, approximately 5.2% lower than the true market average—namely, the trajectory of active supply cost basis. Although the price has not yet tested and held above this key threshold, there remains a significant chance that prices may push upwards towards and even briefly surpass this level in the medium term.
This content will examine the most suitable on-chain tools to identify local tops during bear market rebounds, to help investors cope with the risk of distribution pressure when prices approach structurally significant resistance levels.
New Buyers Approaching a Critical Point
As the price continues to consolidate below the true market average, the behaviors of short-term holders provide a reliable perspective for judging when a bear market rebound might exhaust itself.
The profit supply from short-term holders measures the proportion of recently acquired supply that is currently unrealized in profit, reflecting the profit-taking pressure from new market participants directly. Historical data show that local tops during bear market rebounds often form when this indicator approaches its statistical mean of about 54.2%, a threshold where the concentration of profiting short-term holders is enough to trigger significant distribution. The current reading of this indicator is at 43.2%, significantly below this threshold, indicating that this round of rebound has not yet entered a typical exhaustion range. This allows room for further slight upward movement toward the true market average, while also providing a quantifiable level that can be monitored as prices advance.
Profit-Taking Alarm Sounds
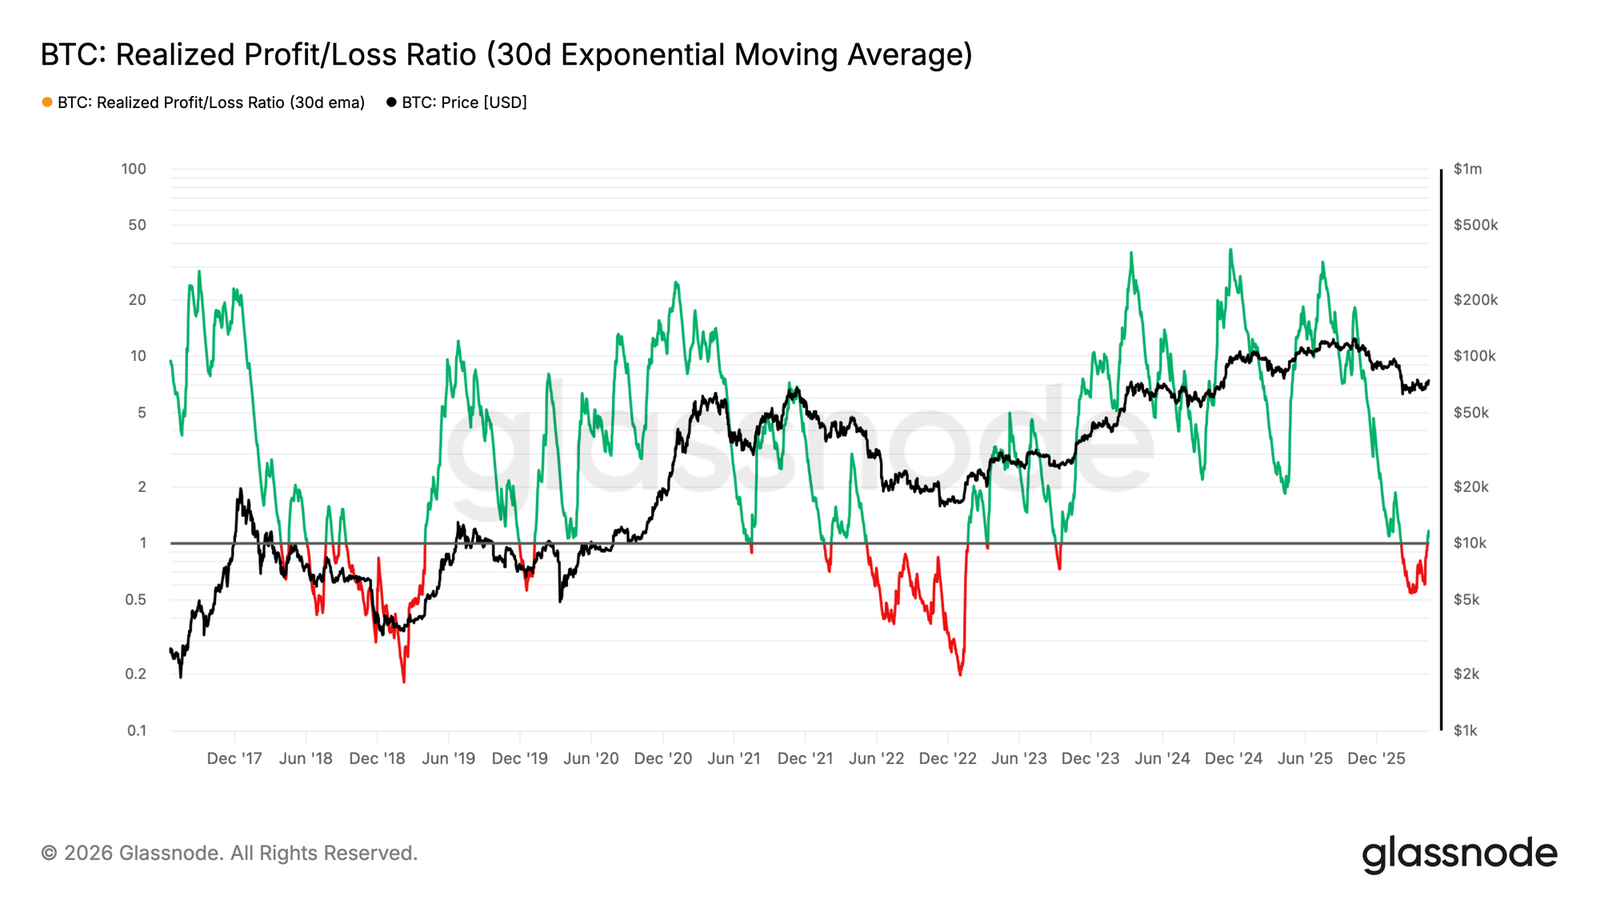
Based on the short-term exhaustion signals mentioned above, assessing market momentum over a longer term requires examining the balance between realized profits and losses across a wider investor base. The realized profit-loss ratio measures the value of profits made for every dollar of losses realized on-chain; its 30-day exponential moving average smooths out short-term noise to reveal potential trends.
A value above 1 indicates that profit-taking predominates over loss realization. Therefore, the current reading of 1.16 confirms that investors are generally viewing this rally as an opportunity to exit positions near the breakeven point or in a thin profit state. While this does not signal an immediate reversal, a sharp increase in this ratio during bear market rebounds has historically served as a warning sign of distribution behavior rather than a genuine revival of demand.
For this rebound to evolve into a structural shift towards a bull market, the market needs a significant demand catalyst to absorb this wave of profit-taking and maintain prices above the true market average of $78,100 in the medium term.
Off-chain Analysis
Selective Spot Buying
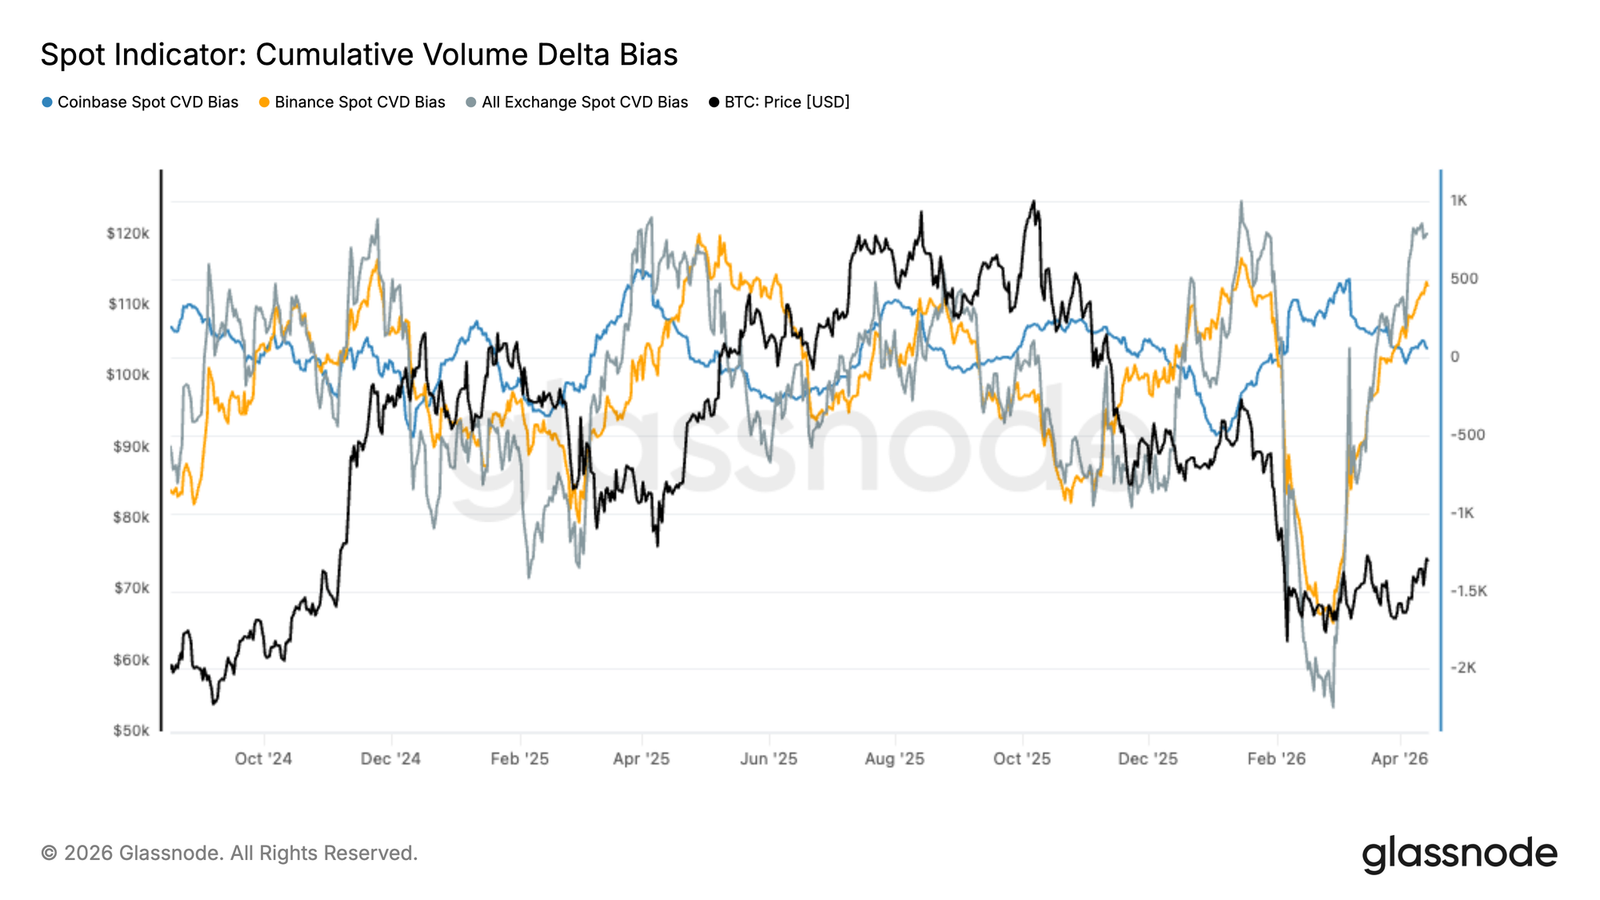
Following the capitulation event in February, the accumulated spot trading volume difference rebounded sharply, with overall capital flow rising from deeply negative territory back into positive territory. This shift marks a clear transition from aggressive selling pressure to net accumulation in spot markets, aligning with the recent price stabilization trend.
However, the recovery in demand across various trading venues is not uniform.
Binance's fund flows led this rally, indicating a recovery in offshore and retail-driven activity. In contrast, Coinbase's accumulated trading volume difference remains relatively sluggish, indicating that institutional investors are slower to re-engage. This difference is noteworthy, as sustainable rally typically requires broader participation from both types of investor groups.
While the digestion of selling pressure is constructive, the current structure reflects more selective buying rather than a fully established demand framework.
For this recovery to withstand scrutiny, Coinbase's fund flows may need to provide stronger confirmation signals to indicate deepening institutional participation and resilient support at higher price levels.
Chicago Mercantile Exchange Futures and ETF Positions Rebuilding Cautiously
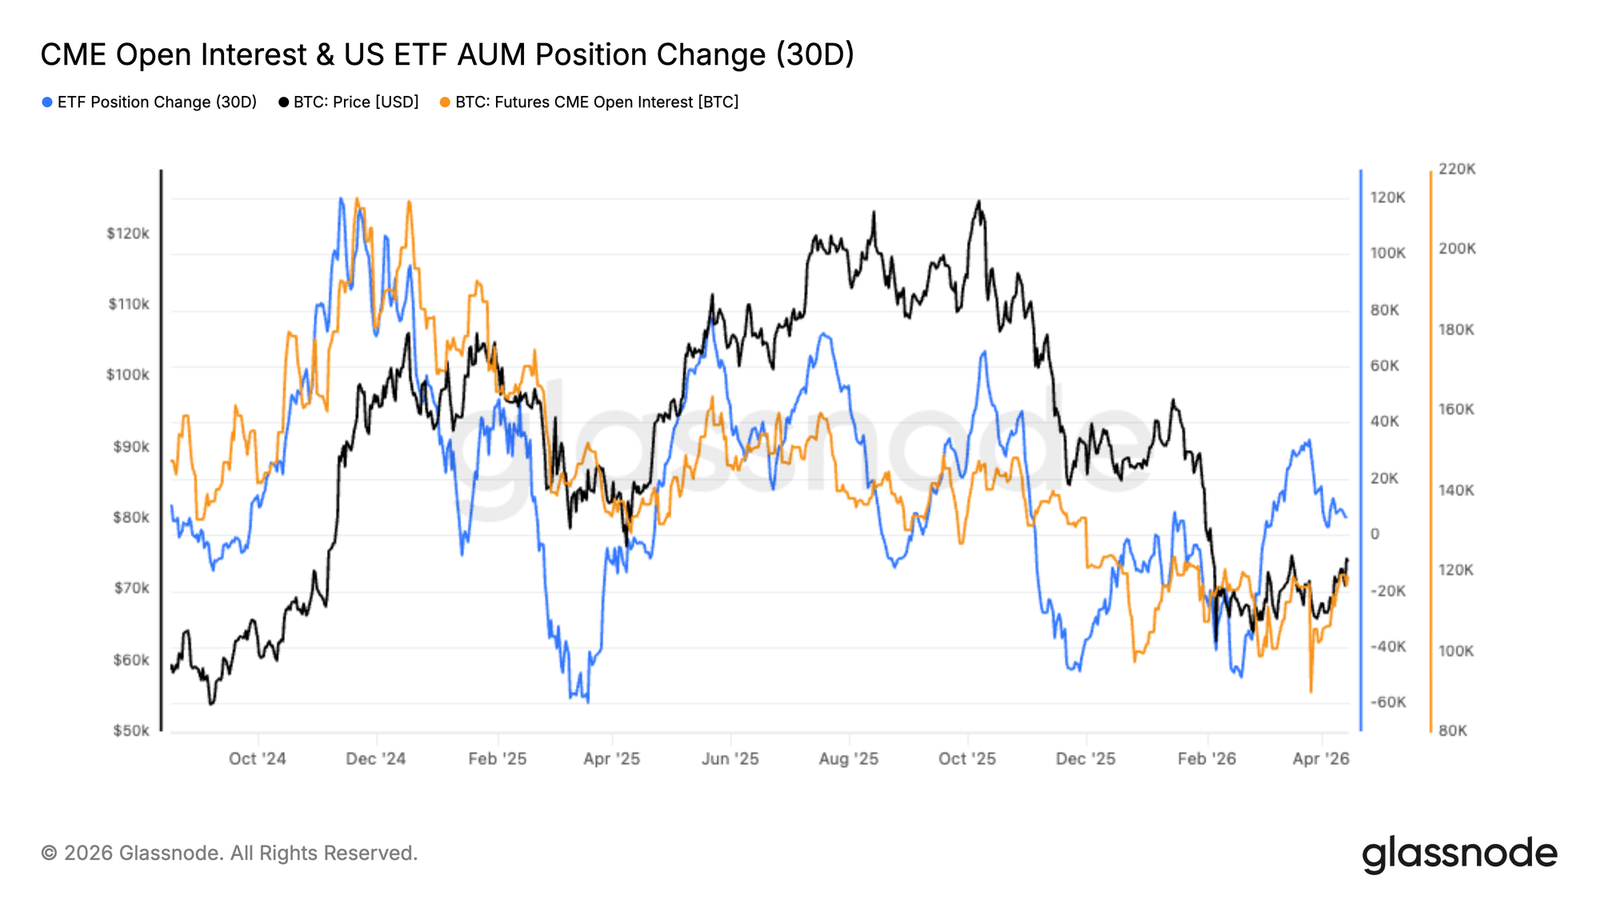
After the February pullback, institutional risk exposure seems to be stabilizing, with the Chicago Mercantile Exchange open interest and U.S. exchange-traded funds' managed asset sizes showing early signs of recovery. After experiencing a sharp deleveraging event, CME positions have begun to rebuild from local lows, indicating that futures-based exposure is gradually returning.
Meanwhile, ETF fund flows have reverted to positive territory after a prolonged period of outflows. This reversal indicates a recovery in capital allocation through regulated investment tools, which are typically associated with long-term and institutional participants.
However, the pace of recovery remains measured rather than aggressive. CME open interest is still far below previous highs, and inflows into exchange-traded funds lack the sustained momentum seen in the early stages of this cycle. This points to a more cautious re-entry behavior rather than a wholesale shift towards risk appetite.
Overall, data suggests that institutional investors are beginning to return to the market, but their approach is more selective and restrained. Stronger and more persistent expansions in CME positions and ETF fund inflows would signal a more definitive return of institutional confidence.
Hyperliquid Highlights the Liquidity-Driven Range
Hyperliquid's liquidation data shows a highly concentrated and responsive perpetual contract market, with liquidity tightly surrounding current prices. From a single trading venue perspective, this reflects more of a tactical positioning setup than a broad market structure, providing insights into short-term leverage dynamics.
On the downside, the tight long liquidation band lies between $63,000 and $65,000. Prices have tested this area multiple times, indicating it serves as a short-term liquidity magnet that triggers and absorbs forced selling behavior.
On the upside, the short liquidation cluster is concentrated around $74,000 to $76,000. Recent rebounds have tested this area but failed to decisively break through, showing that upper liquidity continues to exert pressure on price.
Overall, price movements seem driven by liquidation flows rather than strong directional conviction. To achieve a sustainable breakthrough, it may require clearing positions on one side of the order book to trigger a chain reaction, allowing prices to expand beyond the current range.

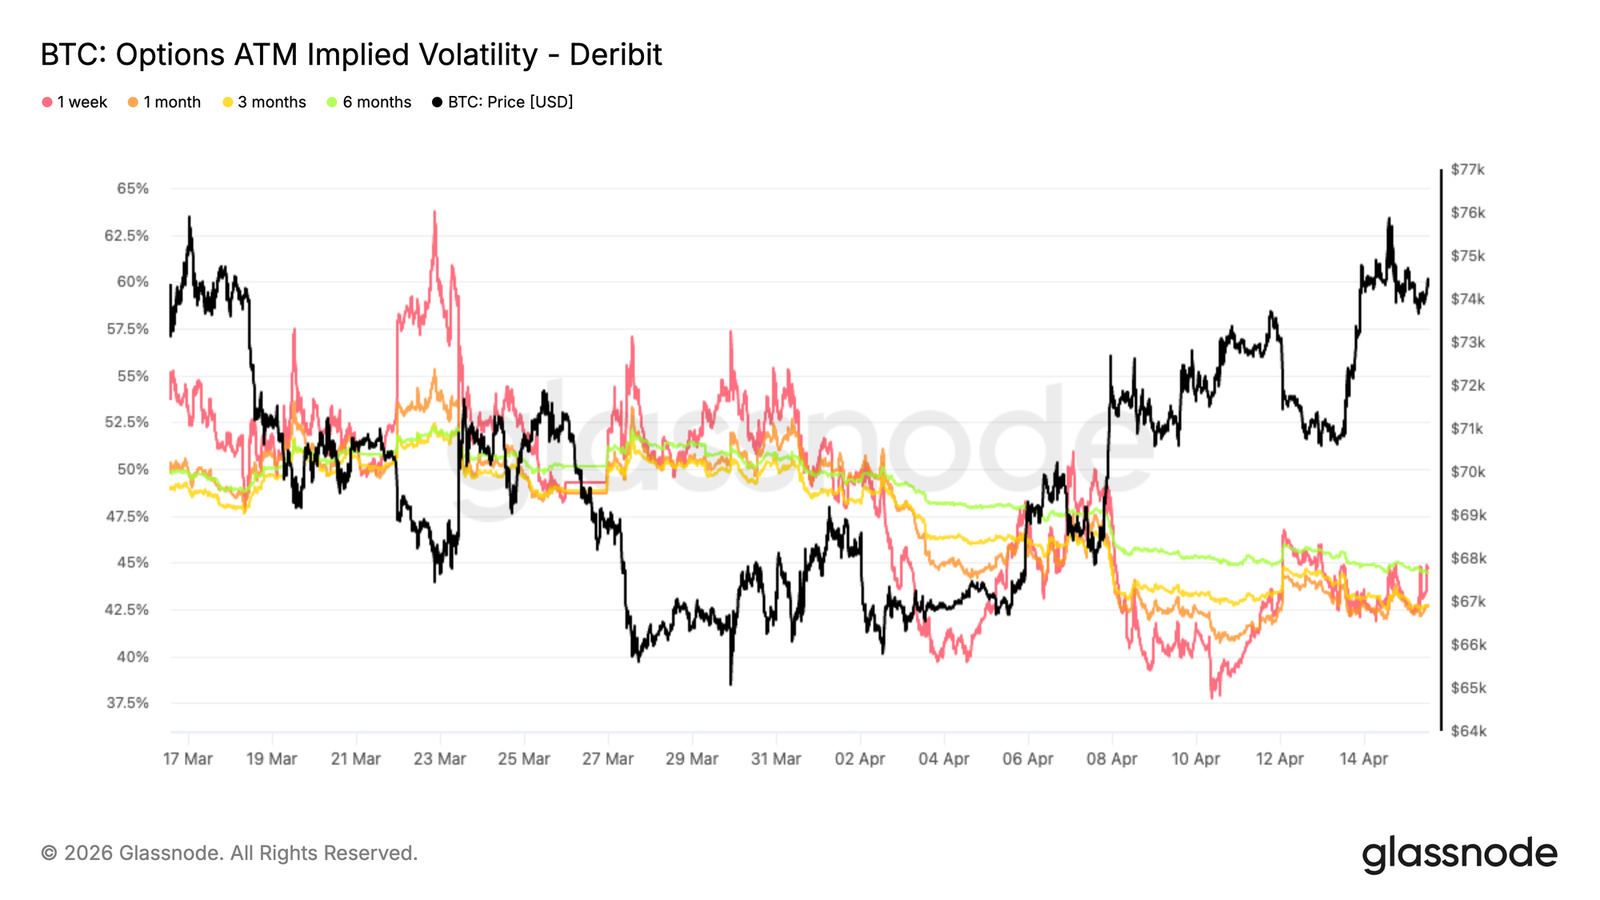
Implied Volatility Term Structure Remains Compressed
The rebound in the spot market has not translated into meaningful re-pricing of volatility, with implied volatility declining across the entire curve. Front-end contracts have softened, and longer-term contract prices have also been lowered, indicating a broad normalization of volatility expectations. The term structure remains relatively flat, with 1-month volatility slightly lower than 3-month volatility at around 42.6%, reflecting limited urgency in the market's pricing of recent risks. This compressed state indicates that recent geopolitical headlines are no longer viewed as catalysts for ongoing turmoil. Instead, volatility is being re-priced to more stable conditions, even though macro uncertainty has not been fully eradicated. The synchronized drop in contracts of varying terms indicates that traders are unwinding protective positions rather than adding new exposures.
Despite rising spot prices, the options market has not signaled that market regimes have changed, but rather reflects a normalization process following a period of high pressure.
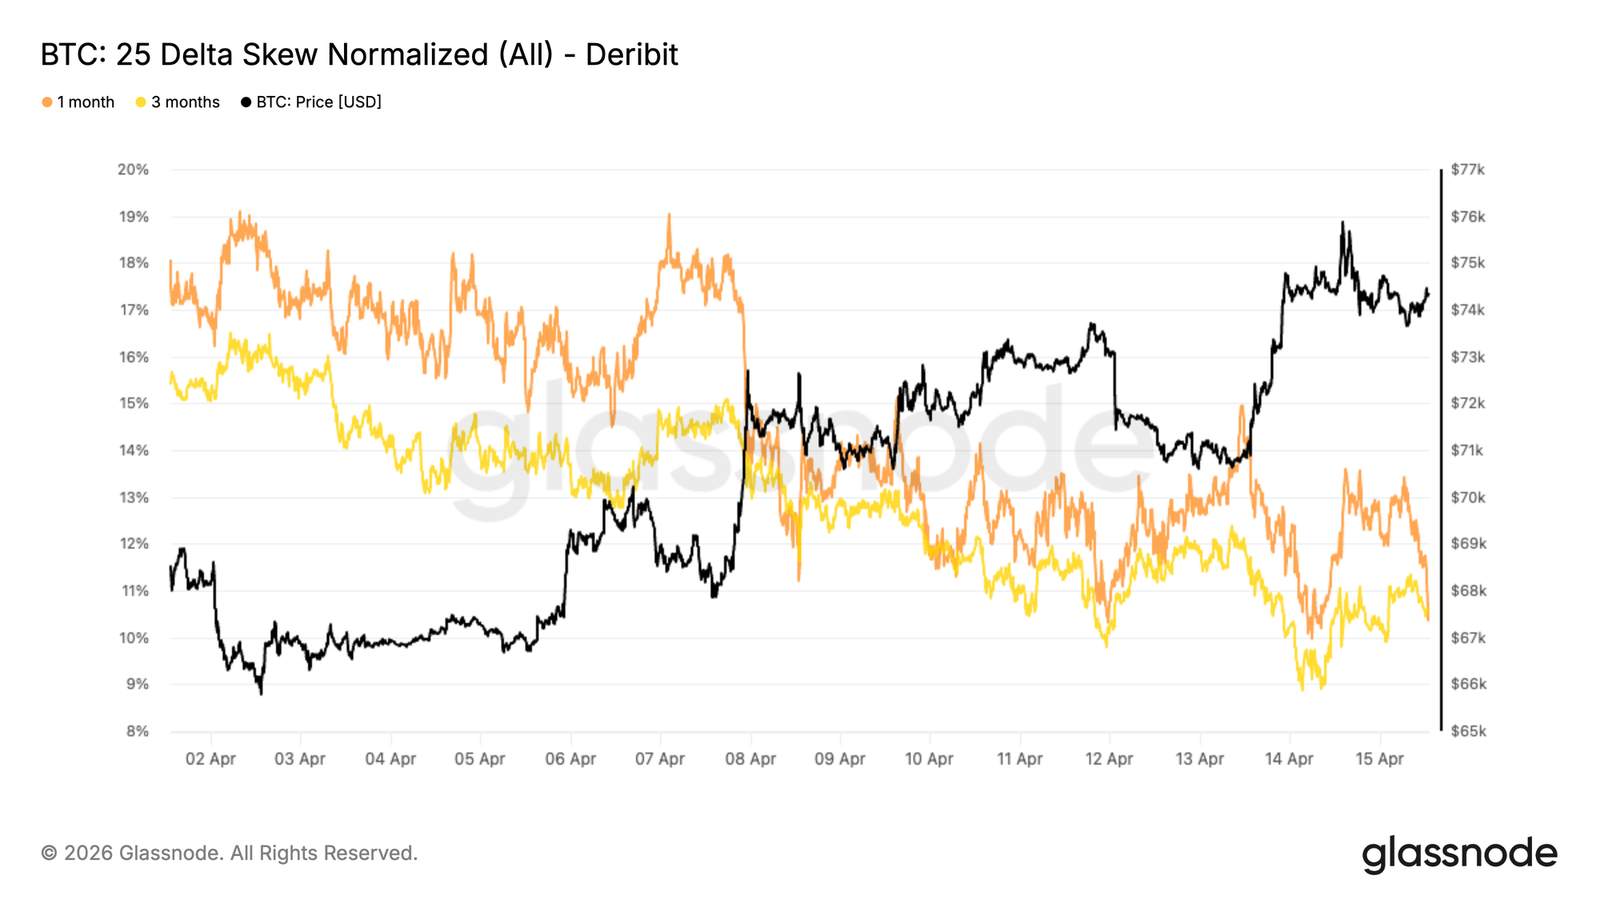
25Delta Skew Still Reflects Downward Demand
Despite a easing of volatility levels, the relative pricing of options still shows a preference for protective positions. The 25Delta skew across various terms still leans towards bearish options, indicating that the trading prices of downside protective options remain at a premium over bullish options, even though the skew itself has receded from high double digits to low double digits.
This suggests that even as traders reduced direct hedging positions, they have not actively shifted towards bullish positions. The continued presence of negative skew highlights the cautious sentiment beneath the surface of the market.
Recent skew values, especially the compression of longer-term skew values, indicate some normalization in the market as extreme tail risk hedges are unwound. However, the overall structure still reflects asymmetries in demand, with a structural need for protective positions remaining evident.
The phenomenon of decreasing volatility coexisting with continued downward skew emphasizes the market's skeptical rather than confident attitude towards this rebound.
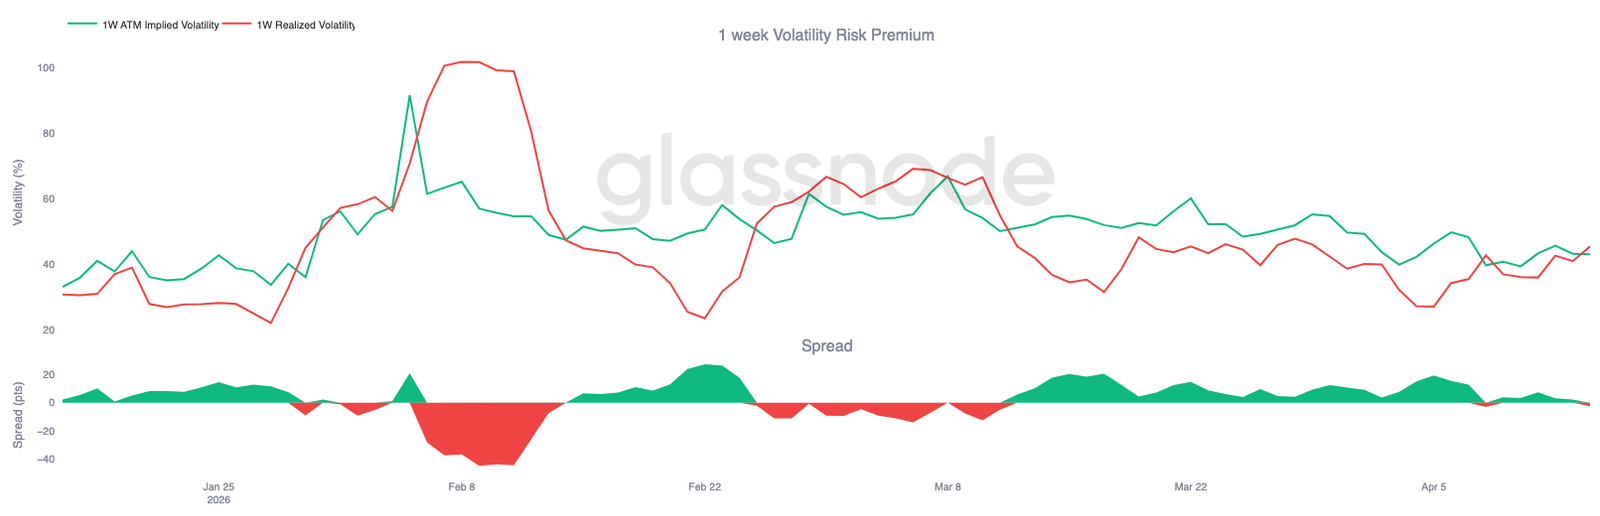
1-Week Volatility Risk Premium Turns Negative
From a broader perspective of the volatility surface, the short-term volatility risk premium has reversed, with realized volatility surpassing implied volatility. This spread measures the gap between forward expectations and actual price volatility, currently around -2 volatility points, with at-the-money option implied volatility at about 43 and realized volatility close to 45.
This shift occurred against a backdrop of significant price fluctuations early in the week, when Bitcoin's daily increase exceeded 5%, while implied volatility was priced at lower levels. Consequently, the options market underestimated the magnitude of actual price fluctuations, leading to an inverted risk premium.
In this context, short-term options no longer embed protective premiums but reflect a market state caught off-guard by actual price movements.
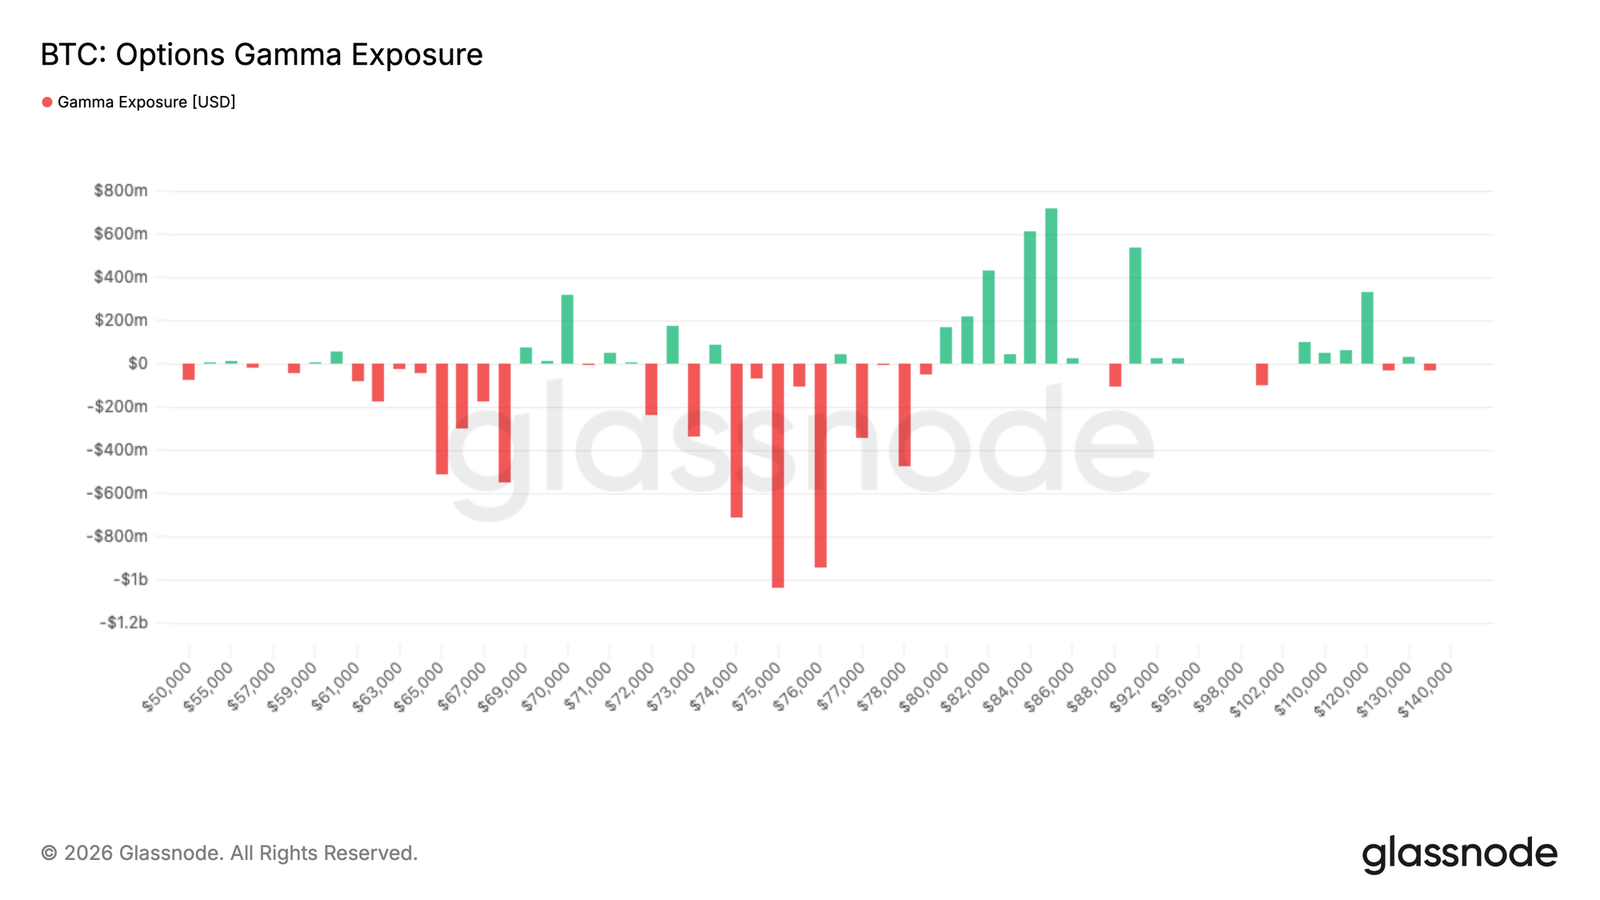
$76,000 Becomes a Key Pivot
From a market structure perspective, dealer positions have played a core role in recent price action. A large amount of negative gamma exposure is concentrated between $74,000 and $76,000, with about $3 billion of exposure located above the spot price, creating an area where hedging operations can impact price direction.
As the spot price approaches this area, dealers must buy in alignment with market movement to manage their exposure, thereby strengthening upward momentum. This dynamic alters the interpretation of resistance levels, as regions with high negative gamma may act as accelerators rather than obstacles.
Below this area, a lack of strong positive gamma support suggests that price movements may remain sensitive to liquidity flows. The current market structure reflects that amidst a relatively sparse liquidity and position layout, mechanical hedging activities can amplify price volatility.
Conclusion
In summary, the market is showing early signs of stabilization in terms of spot, derivatives, and on-chain indicators, but the recovery remains uneven and lacks broad market confidence. Spot demand has returned, flows into exchange-traded funds are improving, and market positions are starting to rebuild; however, participation levels across various trading venues and investor groups remain dispersed. The derivatives and options markets reflect this uncertainty, with neutral position layouts and compressed volatility indicating a lack of strong directional preference.
At the same time, structural headwinds persist. Profit-taking increases with rising prices, short-term holders are approaching breakeven levels, and option skews continue to show demand for downside protection. Liquidity dynamics and dealer positions also play an outsized role, reinforcing a sensitive market environment driven by capital flow.
For a more decisive trend to emerge, the market may require sustained inflows, stronger institutional participation, and the ability to absorb upper supply pressure at key resistance levels—especially near the true market average.
免责声明:本文章仅代表作者个人观点,不代表本平台的立场和观点。本文章仅供信息分享,不构成对任何人的任何投资建议。用户与作者之间的任何争议,与本平台无关。如网页中刊载的文章或图片涉及侵权,请提供相关的权利证明和身份证明发送邮件到support@aicoin.com,本平台相关工作人员将会进行核查。


