On April 15, the S&P 500 closed at 7,022.95 points, exactly 77 days after it last set a historical high. During these 77 days, the United States fought a war, oil prices broke over $100, and the stock market experienced its fastest 10% correction in five years. Then, it returned to a new high in about 11 trading days.
This number warrants some reflection. 11 trading days is an impossible speed after every crisis of similar scale in American history.
What 11 Trading Days Means in History
Where does this recovery speed stand in historical terms?
According to PBS, JPMorgan strategists referred to this recovery as "the fastest rebound since the COVID-19 pandemic." Viewed against historical figures, this statement is not an exaggeration.
During the COVID-19 pandemic in 2020, the market took about 103 trading days to recover from its low on March 23 to a historical high on August 18. The Gulf War in 1990 saw the market recover from its low at the end of October to a prior high in February 1991, taking about 87 trading days. The US debt crisis in 2011 took about 106 trading days to rebound from that year's low in October to a new high in March 2012.
The recovery from the Iranian War in 2026: 11 trading days.
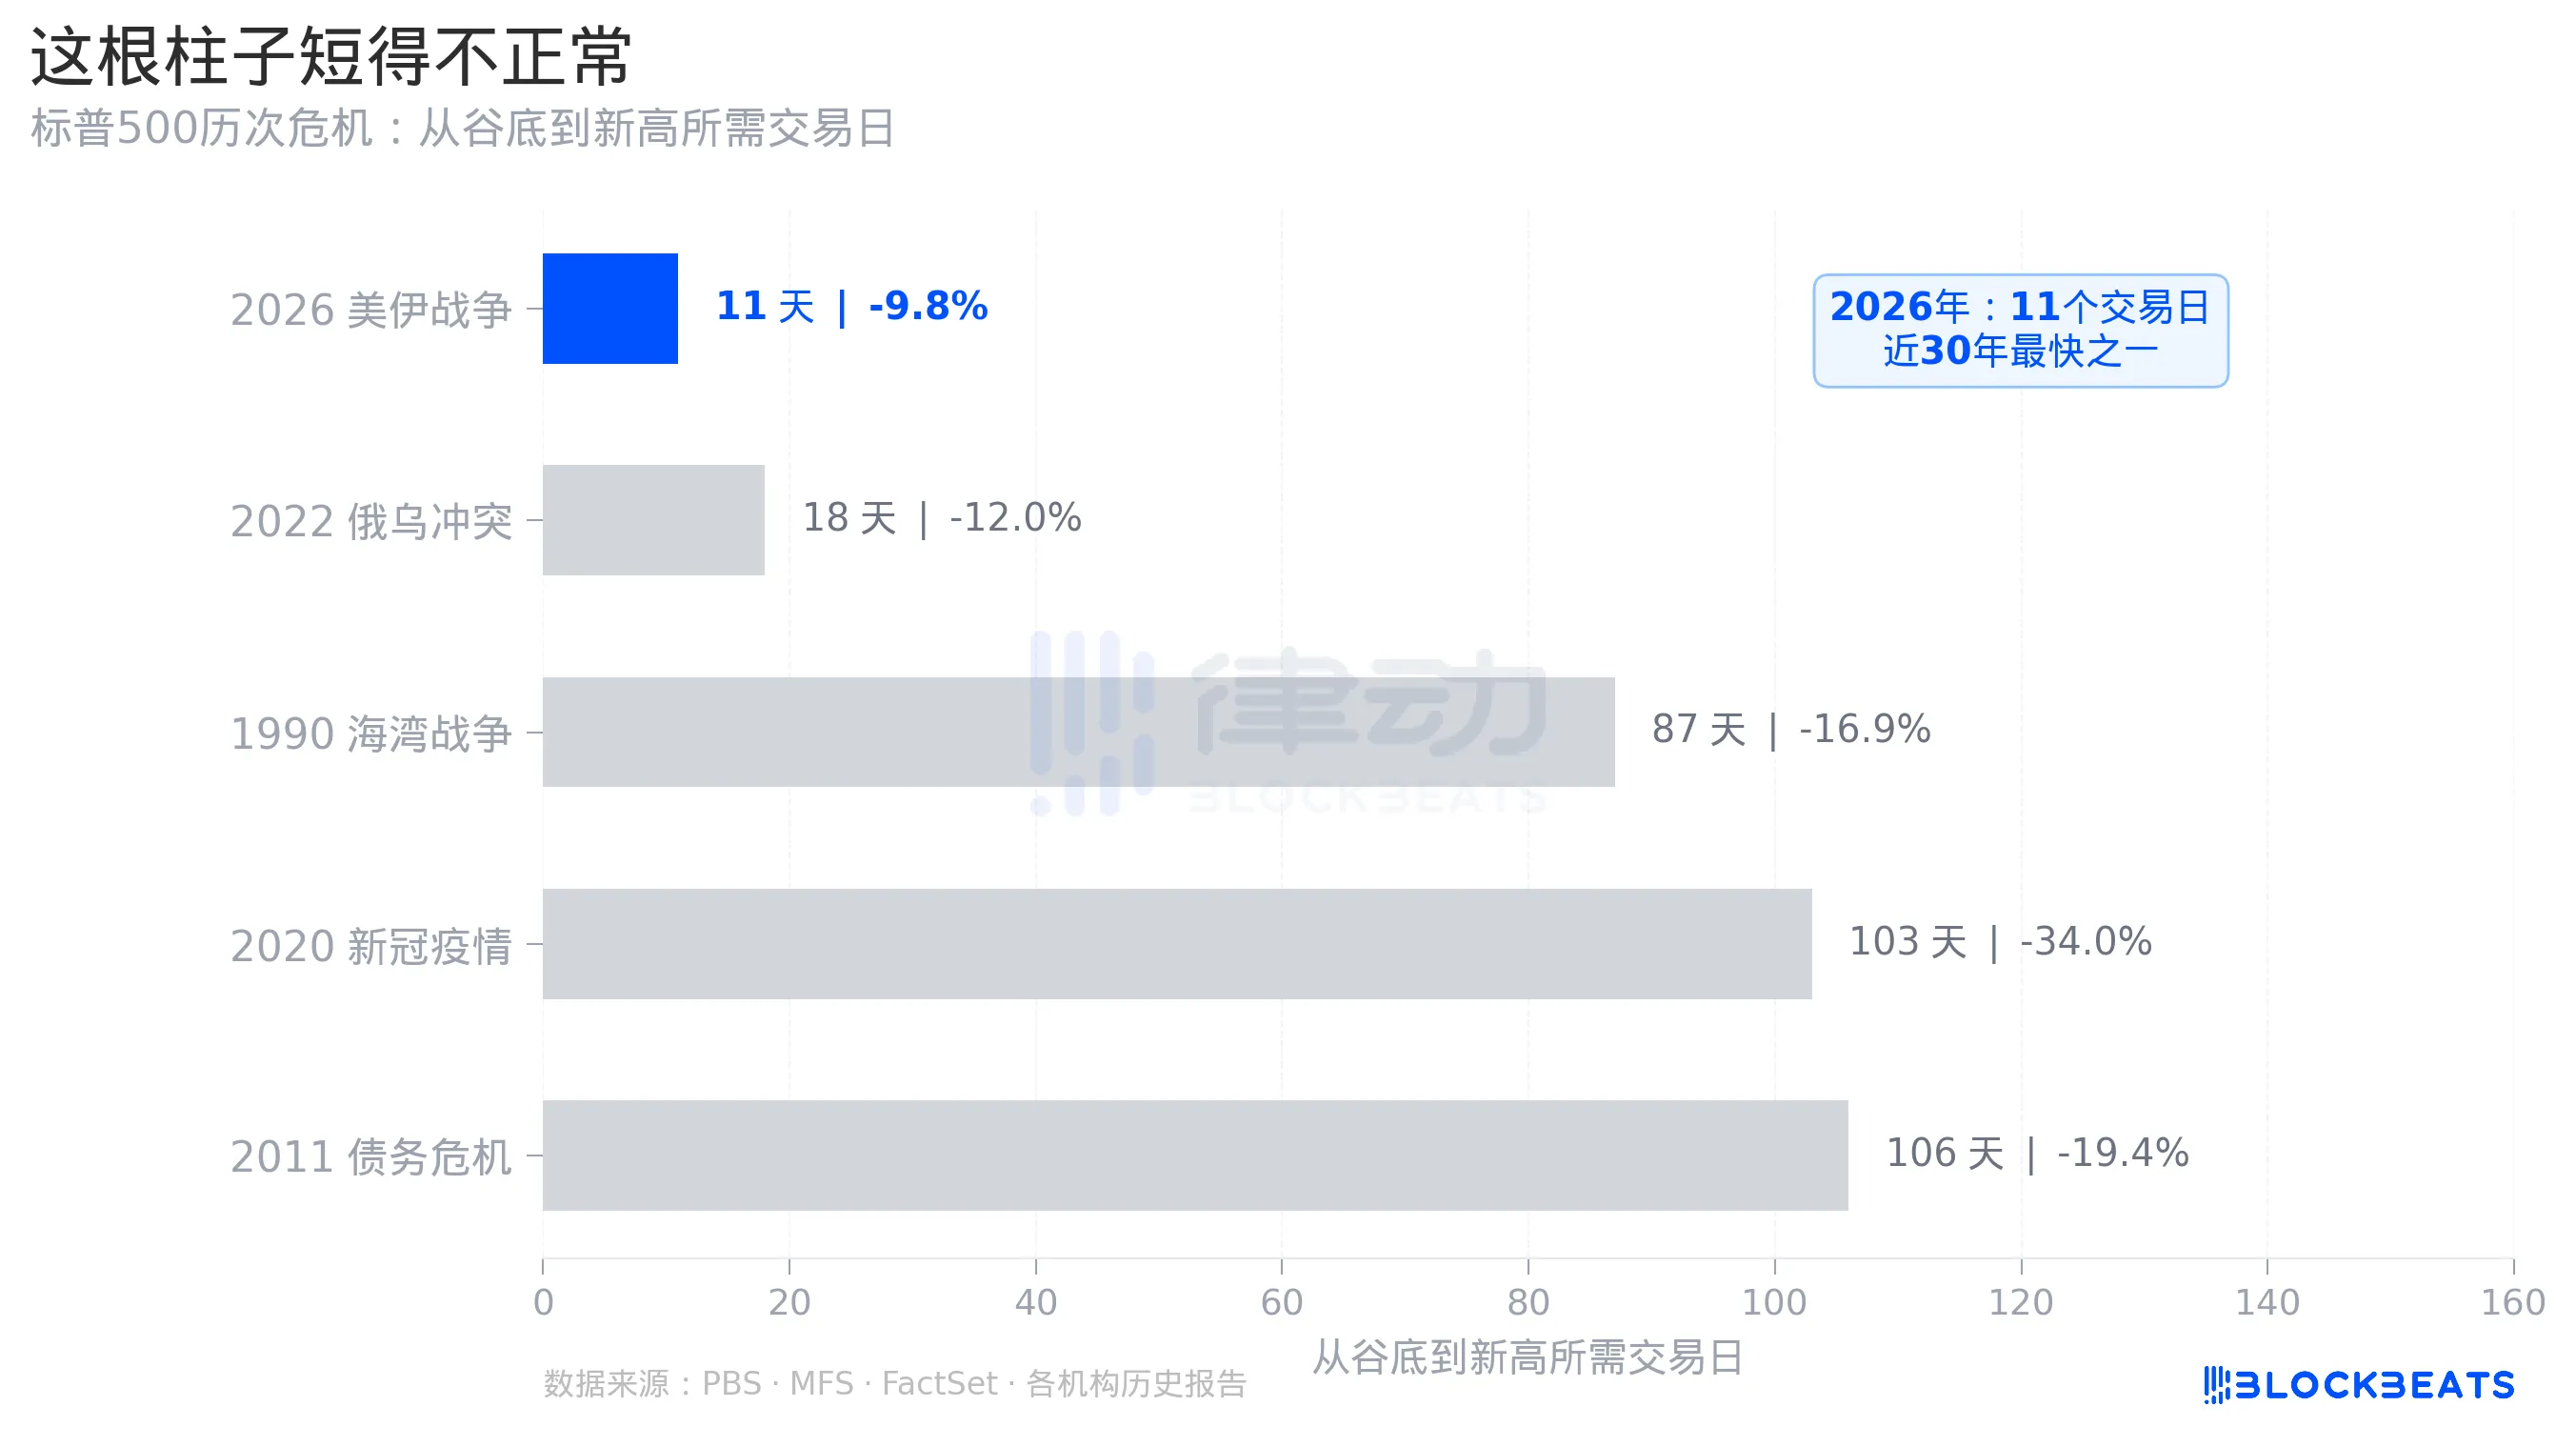
It should be noted that this correction's decline (about 10%) is far less than during the COVID period (about 34%) and in 2011 (about 19%). Even when comparing it to the similar decline of the 2022 Russia-Ukraine conflict, that recovery took about 18 trading days. 11 days remains an outlier.
The narrative of this correction has always been "expectations of a ceasefire," rather than "deterioration of economic fundamentals." The market falls due to uncertainty, not profits. When news of a ceasefire truly emerged, uncertainty pricing was rapidly erased, with no need to wait for quarterly reports to restore confidence.
The Word "Ceasefire," The Market Rose Twice
To understand the speed of this recovery, it is essential to clarify the news context.
On February 28, the US and Israel launched military strikes against Iran. The S&P 500 began to decline from its previous high of 7,002 points on January 28, dropping to 6,316 points by March 30, with a maximum decline close to 10%. By Wall Street’s definition, it was right at the edge of a "correction."
But during this decline, something strange happened. On March 24, rumors of the "potential reopening of the Strait of Hormuz" circulated in the market, and the S&P rebounded that day. This was the first instance of "ceasefire pricing." The rumor was subsequently debunked, and the market continued to decline.
On April 8, Trump announced a two-week temporary ceasefire on social media, and Iran accepted Pakistan's mediation proposal. The S&P 500 surged 2.5% in a single day. This was the second instance of "ceasefire pricing," with a higher price and almost the same reasoning.
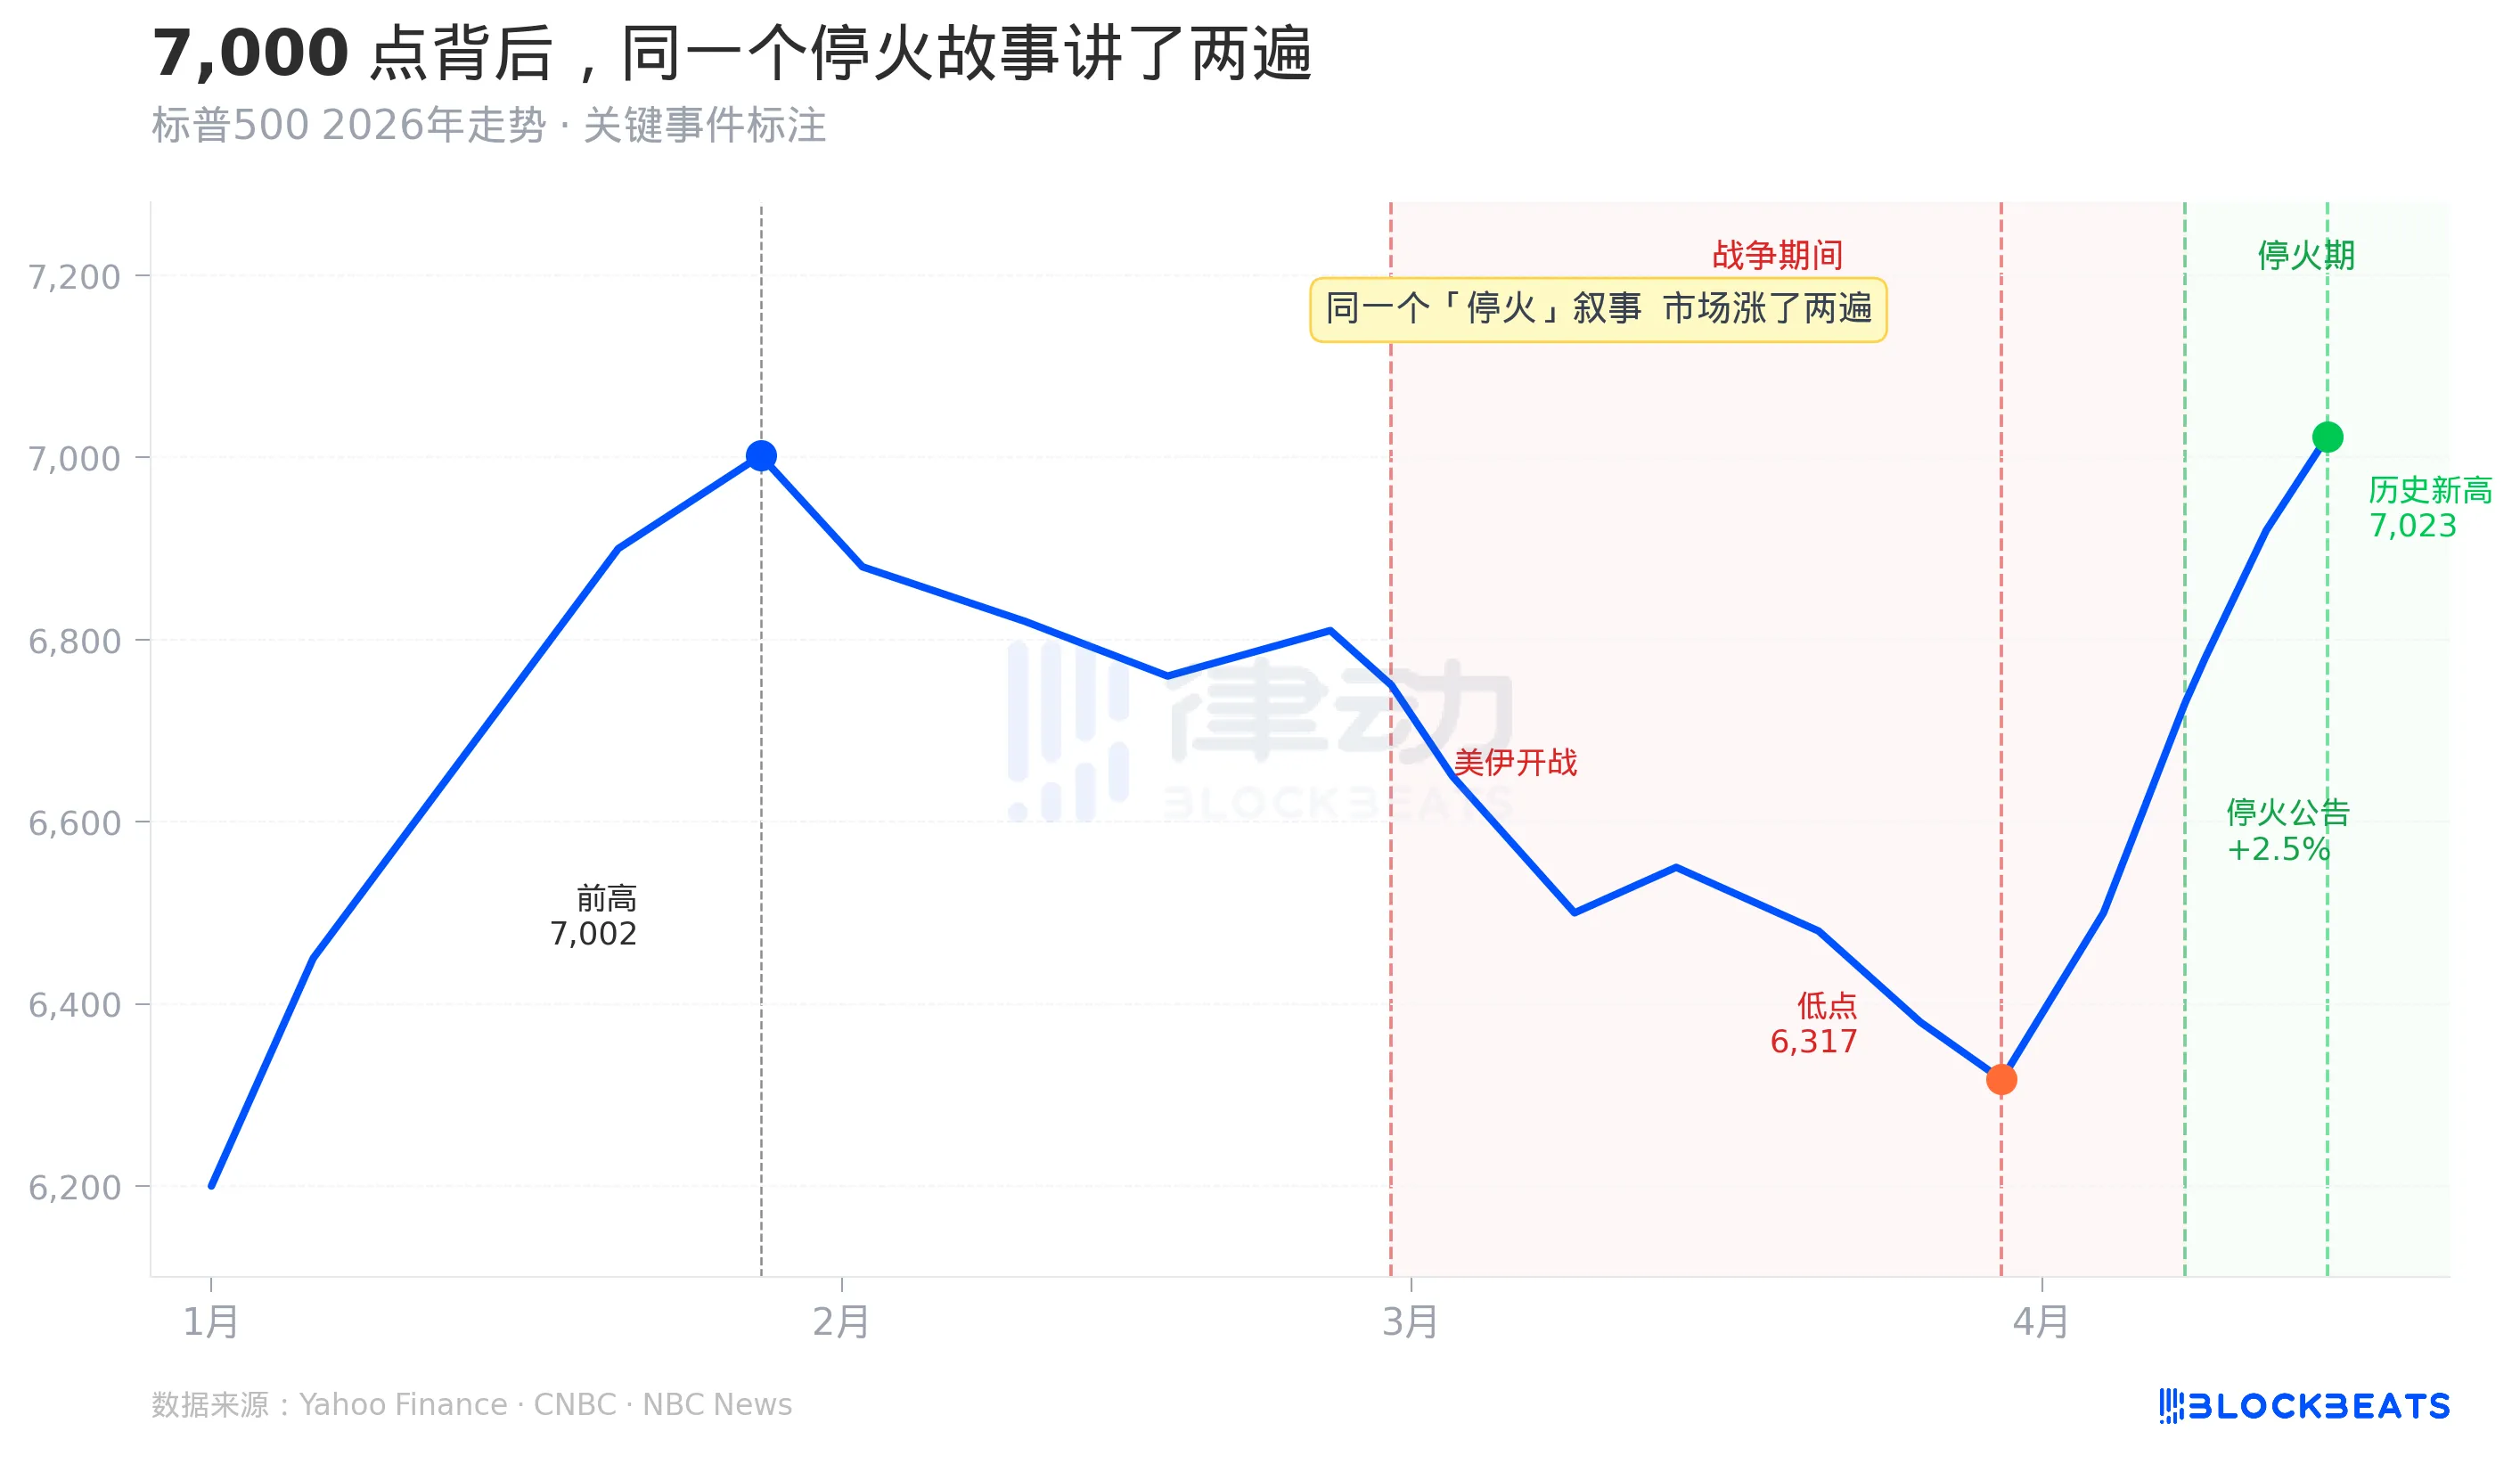
From Chart 1, it can be seen that the events associated with the two significant upticks are symmetrical, both indicating "increased possibility of a ceasefire." The market rose once, and then rose again. As of the historical high of April 15, the two-week temporary ceasefire agreement had not yet expired, and there was not a word signed on a permanent peace agreement.
What scenario is the market pricing? Not "the end of the war," but "the war could potentially end." This expectation has been priced in twice.
The Fear Index is Lower Than Before the War Started
Even more counterintuitive is the number for the VIX, the index Wall Street uses to measure market panic.
When the war started on February 28, the VIX jumped from around 16, reaching 35.3 during trading on March 9. This aligns with common sense: war brings risk, and the market must price in uncertainty.
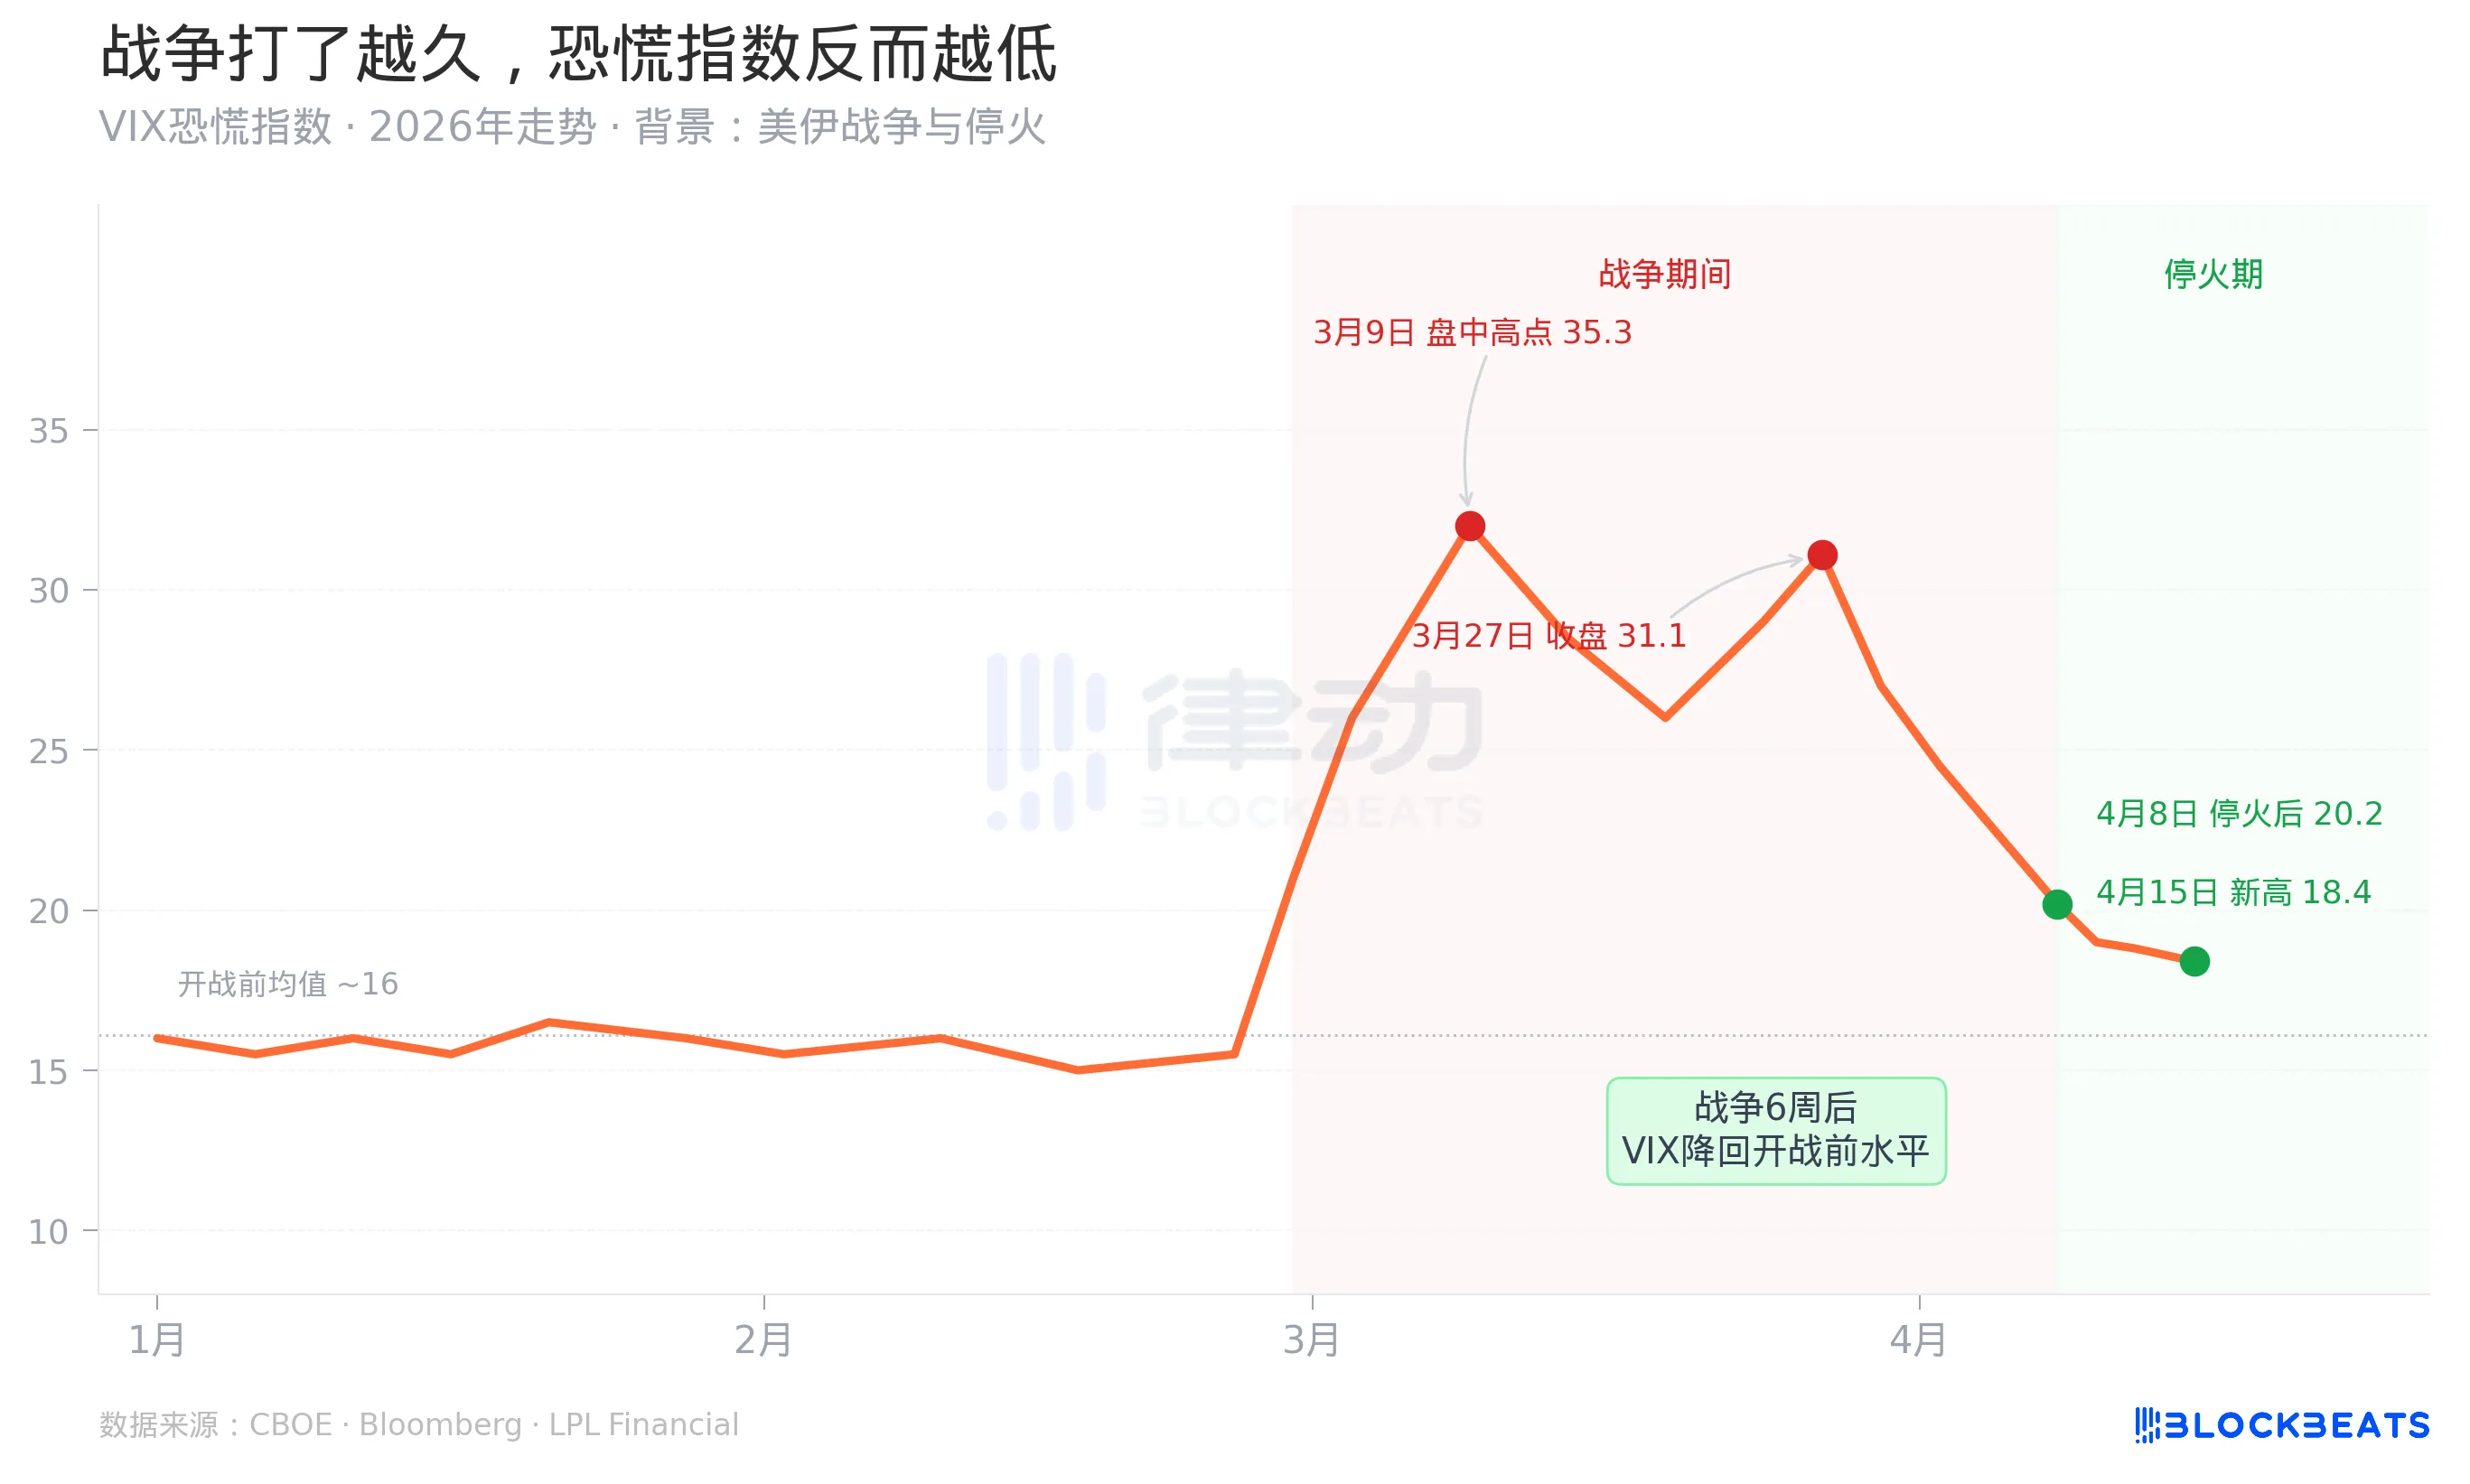
However, the subsequent trend defied common sense. Starting March 9, despite the ongoing war, rising oil prices, and the Senate voting on whether to authorize war powers, the VIX steadily declined. By April 15, the day the S&P hit its historical high, the VIX closed at around 18.4, lower than its level before the war began on February 28.
What does this mean? It means that the market has reclassified this war from being a "source of uncertainty" to a "calculable risk." Within six weeks, an ongoing war transitioned from being a "panic event" to "quarterly raw material."
This was achieved through a very specific financial mechanism. According to CNBC, JPMorgan's trading division saw revenues of $11.6 billion in Q1 2026, setting a record and increasing by 20% year-over-year. Among these, the fixed income division's revenue of $7.1 billion was primarily driven by trading in commodities, currencies, and emerging markets, which coincidentally are the areas where the Iranian War produced the most "volatility."
In other words, while ordinary investors felt fear, professional institutions were profiting from the volatility. The smoother this mechanism operates, the more the market tends to "digest" the war, causing VIX to decline faster.
Commercialization of Volatility
On April 15, the same day the S&P 500 set a new historical high, the Pentagon announced an increase of 10,000 troops in the Middle East, and the Senate rejected the war powers authorization bill for the fourth time. Both events occurred on the same day, and the market had no reaction to them.
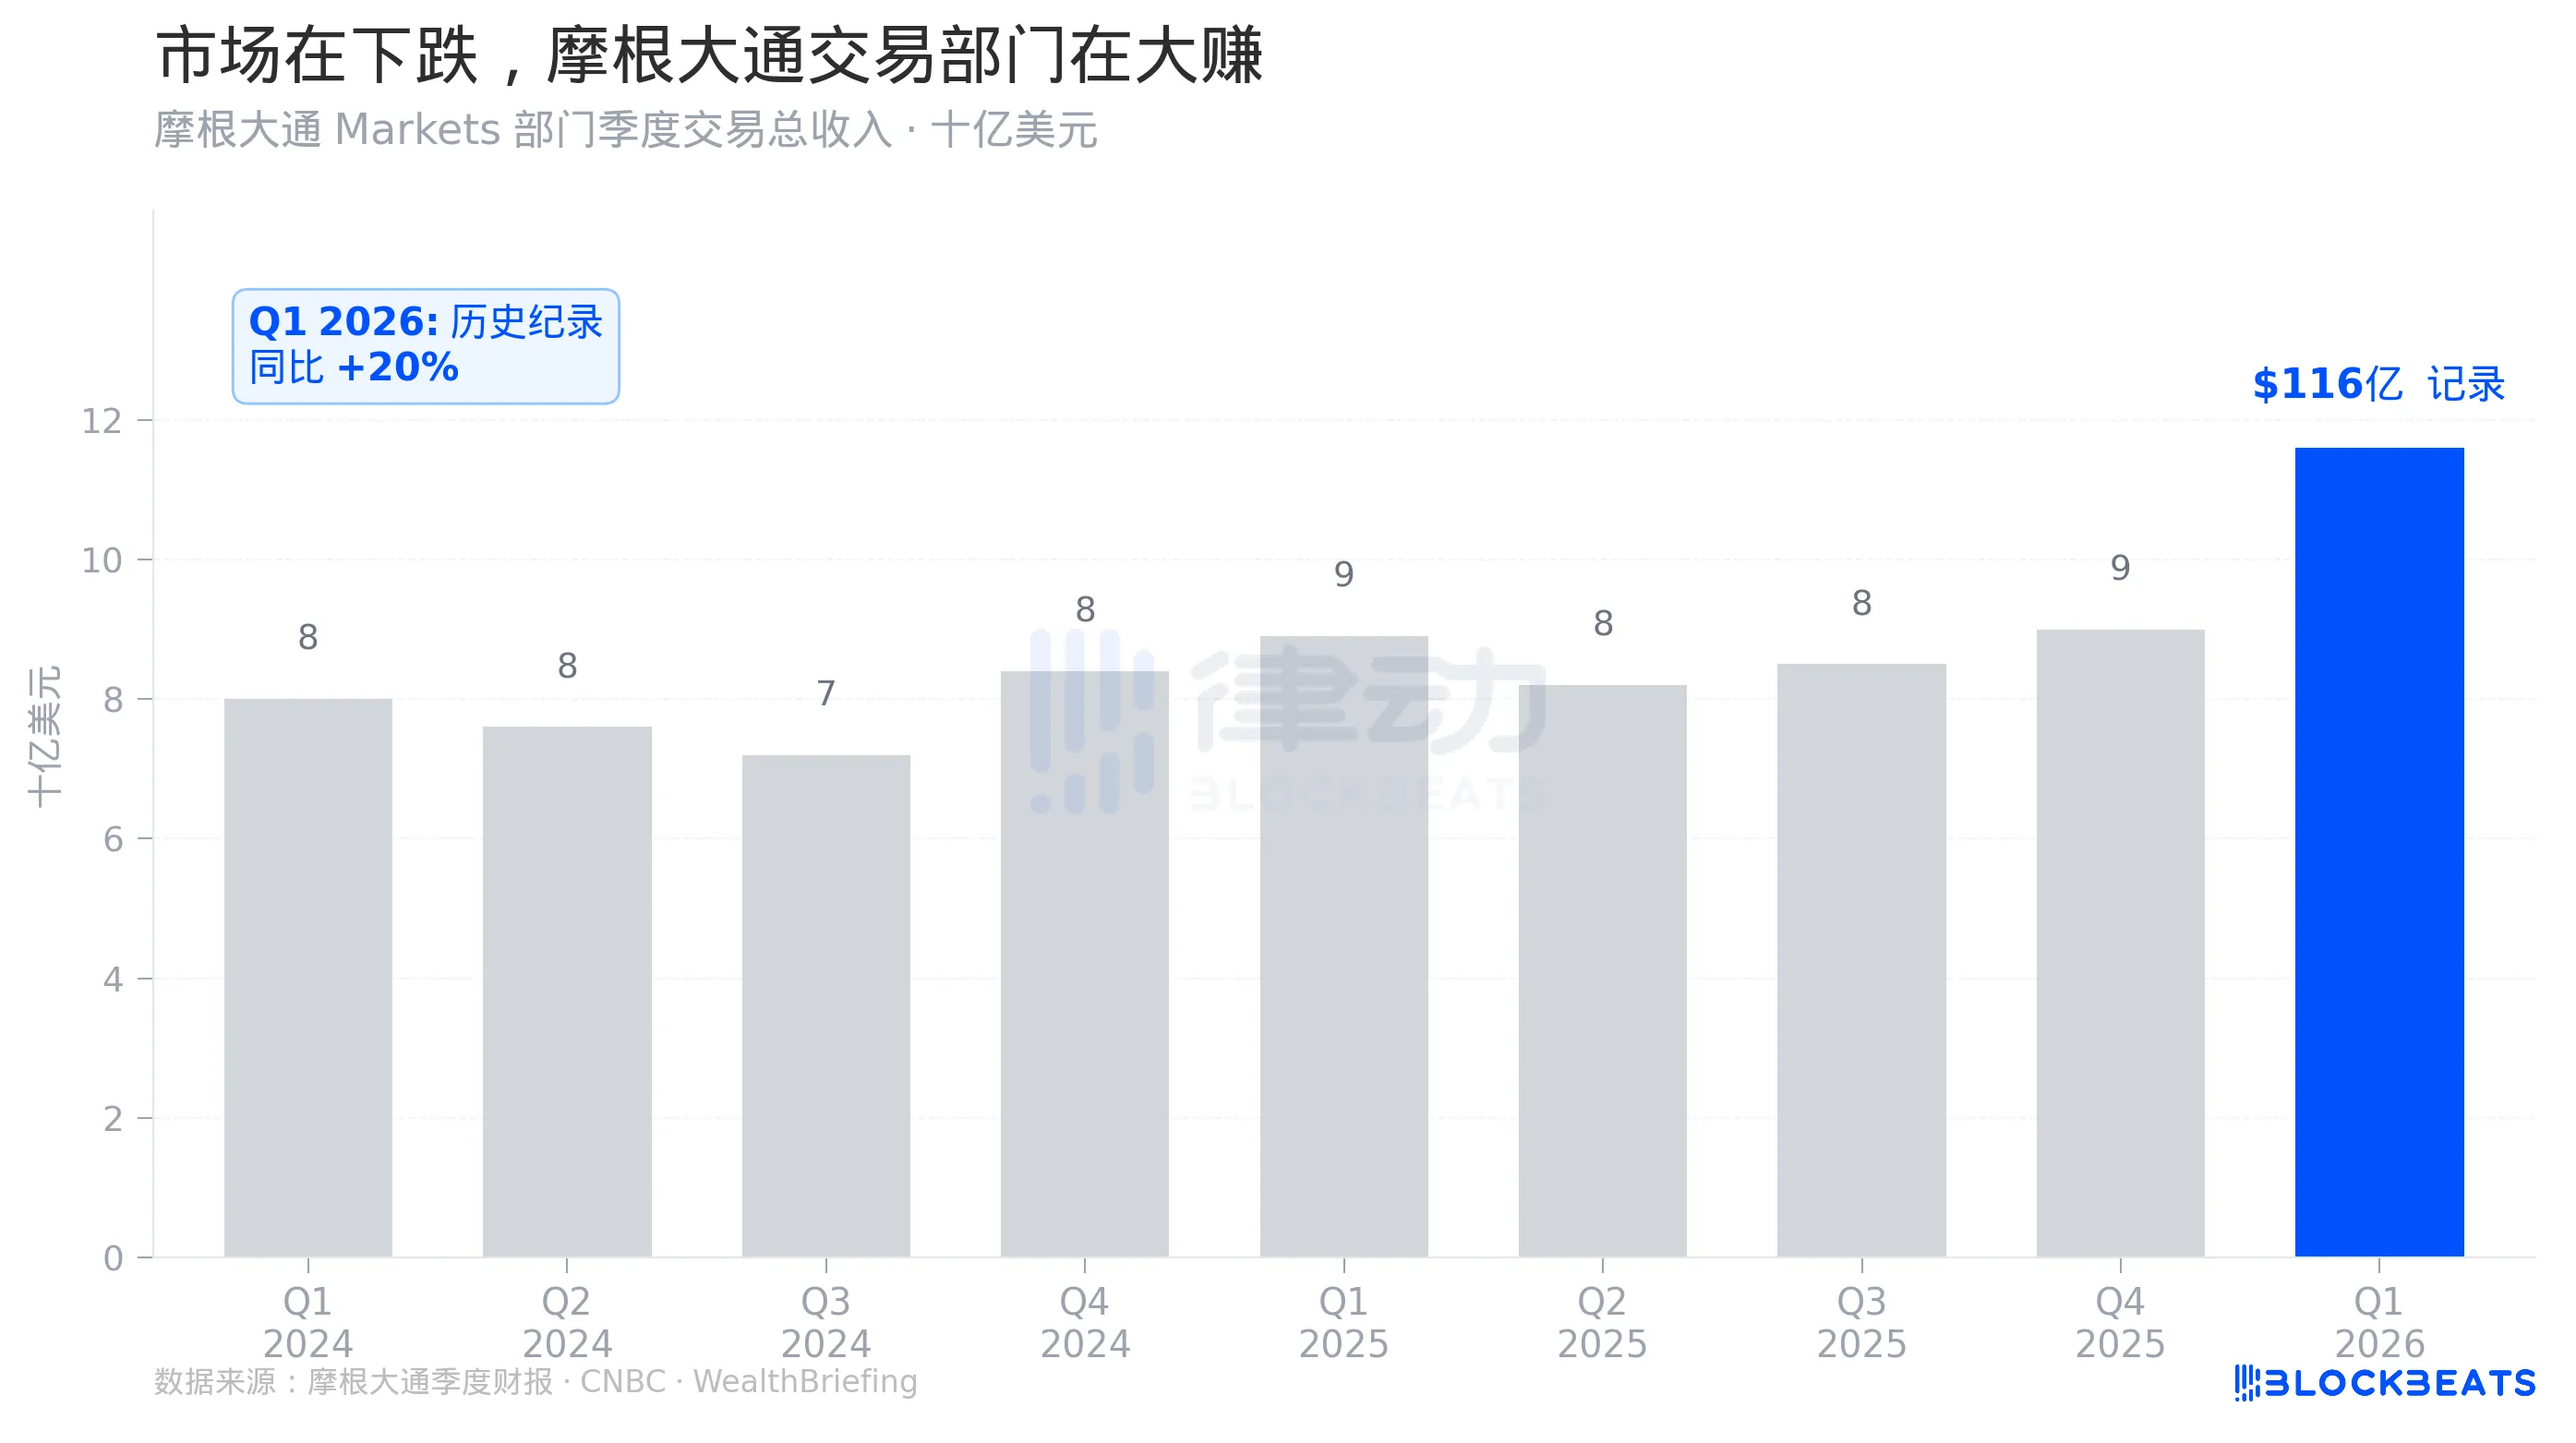
From Chart 4, it can be seen that JPMorgan's Q1 2026 trading income bars are significantly higher than those of the previous eight quarters. This is not a marginal improvement, but a leap.
Supporting this leap is the money earned by hedge funds and market makers from war volatility. According to Goldman Sachs Prime Brokerage data, as of April 14, US hedge funds had moved to a net long position for the first time since the end of 2025. At the same time, according to FINRA data cited by Atwater Malick, the balance of margin financing on US stocks hit a historical high of $1.28 trillion, a year-over-year increase of 36%.
Three signals appeared simultaneously: hedge funds shifted from short to long, leveraged funds reached record levels, and the market hit historical highs. This is a classic "trading with optimism" pattern.
Understanding this pattern requires looking at the layer of financial infrastructure. When Wall Street's market makers, derivatives markets, and hedge funds are sufficiently mature, geopolitical shocks are no longer unpredictable exogenous risks, but raw materials that can be priced, hedged, and commercialized. The Iranian War is not a threat to JPMorgan's trading division but an opportunity. The same applies to hedge funds that have positioned themselves correctly.
This is the true meaning of "two screens, two worlds" on April 15. The Pentagon is extending the war while the market is pricing in an end to it. These two things are not contradictory because for market makers, the duration of the war is irrelevant; what matters is the level of volatility.
Of course, this mechanism has its vulnerabilities. The new high achieved in 11 trading days is based on an assumption: that the two-week ceasefire will be smoothly extended, that negotiations on Iran's nuclear issue will progress as expected, and that oil prices will decline. If any of these assumptions go wrong, there is not much buffer in the current pricing. The $1.28 trillion in leveraged funds can also act as amplifiers during market downturns.
7,000 points is a price that holds only in the most optimistic scenario.
免责声明:本文章仅代表作者个人观点,不代表本平台的立场和观点。本文章仅供信息分享,不构成对任何人的任何投资建议。用户与作者之间的任何争议,与本平台无关。如网页中刊载的文章或图片涉及侵权,请提供相关的权利证明和身份证明发送邮件到support@aicoin.com,本平台相关工作人员将会进行核查。


