The cryptocurrency market's upward momentum is unstoppable. Around 22:00 Beijing time on April 14, the market launched another strong offensive. According to real-time market data, Bitcoin broke through the $75,000 mark, reaching a high of $75,985, showing very strong bullish momentum. Meanwhile, Ethereum also followed the market's trend, decisively breaking through the $2,400 level, peaking at $2,415.
The catalyst for this rebound is the U.S. blockade of the Strait of Hormuz and the signal for a second round of talks expected to take place tomorrow. Trump announced that a new round of negotiations will commence at 16:00 Beijing time on April 16, forcing shorts who had bet on pessimism to exit.
The outcome of the second round of U.S.-Iran negotiations on April 16 will directly determine the market's stance on the "peace talks premium." It is also important to note that any increase in the adversarial tone from either side could lead to a reversal in this already extreme market condition.
Looking at the Bitcoin 4-hour chart:
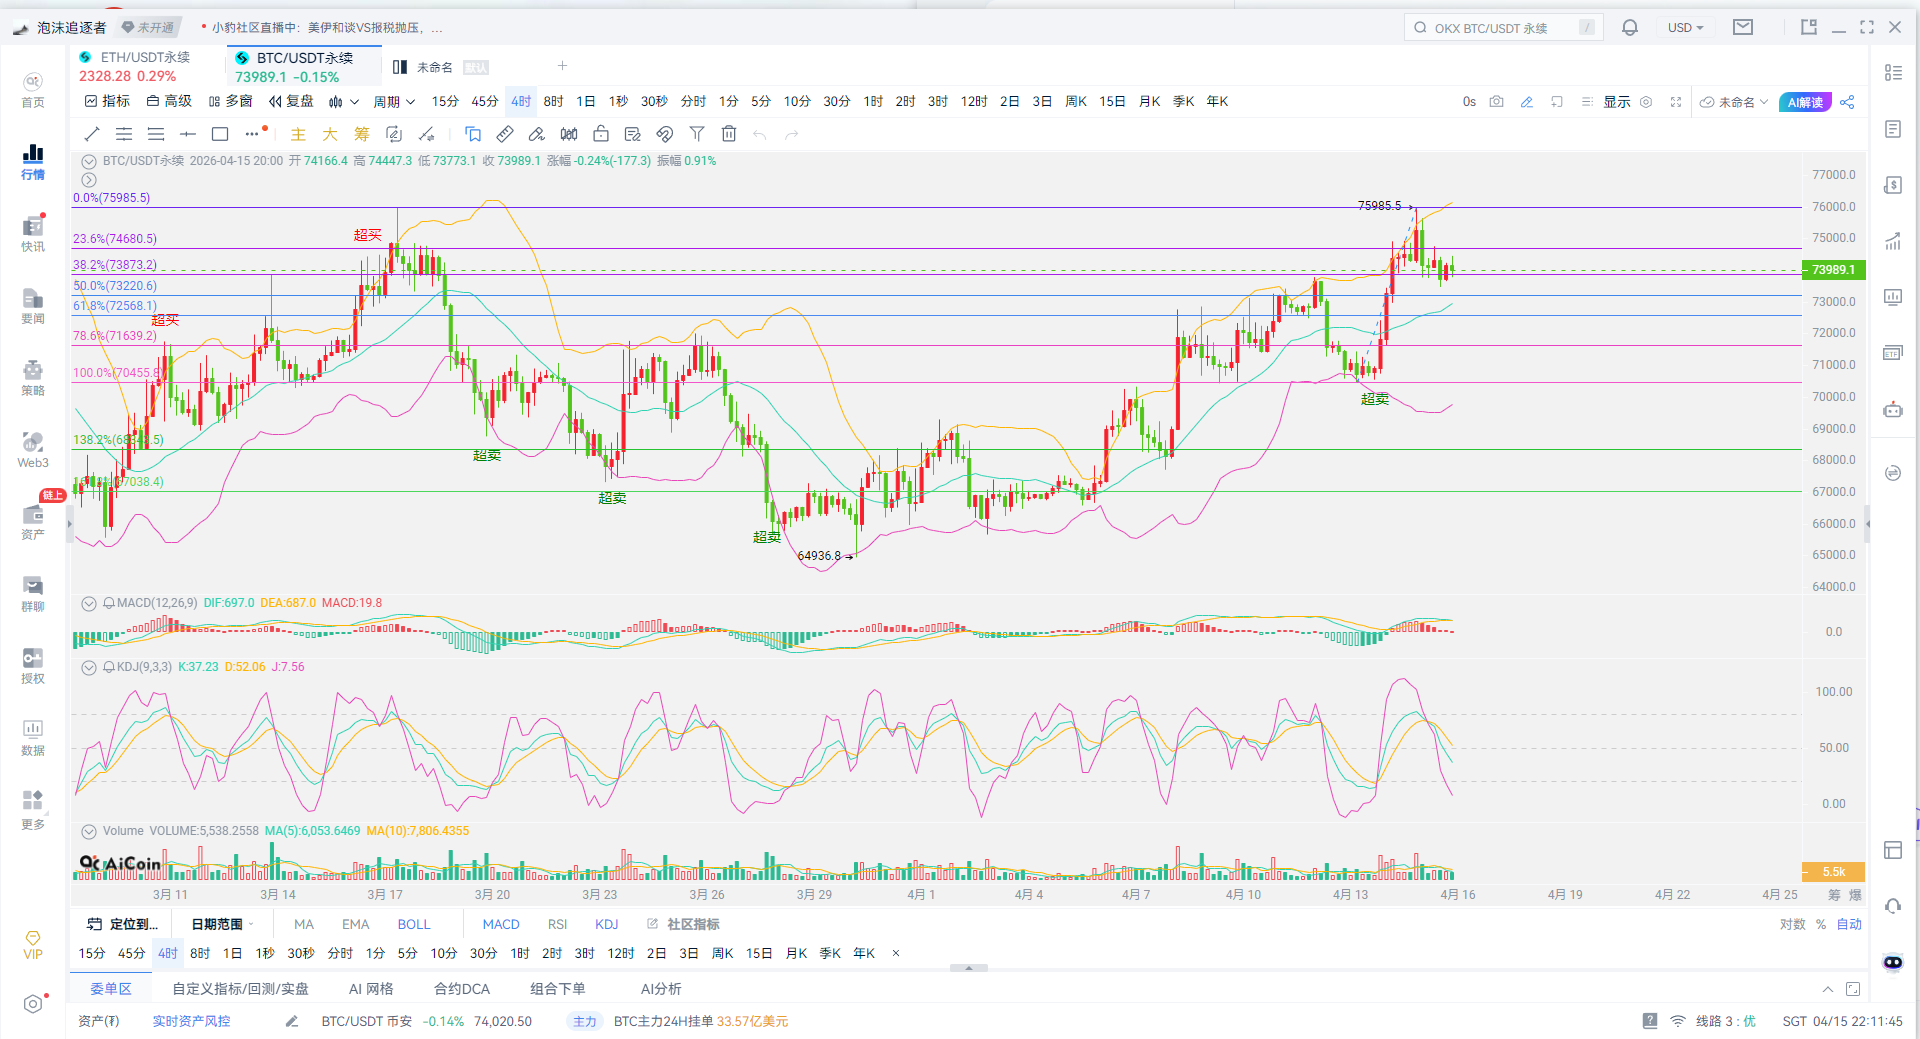
First, let’s look at Fibonacci. This wave rose from 64,936 to 75,985, with the current pullback around the 0.382 level, stabilizing near 73,800. This level has been tested multiple times without being broken, indicating it is genuine support. The upper 0.236 level, approximately 74,680, has already begun to be tested repeatedly. Structurally, this is a phase of strong retracement, preparing for a second attempt to push higher.
Second, look at the Bollinger Bands. The Bollinger Bands are opening upwards, with prices running close to the upper band. The upper band is continuously being touched, the middle band is moving up, and the lower band is distancing itself from the price. This indicates a clear strong bullish trend, not a sideways movement, but organizing within a stronger trend.
Third, look at MACD. The indicator is flattening above the zero axis, with bearish momentum waning. The DIF and DEA lines are still above the zero axis; although the red bars have shortened, they have not turned green. This indicates a weakening of upward momentum, but the overall upward trend has not been damaged. We are currently in a power accumulation phase, not at a peak.
Fourth, look at KDJ. KDJ has fallen back from a high dead cross and is currently approaching the repair area. The J value is rapidly descending. This implies there is short-term pressure to pull back, but it is close to the low repair area. Once the indicator forms a golden cross again, it may signal the start of a new round of upward movement.
My conclusion is: The essence of the current market situation is a technical pullback in an upward trend, combined with sideways accumulation. This is not a trend reversal.
Next, I will provide a judgment on the upcoming market trends.
The first scenario is the main trend, which continues to break upwards after a period of sideways movement. It is necessary to stabilize at the 73,800 level (0.382), then break through the 74,680 level (0.236), and once again challenge the previous high of 76,000. This is the path with the highest probability.
The second scenario is a washout trend, which means a false drop followed by a pullback. It may first fall below 73,800, pull back to the 73,200 (0.5) level, or even the 72,500 (0.618) level, and then quickly recover. This is a typical tactic to wash out long positions by the big players.
Key levels to remember: strong support at 73,200; trend dividing point at 72,500; short-term pressure at 74,680; strong resistance at 75,985.
The strategy of Xinghe is as follows: as long as the price does not fall below the 0.5 level at 73,200, maintain a long-only strategy. When it pulls back to the support level, you can buy in batches. If the price breaks above 74,680, you can increase your position. However, if the price effectively falls below 72,500, then stop and observe.
The final statement is clear: this is not a peak; this is a handover phase in the upward process. The real end of the trend will certainly occur when there is a significant breakthrough with high volume, not the current shrinking volatility.
Xinghe focuses on analyzing the cryptocurrency market, including spot and contract trading, values the market, makes rational decisions, and always adheres to a rigorous, objective, and compliant professional standard, committed to creating long-term value with professional capabilities!

(Article by/Xinghe Huicai) 2026-04-15 22:10
This disclaimer states: Online publications may have delays; the above suggestions are for reference only. Investing involves risks; please be cautious when entering the market!
免责声明:本文章仅代表作者个人观点,不代表本平台的立场和观点。本文章仅供信息分享,不构成对任何人的任何投资建议。用户与作者之间的任何争议,与本平台无关。如网页中刊载的文章或图片涉及侵权,请提供相关的权利证明和身份证明发送邮件到support@aicoin.com,本平台相关工作人员将会进行核查。