Original Title: "How Ordinary People Can Identify a Token Behind a Whale in 10 Minutes?"
Original Author: danny, cryptocurrency analyst
Many people study on-chain data to find out "Is there a whale behind this coin?", and then try various ways to avoid, embrace, or follow it. But the truth is—tokens without a whale will not rise at all. So the truly useful question is not "Is there a whale?", but rather "At which stage is the whale?"—Accumulation, Ramp-up, Distribution, or has it already run away?
First, let's state the conclusion: You can definitely find the whale because whales are everywhere.
This article provides you with a framework of signals both on-chain and off-chain. It's not about playing detective to catch the whales, but rather to help you quickly judge: at this moment, is this market in a stage friendly to retail investors?
1. On-chain Signals: What the Chips and Funds Are Saying
Remember: This version lacks funds and data, but what it lacks is willing funds coming into the market. Like all games, everything revolves around how to make you "pay to recharge." As long as you keep your attention, there are thousands of memes and faces, there’s always one that suits you.
1: Chip Concentration—Combine Related Wallets to Calculate, Concentration is Not Important, the Degree of Concentration is Important
Don't just look at the "Top 10 Holders' Percentage," which anyone can see and is easily disguised—if a whale splits their coins into 50 wallets, each holding only 1%, the Top 10 looks "healthy." The correct practice is to open a professional tracking software to view the bubble chart and consolidate addresses that are connected (have a direct transfer relationship). If three wallets each holding 2% have transferred funds to each other, that’s the equivalent of one person holding 6%. Also look at the buying time of these related addresses—if they concentrate on the same day or even within the same hour, ask yourself, do you believe in coincidences?

Funding Source Trace (Funding Wallet Analysis)—Where did these wallets’ initial ETH/BNB come from? If the gas fees for 50 wallets come from the same CEX withdrawal address or the same funding wallet, even if there have been no direct transfers, they are most likely the same person.
If someone spends money to collect, what do you think they want to do?
2: Transaction Volume Authenticity—Vol / Holder (OI) Number
24-hour transaction volume ÷ total number of holders = average transaction amount contributed by each holder. If a coin has only 800 holders and a transaction volume of USD 2 million in 24 hours, the average per person is USD 2500—this is highly likely a few addresses crazily wash trading, or bots acting. Why would someone spend money to wash trading volume?
Then calculate the overall network’s vol/holder, as well as the vol/holder ratio of the top 3 trending tokens.
3: DEX Liquidity Pool Monitoring
Observe LP (liquidity pool) increase or decrease—whales withdrawing LP or thickening LP is a signal of running away or acting. If LP is unlocked or about to expire, the risk is extremely high. Also observe changes in LP depth; if the price is rising but LP depth is thinning, it indicates the whale may be quietly pulling liquidity to reduce their own losses when preparing to run, and vice versa.
Then compare the LP situation and thickness of the top 5 trending tokens.
4: Turnover Rationality—24h Vol / Market Value
Measure "what percentage of market value has been traded in a day." Look at it broken down by hour; if there are specific hours where the trading volume suddenly spikes far beyond other periods, it indicates someone is concentrating on washing volume. Normal retail trading time distribution is relatively smooth; sudden spikes are likely the prelude to manipulation. Additionally, it’s more valuable to look at net buy volume (net buy volume) rather than total transaction volume.
Then calculate the overall network’s vol/holder, as well as the vol/holder ratio of the top 3 trending tokens.
5: Number of Transactions vs Transaction Volume—Proportion of Large Orders
Look at the average amount of each transaction within 24 hours. If the top 10% of large transactions account for over 60% of the total transaction volume, this market is driven by a few addresses, and price movements completely depend on these addresses. (A better method is to use the Gini coefficient to quantify the concentration of transaction amounts, from 0 to 1, the closer to 1, the more concentrated). When these addresses do not move, it is more important than when they do.
Then calculate the overall network’s vol/holder, as well as the vol/holder ratio of the top 3 trending tokens.
6: Address/Account/OI Growth Rate vs Price Change Rate—Judging Which Phase the Whale is In
Combine calculations from the previous 5 indicators (be sure to process, screen, and calculate), and combine with data analysis to determine which stage the asset is currently in?
· Accumulation Stage: Price remains low or even slightly decreases, large on-chain addresses are slowly buying, and there are not many changes in wallet/account numbers. The whale is quietly collecting chips. (We don’t count those related addresses here~)
· Ramp-up Stage: For instance: if the price rises 30%, but wallet/account numbers only rise by 5% → the chips aren’t spread out, and only a few people are lifting and acting.
· Distribution Stage (Most Dangerous): Price remains stable or slightly declines, but wallet/account numbers increase (sometimes also reflected in long/short ratio) by 20% → the whale is slowly distributing at a high position to retail investors, making it look like "the community is growing," but in reality, the whale is retreating.
· Runaway Stage: Price drops, and wallet/account numbers remain unchanged → retail investors are trapped, and the whale has fully distributed.
2. What Comes Next?
Alright, you’ve taken the time to confirm there’s a whale and are still in the xxx stage. Then what? Change to another? If you switch again, there’s still a whale. Because—
3. The Whale is Not a Bug; The Whale is the Underlying Structure of This Game
Why does a Token rise? It takes two things to raise a price: chips + funds. When these two things come together, it’s called pricing power. If the chips are not concentrated and the interests are insufficient, no one will have the incentive to raise the price.
Chip concentration is not a conspiracy; it is a prerequisite for a price rise. No whales, no market.
4. How Whales Win Against You
Pricing power is just a ticket to enter. What truly allows whales to consistently win is that their trading methods are completely different from yours. You rely on intuition; the whale relies on a system.
· Whales’ Cost Awareness: They calculate the profit of ramping up and distributing, and do it when the EV is positive. Retail investors rely on screenshots.
· Whales’ Probability Thinking: They continuously adjust probabilities and positions. Retail investors repeatedly bet.
· Whales’ Psychological Manipulation: They create FOMO and use sunk cost to make you hold on.
· Whales’ Tool Advantage: They can hedge, have cost/information advantages, and their operational dimensions and room for error crush retail investors.
5. So How Do Retail Investors Win?
In the whale’s home turf, under the whale’s rules, retail investors cannot win. Information, tools, and psychology are fully asymmetric. But there is a form of asymmetry here that can be broken.
6. The Greatest Structural Defect for Retail Investors: They Can Only Long
Without perpetual contracts, whales can indeed only long, but they do not need to short. The reason lies in costs.
The cost of a whale's chips is low enough to be close to zero (gas fees or extremely low early prices). Even if they fall 90%, they are still profiting, just "making less." Extremely low costs give them a great margin for error.
Conversely, retail investors enter the market at FOMO stages with costs potentially 50 times that of the whales. Your cost structure determines you cannot withstand drawdowns. Retail investors do not have shorting tools or low-cost safety nets. The only scenario for them to make money is: Buy and ride the price up, and then sell before it drops.
One direction, one window, with nearly zero margin for error. This is structurally unfair.
7. What If Retail Investors Could Short? This is the Meaning of youcanshortit.com Existence
When signals point to the distribution stage and false prosperity—you're not just "rushing to run away"; you can short, turning the whale's distribution into your profit. When the truth returns, you can stand on the profitable side. Your analytical abilities will finally no longer be wasted.
8. Mechanism Insight: With Shorting Power, Can Retail Investors Master Pricing Power?
Directly stating the conclusion: No.
The formula for pricing power is always: chips + funds. Retail investors inherently are a group with dispersed funds, fighting separately. No mechanism, no matter how clever, can turn a pile of loose sand into a cannon. But introducing decentralized spot leverage and lending protocols like youcanshortit.com is not to make retail investors "act as whales," but to break the whale's "absolute monopoly" over pricing power.
Decomposing from a mechanism standpoint, it reshapes the structure in three dimensions:
Creating "sell orders" out of thin air, stripping away unilateral control over the market
In a pure spot market, if the whale does not sell, there is no selling pressure; they can simply shift from one hand to the other to raise prices. However, when shorting mechanisms intervene, retail investors can lend tokens with excessive collateral to flood the market, and those originally "locked" dead chips become active selling pressure. This forces the whale's ramp-up to carry real funding costs. If the whale wants to keep pushing prices, they must shed real money to fill the orders created by shorts.
2. Price Discovery Symmetry: Piercing Through "False Narratives"
Previously, when retail investors discovered a whale's distribution or narrative was falsified, they could only "not buy," and negative news could not reflect in the decline. The shorting mechanism allows retail investors to transform "negative information" into substantial sell orders, making price movements no longer a game directed solely by whales but rather the real outcome of long-short competition.
3. Transition from "Chicken" to "Hunter"
The shorting platform actually accelerates the lifecycle of meme coins. This mechanism does not allow you to become a rule-making whale, but it transforms retail investors from "only getting beaten" to "hunters with guns."
9. But Shorting is Not a Universal Cure—Risks You Must Understand
Shorting meme coins carries extremely high risks, with theoretical losses having no upper limit. What whales are best at is causing short squeezes. They intentionally drive prices up to trigger a short squeeze, using your liquidation funds to further push prices up. If the timing is wrong, even if you're right on direction, you will still lose. Moreover, with poor liquidity and high slippage, shorting costs can also be very high.
Shorting is not "you can earn just by understanding"; it gives you a choice for another direction. You still need to control your position and set stop-losses. Shorting changes you from a "chip" to a "player," but players can also lose—just more honorably.
In Conclusion
This article does not teach you "how to avoid whales," but rather helps you understand:
Whales are everywhere; don't look for "bear-free coins," the key is to judge which stage the whale is at.
The biggest disadvantage of retail investors is the singular direction. Whales have low-cost safety nets, you do not. Understanding rises allows you to profit, while understanding falls only lets you run away—that's unreasonable.
Shorting power is the last puzzle piece for retail investors to move from "being harvested" to "joining the table."
It is a weapon, not a talisman. Even if this gun has a risk of blowing up, having a gun and not having one is a completely different level of gaming. What we need to do is achieve "equal armament," allowing retail investors to short.
One more thing
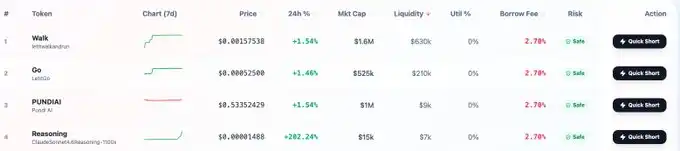
If you are excited to dive in after reading this, youcanshortit.com might have suitable tokens for you to practice with.
For example: (on Bnbchain Pancake swap)
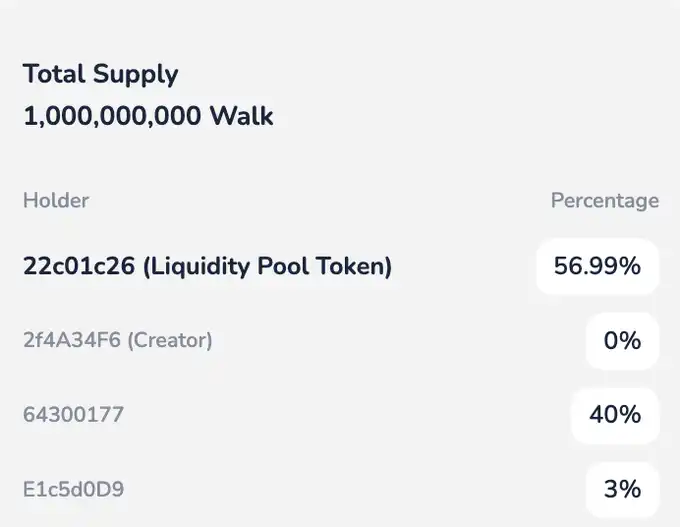
WALK (ca:0x9234e981e395dA3BE7b00B035163571698f8f756)
Current market cap is 1.6m
Chip Structure:
57% Pancake liquidity pool (v3)
0% Creator (Dev)
40% in youcanshortit.com vault (for borrowing short)
3% Pancake liquidity pool (v2)
Note: Trading is risky, please proceed with caution. DYOR.
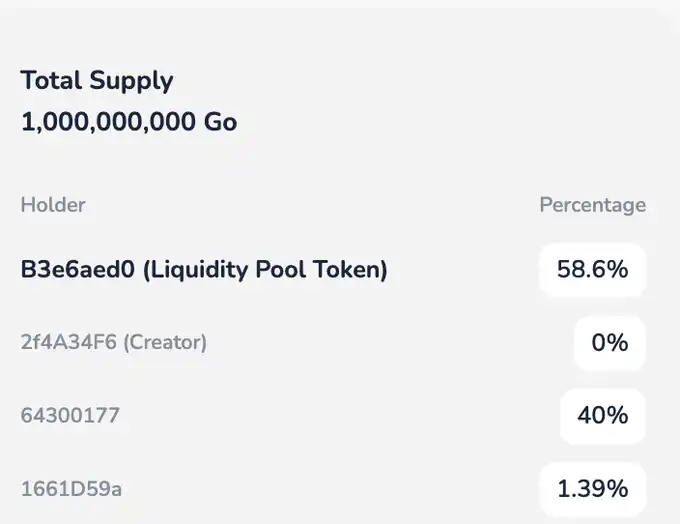
Go (ca:0x0a5D8c6D776A5903Bc568f41aADEeb4c71D2FFba)
Current market cap is 550k
Chip Structure:
58.6% Pancake liquidity pool (v3)
0% Creator (Dev)
40% in youcanshortit.com vault (for borrowing short)
1.4% Pancake liquidity pool (v2)
No matter if you want to seize pricing power, experience harvesting whales, play as a whale, or take part in a unique community experiment, let us experience together the offensive and defensive transitions from "chicken" to "hunter" this time~
Give everyone 72 hours to prepare~
Note: Trading is risky, please proceed with caution. DYOR.
免责声明:本文章仅代表作者个人观点,不代表本平台的立场和观点。本文章仅供信息分享,不构成对任何人的任何投资建议。用户与作者之间的任何争议,与本平台无关。如网页中刊载的文章或图片涉及侵权,请提供相关的权利证明和身份证明发送邮件到support@aicoin.com,本平台相关工作人员将会进行核查。


