Welcome to the Qinglan Crypto Class, I am Sister Qinglan. Today we will use the TPV three-point verification system to analyze the market thoroughly, filled with practical insights!
Step One: First Look at the Big Picture (Multi-Period Trend Overview)
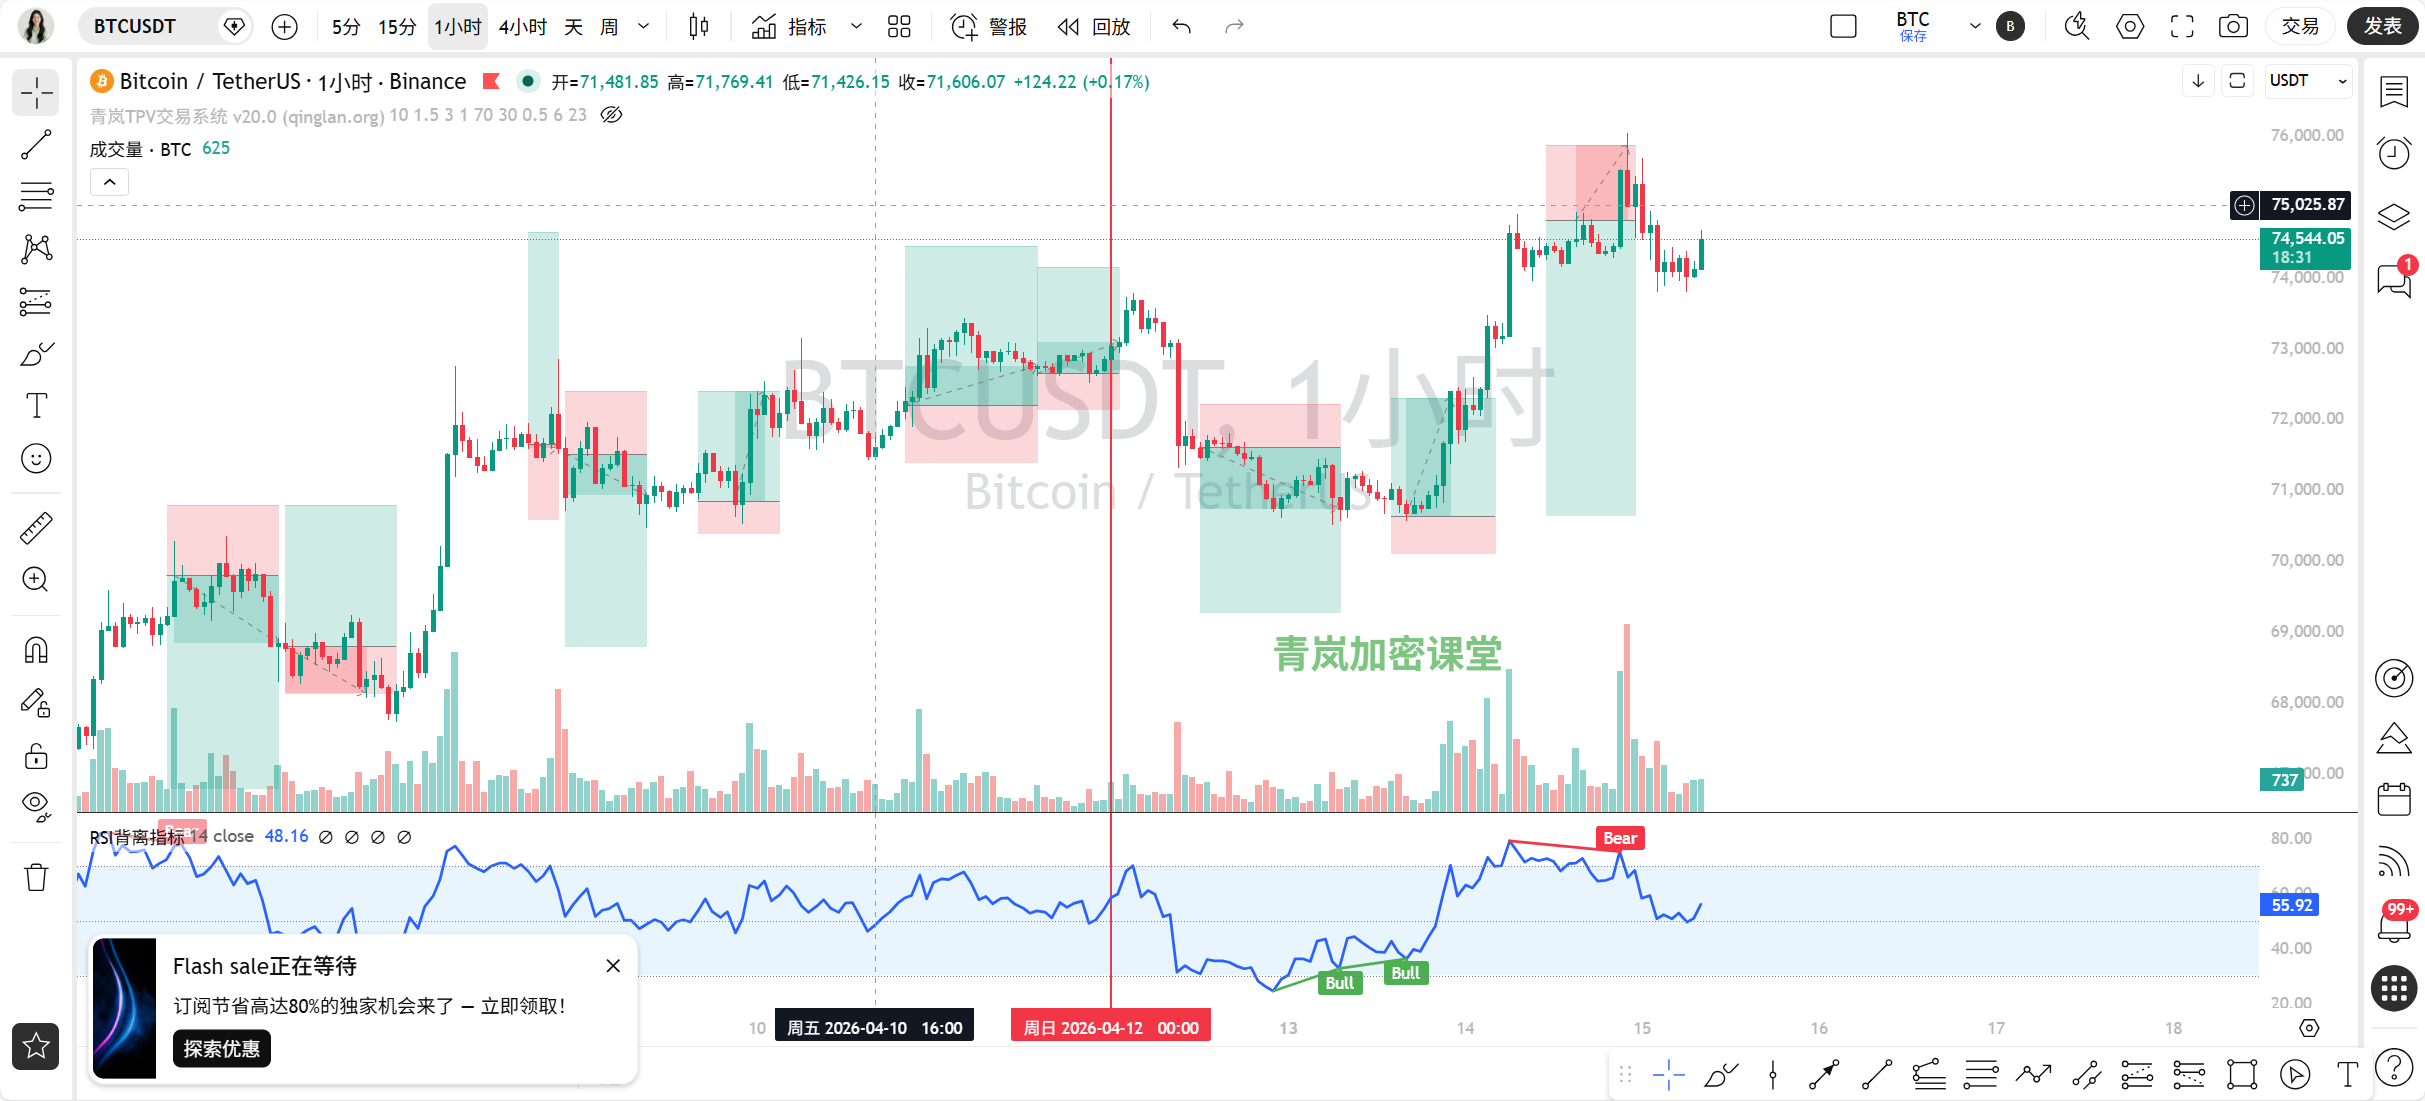
Daily Time Frame: The trend is upwards, and the moving averages are in a bullish arrangement, with MA5 at 73375.93, MA10 at 72347.82, and MA30 at 69988.79. The current price is at 74545.99, near a recent high. Key resistance is at the recent high of 76038.0, and support is at the recent low of 70505.88. The on-chain Fear and Greed Index is only 23, indicating extreme fear, but the long-term trend is strong, which suggests a divergence between market sentiment and price movement.
4-Hour Time Frame: The trend is also upwards, with moving averages in a bullish arrangement, MA5 at 74518.86, MA10 at 74119.21, and MA30 at 72724.40. The current price of 74545.99 is near MA5. Resistance is at the high of 74924.64 and support at the low of 74126.32. The long-term is strong, but the short-term sentiment is fearful, caution is needed for a pullback.
1-Hour Time Frame: The trend is oscillating, with moving averages intertwined, MA5 at 74216.03, MA10 at 74411.47, and MA30 at 74359.05. The price is entangled around the moving averages. Resistance is at the high of 74677.19 and support at the low of 73795.47. This period reflects the current indecision the most.
15-Minute Time Frame: The trend is oscillating, with moving averages intertwined, MA5 at 74388.19, MA10 at 74204.81, and MA30 at 74274.26. The price is weaving up and down within the moving averages. Resistance is at the high of 74606.0 and support at the low of 74126.32. The news mentioned ETF net outflows and miner sell-offs, which may have exacerbated short-term volatility.
Step Two: Find the Support Points, Draw Key Lines (Effective Highs and Lows + Trend Lines)
Daily Effective High: 76038.0 (the highest price in the 1-hour time frame on April 15, confirmed by subsequent prices).
Daily Effective Low: 70505.88 (the lowest price in the 4-hour time frame on April 15, confirmed by subsequent prices).
4-Hour Effective High: 74924.64 (recently touched and then fell back).
4-Hour Effective Low: 74126.32 (recently tested multiple times without breaking).
1-Hour Effective High: 74677.19 (recent high).
1-Hour Effective Low: 73795.47 (recent low).
15-Minute Effective High: 74606.0 (recent local high).
15-Minute Effective Low: 74126.32 (in resonance with the 4-hour support).
Draw an ascending trend line connecting the 4-hour low of 74126.32 and the 1-hour low of 73795.47 (approximately), with the current price above it. The news “Bitcoin breaks through $76,000” and “short-term breaks below $74,000” correspond with testing in these support area.
Step Three: Indicators to Assist (Technical Indicator Verification)
Daily MACD: DIF is 1298.39, DEA is 701.53, histogram is 596.86, crosses upward after a golden cross, showing strong momentum. RSI is 69.97, close to overbought but not extreme.
4-Hour MACD: DIF is 830.23, DEA is 657.60, histogram is 172.63, crosses upward but the histogram is shortening, momentum may weaken. RSI is 74.10, already in the overbought area, be careful of a pullback!
1-Hour MACD: DIF is 238.17, DEA is 385.19, histogram is -147.02, this is a death cross state, momentum is bearish. RSI is 52.12, neutral.
15-Minute MACD: DIF is -22.00, DEA is -100.11, histogram is 78.11, below the zero axis but the histogram has turned positive, indicating signs of weak rebound. RSI is 60.57, slightly strong neutral.
Verification: The large-period indicators support upward movement, but the 4-hour RSI is overbought and the 1-hour MACD is in a death cross, confirming short-term adjustment pressure. There is indicator support around the key low at 74126.32.
Step Four: Contest Between Bulls and Bears (News + On-Chain)
News:
Bullish: Goldman Sachs applies for Bitcoin ETF, institutional accumulation, analysts bullish, Federal Reserve interest rate cut expectations.
Bearish: Bitcoin ETF net outflows of 3539 BTC, miner sell-offs, Russia strengthens regulations, Middle East situation may delay interest rate cuts.
The core factor is the game between ETF fund outflows and macro interest rate cut expectations. There is somewhat of a divergence between technicals and news: prices are rising while funds are flowing out, indicating fearful sentiment.On-Chain Data:
Fear and Greed Index is 23, indicating extreme fear! This severely diverges from the market price reaching new highs.
BTC Dominance is 57.39%, with no changes in data provided, but the high proportion shows that funds are still focused on Bitcoin.
Total Market Cap is 2.601 trillion, with 24-hour change of +0.21%, a slight increase.
The on-chain data and price movements are clearly diverging, with extreme fear in sentiment but prices remaining firm, which typically indicates either retail panic or a precursor to a trend reversal.
Step Five: The Path of Least Resistance (Trading Strategy)
Overall, the big trend is upwards, but there is short-term adjustment pressure and market sentiment is abnormally fearful. It is advised to cautiously look for long positions but do not chase highs. The key entry area is near the 4-hour support at 74126.32. A stop loss can be set below the recent effective low at 73795.47. The target area first looks at the previous high of 74924.64, and if broken, then at 76038.0.
Step Six: How Will Today Go (Market Prediction)
Currently (in the next few hours): Likely to oscillate between 74126.32 and 74677.19, with a direction biased towards oscillation and consolidation.
Today and Upcoming Key Points: The most important support level is 74126.32; if it breaks, then look towards 73795.47. The most important resistance level is 74924.64; if it breaks, it may test 76038.0.
Trading Approach: The most suitable strategy is to wait for the price to pull back to the support area around 74126.32, looking for signs of stabilization before entering long positions lightly. The reason is that the big trend is upwards, but short-term indicators and sentiment need to repair, and chasing highs carries great risk.
Summary: The core contradiction in the current market is the strong upward trend in technicals versus the extremely fearful market sentiment and ETF fund outflows.
Trading Quote: Stay clear-headed amidst the "extreme fear" headlines and seek opportunities to swim against the tide in the "ETF outflow" wave.
[Qinglan TPV Trading System Backtest Data]
Based on nearly 835 historical backtests, the accuracy rate is 70.9%. The backtest results are for reference only to build strategy confidence; past performance does not guarantee future returns.
[Qinglan's Personal View]
Oh dear, this market is really tangled, reaching new highs while everyone is terrified. My feeling is that the big trend is not broken yet, but this position truly does make people uneasy, so we must resist the urge to chase. The on-chain fear index is absurdly low; sometimes this kind of extreme sentiment acts as a counter-indicator, but you must wait for price confirmation signals before taking action. Remember, good opportunities are waited for, not chased.
This TPV system is what I have honed over the years of watching the market, reviewing, and trading bit by bit. I can't say it's 100% accurate, but it can at least give us more confidence at critical points. If you want to get the latest entry opportunities captured based on the TPV system first hand, feel free to visit the Qinglan Crypto Class official website www.qinglan.org, see you in class~
免责声明:本文章仅代表作者个人观点,不代表本平台的立场和观点。本文章仅供信息分享,不构成对任何人的任何投资建议。用户与作者之间的任何争议,与本平台无关。如网页中刊载的文章或图片涉及侵权,请提供相关的权利证明和身份证明发送邮件到support@aicoin.com,本平台相关工作人员将会进行核查。