Welcome to the Qinglan Crypto Class, I am Sister Qinglan! Today we will use the TPV three-point verification system to dissect the market in detail; it's all practical content!
Step 1: First, look at the big picture (Overview of multi-period trends)
Let's first look at the trend list for four periods:
Daily period (1d):
Trend: Bullish arrangement, as MA5 is 73075.12, MA10 is 71804.56, MA30 is 70002.72, the short-term moving averages are above the long-term ones.
Price position: The latest closing price is 74210.78, above MA5 (73075.12), in a strong zone.
Key support/resistance: Recent effective high of 74900.0 (based on data), effective low of 70566.99 (based on data). The on-chain sentiment is "extreme fear" (index 21), but prices are rising, which is called "sentiment divergence," often indicating opportunity.
4-hour period (4h):
Trend: Moving averages are intertwined, MA5 is 72949.57, MA10 is 71925.49, MA30 is 72146.17, unclear direction, oscillating pattern.
Price position: The latest closing price is 74210.78, above all moving averages, but structurally has not broken through the oscillation range.
Key support/resistance: Recent effective high of 74900.0, effective low of 70566.99. The total market capitalization increased by 3.77%, indicating capital inflow, but extreme fear suggests retail investors may still be afraid.
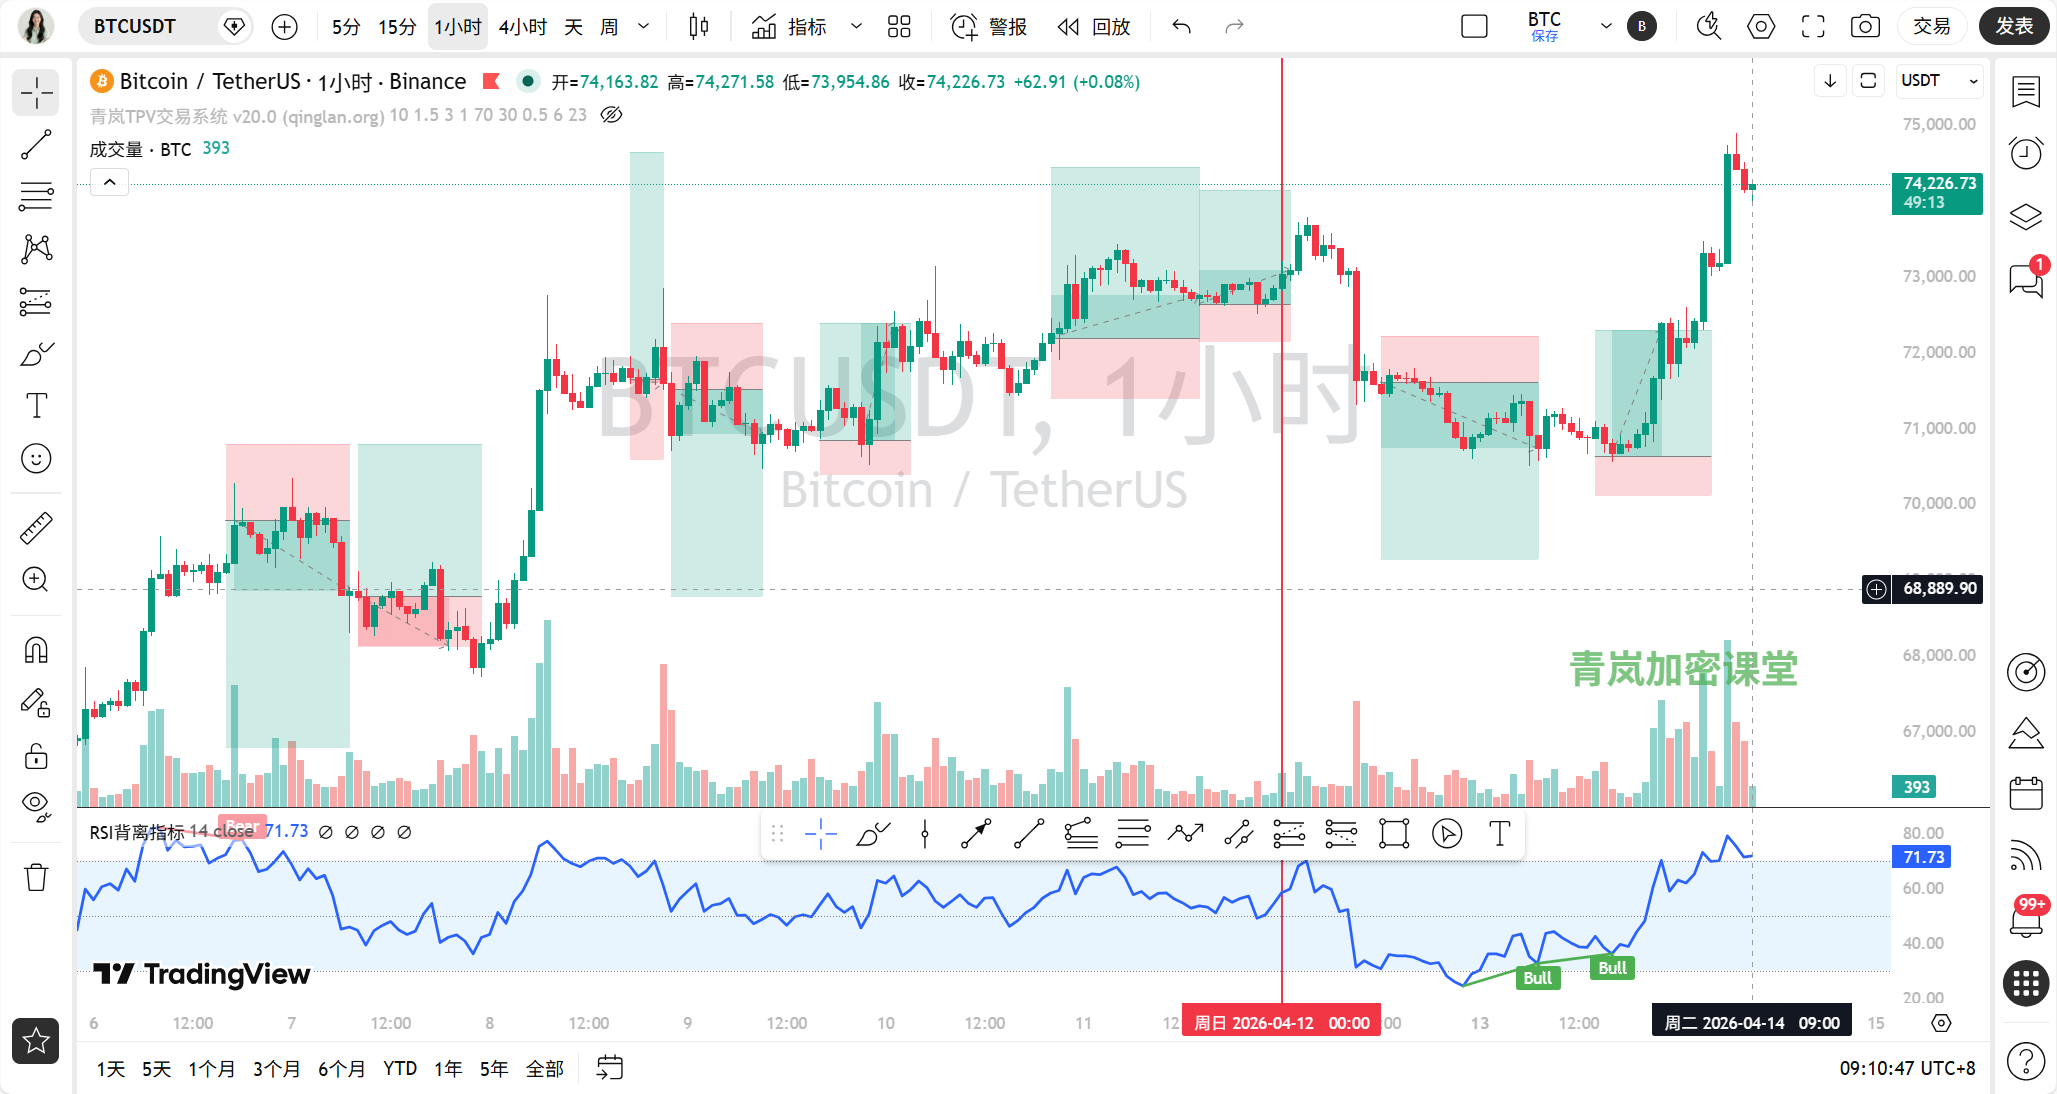
1-hour period (1h):
Trend: Bullish arrangement, MA5 is 74119.87, MA10 is 73384.76, MA30 is 71879.48, short-term trend is upward.
Price position: The latest closing price is 74210.78, closely tied to MA5, in strong adjustment.
Key support/resistance: Recent effective high of 74900.0, effective low of 70566.99. News states “BTC breaks through 74000 USD to reach a new high this year,” which provides an upward news backdrop for the hourly line.
15-minute period (15m):
Trend: Moving averages are intertwined, MA5 is 74279.02, MA10 is 74438.69, MA30 is 73488.03, short-term is also oscillating.
Price position: The latest closing price is 74210.78, hovering near the moving averages, very sensitive.
Key support/resistance: Recent effective high of 74900.0, effective low of 70566.99. Volume data was not provided, but the news mentioned “ETF crazily bought 3353 BTC,” this is real buying support!
Step 2: Find the pivot point, draw the key lines (effective highs and lows + trend lines)
Let’s find the key pivot points for each period:
Daily (1d):
Effective high: 74900.0 (this is the recent highest price, confirmed by subsequent prices that failed to break through).
Effective low: 70566.99 (this is the recent lowest price, confirmed by subsequent prices that did not fall below).
Trend line: Connecting the low of 70566.99 and the high of 74900.0, it can draw a preliminary shape of an ascending channel, with the current price in the upper half of the channel.
4-hour (4h):
Effective high: 74900.0 (consistent with the daily line, is key resistance).
Effective low: 70566.99 (consistent with the daily line, is key support).
Trend line: Similarly based on these two points, the price is attempting to test the high upwards.
1-hour (1h):
Effective high: 74900.0.
Effective low: 70566.99.
Trend line: The hourly line is more volatile, but the larger framework is still constrained by these two major pivot points.
15-minute (15m):
Effective high: 74900.0.
Effective low: 70566.99.
Trend line: On the short term, the price is forming a small platform near 74200, and news “Bitcoin breaks through 73000 USD” might have occurred when breaking this platform.
These pivot points have been tested by prices multiple times, their effectiveness is very strong! The news “whale $5 million Bitcoin short stop-loss” might have occurred when the price rebounded from the low and took out short stop-losses.
Step 3: Indicators to support (Technical indicator verification)
Let's see what the indicators say:
Daily (1d):
MACD: DIF is 1143.81, DEA is 538.17, histogram is 605.64, no crossover, but momentum is strong, it's bullish.
RSI: 68.78, close to overbought area but not yet there, indicating upward momentum but not overly heated. It verifies the bullish trend.
4-hour (4h):
MACD: DIF is 479.10, DEA is 267.67, histogram is 211.42, no crossover, momentum is upward.
RSI: 53.41, neutral to bullish, no divergence. It verifies the slightly upward oscillation pattern.
1-hour (1h):
MACD: DIF is 773.54, DEA is 505.04, histogram is 268.51, no crossover, momentum is very strong.
RSI: 78.64, already entered the overbought area! This indicates that the short-term increase has been rapid, caution against pullback risks. There are slight signs of divergence here (price new high, RSI extremely high).
15-minute (15m):
MACD: DIF is 464.75, DEA is 528.63, histogram is -63.88, no crossover, and the histogram is negative, indicating that short-term momentum is weakening a bit.
RSI: 68.33, strong but not overbought. It contrasts with the hourly line's overbought condition, indicating that the small cycle is digesting the gains of the large cycle.
Step 4: Bull and bear wrestle (News + On-chain)
News:
Positive factors: “BTC breaks through 74000 USD to reach a new high this year,” “ETF crazily bought 3353 BTC,” “Bitcoin breaks through 73000 USD,” “Bitcoin broke through 74,900 USD this morning.” The core is the massive capital inflow from ETFs and price breaking new highs, which directly boosts confidence.
Negative factors: “Whale $5 million Bitcoin short stop-loss” (indicating a large number of shorts are being liquidated, possibly a short-term release of power), “The US-Iran blockade of the Strait of Hormuz, negotiations at a stalemate and military confrontation escalating” (geopolitical risks, which may trigger safe-haven or risk asset sell-offs). The most important core factor is the ETF capital inflow; its fermentation is ongoing; geopolitical risks are potential black swans.
Technical and news: Currently, there is a resonance! Technical breakthroughs, news good support, the direction is consistently upward.On-chain data:
The Fear and Greed index is 21, categorized as “extreme fear.” This is very interesting; prices are rising, yet sentiment is extremely fearful, which is a typical “market rises amid hesitation,” often indicating further space ahead.
BTC dominance is 57.2%, with no data provided on changes, but a high proportion indicates that capital is still concentrated in Bitcoin.
The total market cap is 2596201660726.8496, with a 24-hour change of +3.77%, indicating capital is flowing in.
Technical and on-chain data: There is a bit of divergence! Price technicals are positive, but sentiment indicators are extremely fearful. This divergence usually suggests the trend might continue since retail investors have not fully entered the wild.
Step 5: The path of least resistance (Trading strategy)
Overall, multi-period trends are upward, with positive news and on-chain capital inflow; although sentiment is fearful, this is a contrarian indicator. Therefore, the path of least resistance is upward.
Trade direction: Focus on buying on pullbacks.
Key entry area: Near the support of the hourly line, such as the 72500-73000 range (referencing the 1h period low of 72513.09 and the closing price near 73043.16).
Stop-loss basis: Set below the recent effective low of 70566.99, such as below the integer mark of 70000.
Target area: First, test the previous high of 74900.0, after breaking through look towards the 76000-77000 area.
Step 6: How will it go today (Market forecast)
Current (within a few hours): Due to the 1-hour RSI reaching 78.64 and being overbought, and the 15-minute MACD momentum weakening, the ultra-short term may oscillate at a high between 74200-74900, or even a slight pullback.
Today's and recent keys: Today's most important support level is 73000 (psychological barrier and earlier platform), while the most important resistance level is 74900.0 (previous high). Pay attention to the trend line extending from the low of 70566.99.
Trading thought: The currently most suitable and only trade direction is “waiting to buy after a pullback.” The reason is that the major trend is upward, but short-term overbought needs to be digested; chasing highs carries a significant risk, so it is safer to enter when the key support is retraced.
Summary: The core contradiction in the current market is “the strong technical breakout versus the extreme fear in market sentiment.”
Trading golden saying: No matter how turbulent the geopolitical winds, they cannot stop the trend channel bought by ETF whales with real money.
[Qinglan's personal view]
Oh dear, looking at the data, Sister Qinglan feels that the current market is quite interesting. Prices are clearly hitting new highs, but everyone is terrified; such times are often opportunities. We cannot follow sentiment but must follow data and money. Those thousands of bitcoins from ETFs are not jokes; they are real buying support. However, the short-term rise has been too fast, so we shouldn't rush to chase it; patiently wait for a good position, like a hunter. The market will always give you a chance to hop on board, the key is not to take the wrong vehicle.
This TPV system is something I have developed over the years while monitoring, reviewing, and practicing; I cannot say it is 100% accurate, but it can at least help us maintain confidence in key positions. If you want to receive the latest entry opportunities captured by my TPV system as soon as possible, welcome to visit the Qinglan Crypto Class official website www.qinglan.org
免责声明:本文章仅代表作者个人观点,不代表本平台的立场和观点。本文章仅供信息分享,不构成对任何人的任何投资建议。用户与作者之间的任何争议,与本平台无关。如网页中刊载的文章或图片涉及侵权,请提供相关的权利证明和身份证明发送邮件到support@aicoin.com,本平台相关工作人员将会进行核查。