Crypto Circle Scholar: The ascending channel of Ethereum on April 14 remains intact, short-term adjustments do not change the upward trend! Latest market analysis and thought reference
The current price of Ethereum is 2227, and the trend reversal of the second currency is gradually confirming! From the low rebound of 1736, it has stood above the 2200 mark, and the technical indicators have exited the downward channel, with the upward trend starting to show! The current fluctuation is merely a buildup before an increase; understand the structure, seize this intermediate trend, and don’t get left behind by the market! A new round of increase is on the verge! How many people have missed the opportunity due to fear of a pullback, and how many have been harvested back and forth during the fluctuations? Understand this article, accurately grasp the short-term rhythm, and you will no longer need to chase highs and cut losses, easily profiting from this wave!
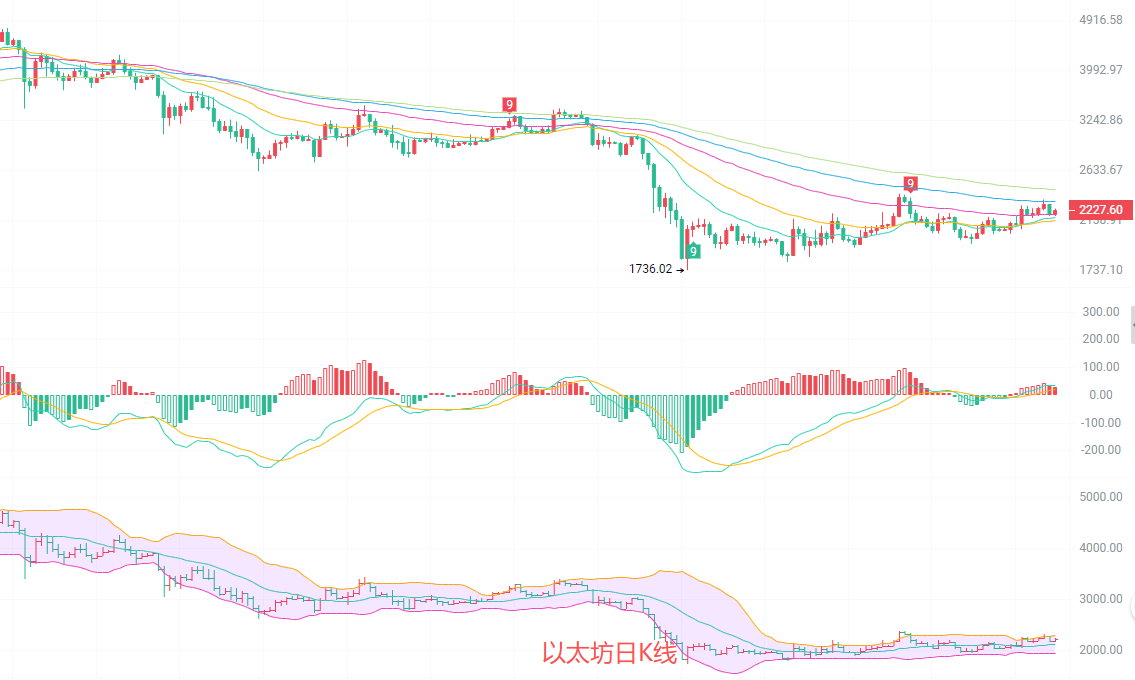
After the daily K line rebounded from the low of 1736, it successfully stabilized above the 2200 mark, confirming the upward trend with the moving average system turning upwards. EMA15 and EMA30 formed support, and the price stood above the middle track of the Bollinger Bands. The MACD indicator's DIF and DEA have a golden cross, the red bars continue to expand, and the downward momentum has significantly decreased. The upper track of the Bollinger Bands at 2299 serves as short-term resistance, while the lower track at 1941 serves as strong support.
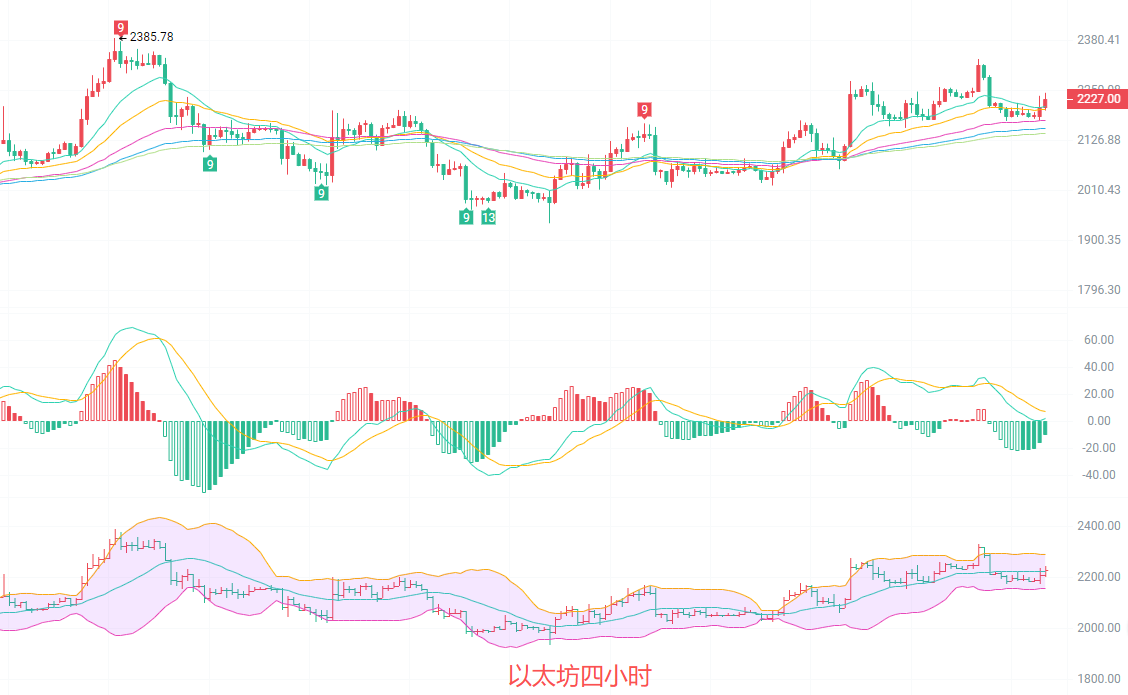
The four-hour K line is oscillating upward along the ascending channel, with the price stabilizing above the 2200 mark, and the moving averages are maintaining a complete upward arrangement. EMA15, EMA30, and EMA60 provide layers of support, and the price pullback does not break the moving averages, with the upward rhythm stable. The MACD indicator operates above the zero axis, and the red bars have slightly narrowed, indicating a slowdown in upward momentum, with a short-term need for a pullback. The upper track of the Bollinger Bands at 2291 acts as resistance, while the lower track at 2157 serves as support; the channel is opening upward, and the upward trend remains unchanged, those who have already entered can continue to hold the upward position.
Short-term reference: (Real-time data has been updated; for details, consult the author)
For upward movement from 2210 to 2180, stop loss at 2150, with a target looking at 2250 to 2280, break out looking at 2350
For downward movement, if the K line rebounds and encounters resistance in the range of 2280 to 2300, then can go south, stop loss at 2320, target 2230 without longing for battle
Specific operations based on real-time market data, for more information, please consult the author; the article has a delay in release, suggestions are for reference only, risks are borne by the user.

Friendly reminder: The above content is created solely by the author of this public account. The advertisements at the end of the article and in the comment section are unrelated to the author; please discern carefully, thank you for reading.
免责声明:本文章仅代表作者个人观点,不代表本平台的立场和观点。本文章仅供信息分享,不构成对任何人的任何投资建议。用户与作者之间的任何争议,与本平台无关。如网页中刊载的文章或图片涉及侵权,请提供相关的权利证明和身份证明发送邮件到support@aicoin.com,本平台相关工作人员将会进行核查。