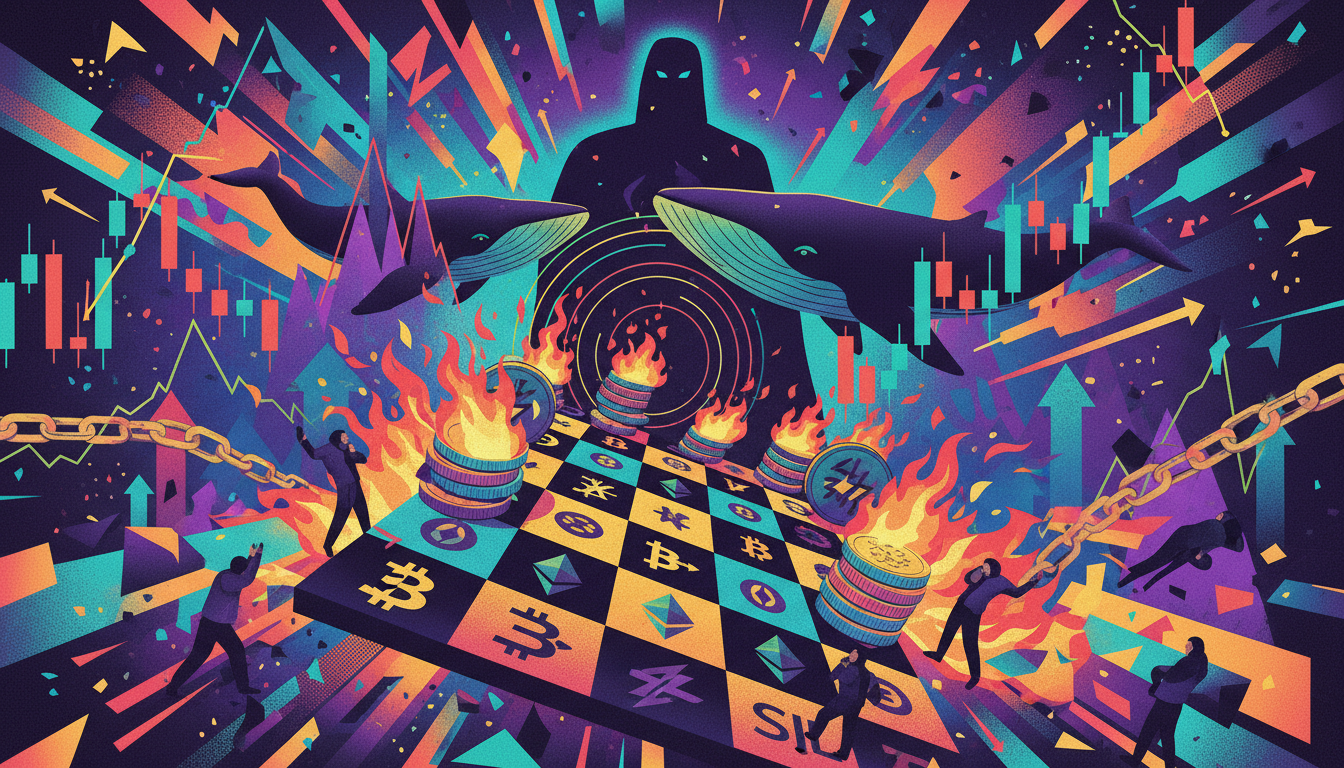
As of midnight on April 13, 2026, Beijing time, Bitcoin broke through 70,000 USD in a very short time, with the price increasing from just above 71,000 to just above 72,000 USD within a few minutes, with the intraday high concentrated in the 72,000-72,056 USD range. Pricing quotes on multiple platforms like HTX, OKX, and Bitget were basically aligned, with the entire network recording a liquidation scale of about 50.24 million USD in this window, with the liquidation volume almost synchronizing with the price peak. As such, 70,000 USD was considered by many traders as a new dividing line between bulls and bears: above it lies the battleground of high-leverage bulls, while below it lies a vacuum zone where bears and chasing bulls bear the costs together. This article will completely unpack the price trajectory, liquidation structure, and cross-asset leverage resonance behind this "flash breakthrough of 72,000," based solely on disclosed data, without overly extending to external macro narratives.
Rapid Surge to 72,000: Price and Liquidation Signals
On April 13 at 22:44-22:49 Beijing time, BTC completed a rapid breakthrough of 70,000 USD on several major platforms. Pricing data showed that BTC/USDT and BTC/USD reached about 72,056 USD on HTX, 72,024.1 USDT on OKX, and 72,004.41 USDT on Bitget, with the price differences between different platforms compressed to within several dozen dollars, indicating a highly synchronized upward surge. Before this, the price still hovered just above 71,000; the surge in just five minutes pushed through the whole number threshold, turning 72,000 from a "long-term target" into a price range actively traded.
From a daily perspective, when this peak occurred, Bitcoin's overall 24-hour increase was only about 1.56%-1.78%, which, based on data from platforms such as HTX, OKX, and Bitget, does not constitute a large-scale unilateral attack. However, under a context of daily growth of less than 2%, completing a near-thousand-dollar rise in just a few minutes, coupled with the breakthrough of a key integer level, reveals that this market movement is "abnormally intense" within the recent fluctuation structure—more akin to a concentrated effort rather than a gentle climb.
Accompanying the price surge was a concentrated liquidation of leveraged positions. According to Coinglass data, the total network 1-hour liquidation scale was approximately 50.24 million USD, which highly overlapped with the price peak period of 22:44-22:49. As the price rapidly increased, it triggered floating losses on short positions, which, centered on forced buying, further pushed the price higher, creating a typical closed-loop of "price surge—bear passive buying—price surge again." This also explains why, despite the overall daily volatility not being exaggerated, there was a noticeable feeling of the market being rapidly "emptied."
Bears Facing Direct Impact: Liquidation Data Directions
The data on liquidation direction reveals who bore the true cost of this breakthrough. Relevant statistics show that within this 1-hour window, the liquidation volume of short positions was about 2.13 times that of long positions, with bears occupying an absolute dominant position in the liquidation phase. This means that the breakthrough at 70,000 USD was not a normal upward move of bulls "entertaining themselves," but rather a passive buying situation where bears were crushed: a large number of short positions were forcibly liquidated at a critical price point, converting into substantial buying power that pushed prices further away from the bearish cost region.
From the scale and direction perspective, 70,000 USD quickly solidified into a new focus of the bull-bear game. On the one hand, the breakthrough means that traders who repeatedly tried to short near the 71,000-72,000 range suffered a concentrated strike, with accumulated floating losses making this area "scarred" in the short term; on the other hand, some right-sided bulls have viewed 72,000 as a new defense line. Once prices fall back to this level, how to handle reducing positions and adding positions will directly affect the rhythm of the next tug-of-war. Both bulls and bears have rewritten their memories of the same price level, laying the groundwork for future technical battles.
At the operational level, this event has also exposed the risk exposure of leveraging shorts or chasing tops near critical integer levels. For bears, continuing to add heavily leveraged positions above 70,000 while betting on the "break of the integer level" means that once prices reverse and break through 72,000, the speed at which floating losses expand far exceeds the manual stop-loss response; for bulls, immediately "going all in on leverage" upon breaking through can similarly lead to consecutive liquidations when prices fake break and fall back. The essence of risk control mistakes is treating integer levels as "absolute tops or bottoms," while ignoring that these levels are inherently the most densely packed battlefields of liquidity and sentiment.
Whale Withdrawals and Huge Long Positions: Who is Increasing Risk
Almost simultaneously with the BTC price breakthrough, whale behavior and rebalancing of large positions on the ETH side were observed. On-chain data shows that address 0x9d99C withdrew 8,091 ETH from the exchange in one go around this time, equivalent to tens of millions of USD in position migration at the current market price. Such large withdrawals are typically interpreted in the market as a signal of "reducing exchange risk, increasing medium to long-term holdings," which does not directly translate into a price bullishness in the short term, but indicates that significant funds are choosing to increase their on-chain exposure to ETH at this time, providing implicit support for overall risk appetite.
Meanwhile, the contract position structure of well-known trader Huang Licheng also showed a significant adjustment. According to publicly available data, he has nearly closed his long positions in BTC but still holds about 14,250 ETH long positions, estimated at a nominal scale of about 31.6 million USD based on the time of disclosure. This indicates that while he has completed a profit-taking or risk contraction cycle in BTC, he has chosen to maintain high leverage or large position exposure in ETH, effectively "betting" on the relative elasticity of ETH against BTC. For the market, this represents a typical risk rebalancing: transitioning from assets that have significantly surged and saturated in sentiment to mainstream assets that still have expectation gaps and narrative space.
When viewing the large whale withdrawals and changes in positions among leading traders together, it becomes apparent that they show correlation rather than a clear causal relationship with the synchronous fluctuations of BTC and ETH. BTC's move to 72,000 triggered an uplift in overall risk asset sentiment, providing an environment for ETH to strengthen; meanwhile, whale buying on the ETH side and large holdings magnified the leverage effect when prices increase or retrace. What we can confirm is: large positions and concentrated withdrawal behaviors appeared in the same market motion, collectively forming a localized picture of rising risk appetite during this period. However, without finer granularity in transaction and strategy information, we cannot and should not view any single address or trader's actions as the "direct driving force" behind the market movements.
Resonance of Bitcoin and Ethereum: Shadows of ETH Liquidation
From the perspective of liquidation distribution, this round of volatility is not solely attributed to BTC. Data shows that ETH-related contracts recorded about 7.93 million USD in liquidation volume during the same wave of movement. Although this absolute value is lower than that of BTC, it still stands out based on its own volatility benchmarks. This indicates that when BTC was breaking through the 72,000 level, the leverage structure in the ETH market was also being synchronized: as prices strengthened, it accelerated volatility through strong liquidation of long and short positions, forming a cross-asset "leverage resonance."
In terms of timing, BTC broke through critical price levels first, igniting risk appetite across the entire crypto asset market; ETH, in this background, amplified its own volatility, both following the price increase and synchronously liquidating. For bulls, BTC reaching a new phase high is often viewed as a signal for the "continuation of a bull market," shifting funds from a wait-and-see approach to an offensive posture, with some funds directly allocating to ETH and other mainstream assets, speeding up their ascent; for bears, short positions previously established on ETH face greater expected headwinds after the BTC breakthrough, and if ETH prices experience a rapid rally, it will also trigger passive liquidations.
The combination of "BTC reaching a new high + ETH amplifying volatility" ultimately acted as an amplifier for overall market sentiment and leveraged risk appetite: on the price level, BTC's breakthrough of integer levels provided reasons for "continuing to go long"; on the position level, the elasticity on the ETH side reminded traders that any direction of high leverage could potentially be liquidated in a short time. For traders participating in multi-asset interconnected trading with full positions and heavy leverage, such cross-asset synchronous shocks mean that a single volatility could simultaneously breach multiple risk control lines, amplifying the cost of a single judgment error.
What Data Can and Cannot Say: Key Blind Spots and Narrative Boundaries
It is important to emphasize that although the breakthrough of 70,000 USD has left plenty of pricing and liquidation data, there are still obvious blind spots in critical details. First, we currently lack detailed transaction volume data and order book structure at the moment of breakthrough, making it difficult to determine whether this surge was driven by active large buy orders that "exploded at a single point" or by continuous small buy orders piling up on top of forced liquidation of short positions. Secondly, the rhythm of order cancellations at the market and the specific process of wall orders being filled are also missing, limiting our ability to judge whether this breakthrough was a "organised surge" or a "natural breakthrough."
Regarding triggering factors, we also cannot simply bind price behavior to external macroeconomic, geopolitical events. Current open information does not provide evidence of a direct causal relationship between Bitcoin's breakthrough of 70,000 and any specific geopolitical events; forcibly stitching the two together will only create an illusion of "post-event narratives," weakening sensitivity to real trading motives. For professional traders, it is more important to return to quantifiable dimensions of price, positions, and liquidity, rather than replacing rigorous analysis with grand narratives.
Furthermore, data regarding the potential liquidation concentration around the 71,800-70,000 USD range and the sell wall above 74,000-75,000 USD is currently still in a verification state, needing targeted verification in tools like Coinglass to serve as decision-making basis. Without sufficient verification, treating these price levels as "ironclad zones" or "absolute ceilings" will also lead to strategy designs based on unreliable premises. What data can tell us is the already occurred price and liquidation objective records; what it cannot do for us is to treat unverified assumptions as facts and package coincidental events as necessary logic.
From Liquidation to Revelation: Risk Mirrors for the Next Breakthrough
Based on the above data, the recent Bitcoin flash breakthrough of 72,000 appears to be a chain reaction where price surges and concentrated shorts' liquidations mutually reinforce each other. BTC accelerated its offensive between 22:44-22:49, with prices breaking through 72,000 and triggering a large number of forced short liquidations. The liquidation phase, in turn, acted as additional buying power, swiftly pushing prices away from the original fluctuation range; meanwhile, the millions of dollars in liquidation on the ETH side, large whale withdrawals, and significant ETH long positions together amplified overall market risk appetite through another path. This multi-path overlapping structure determines that the portrayal of the market is "beyond seemingly moderate daily increases lies a concentrated settlement of high leverage."
For high-leverage traders, the risk revelations from this event are quite direct: first, controlling leverage multiples is the first line of defense against sudden "wild" market movements; pushing leverage to the extreme near integer levels essentially hands the account over to the liquidation engine; second, be wary of the inducement effects of integer levels, such as 70,000, and 72,000—these price levels not only attract attention but also easily accumulate stop-loss and limit orders, becoming prime targets for liquidity extraction; third, pay attention to cross-asset resonance; during periods when BTC and mainstream assets like ETH amplify volatility, overall risk will significantly increase due to position and cross-leverage overlaps, where a single judgment error could simultaneously drag multiple assets.
Looking ahead, if BTC continues to oscillate at high levels above 70,000 USD, the 72,000 USD line will likely evolve into a new battleground for bulls and bears: for bulls, this is a critical price range to solidify breakthroughs and build new support; for bears, it remains a natural territory to realign positions and wager on "fake breakouts." Every time prices approach or cross 72,000, it may rekindle the "memory" of the liquidated funds from this round, resulting in either more cautious leverage usage or more aggressive betting behavior. For traders, the real task is not to predict whether the next breakthrough will necessarily succeed or fail, but to adjust leverage, positions, and risk control plans to withstand the worst outcomes before each approach to critical price levels.
Join our community, let's discuss and become stronger together!
Official Telegram community: https://t.me/aicoincn
AiCoin Chinese Twitter: https://x.com/AiCoinzh
OKX Benefits Group: https://aicoin.com/link/chat?cid=l61eM4owQ
Binance Benefits Group: https://aicoin.com/link/chat?cid=ynr7d1P6Z
免责声明:本文章仅代表作者个人观点,不代表本平台的立场和观点。本文章仅供信息分享,不构成对任何人的任何投资建议。用户与作者之间的任何争议,与本平台无关。如网页中刊载的文章或图片涉及侵权,请提供相关的权利证明和身份证明发送邮件到support@aicoin.com,本平台相关工作人员将会进行核查。