Hello everyone, I am Cody, a special invited analyst from Odaily.
Last week, our market prediction for HYPE and BTC was once again validated by the market - HYPE stopped falling and rebounded near the low point of wave IV, while BTC maintained a wide-range oscillating pattern, aligning highly with our previous judgment.
This week, the market has reached a point that requires patience rather than impulsiveness. We will continue to analyze HYPE and BTC, focusing on this week's entry rhythm and operational strategies.
Welcome to join our Odaily market sharing group, where I will share daily market comments and short-term ideas and communicate market dynamics with everyone in real time.
This week's core trading viewpoints summary:
• HYPE multi-cycle trend structure analysis.
• Full-cycle tracking of HYPE market dynamic evolution.
• HYPE market prediction and short-term operational strategy for this week.
• BTC current trend structure analysis.
• BTC market prediction and medium-short term operational strategy for this week.
Trading strategies and core viewpoints market validation:
• HYPE short-term trading effectiveness: HYPE completed a second short-term long position operation last week (1x leverage), achieving a cumulative return of about 9.02%. (Details in Table 1)
• HYPE market trend prediction validation: In last week's article, we pointed out: the IV wave adjustment of HYPE may end near the low point of 34.44 USD on April 2, and a rising trend is expected thereafter. Our core task last week was to capture the right-side buying points. The current market trend has validated our previous viewpoint, as last week's market rebound reached a peak price of 43.18 USD.
• BTC medium-term trading effectiveness validation: Bitcoin followed the established medium-line strategy last week, continuing to hold the short position established at 89,000 USD (1x leverage), with a profit of about 20.51% by last week's close (approximately 70,742 USD), with a maximum profit of around 32.58% during this period. (Details in Section Six)
• BTC market trend prediction validation: In last week's article, we pointed out: the market will maintain a wide-range oscillating pattern. The current market trend has confirmed our previous predictive viewpoint.
1. HYPE: Trend structure analysis
1. HYPE daily chart trend structure division: (based on the market evolution after January 21)
HYPE daily candlestick chart
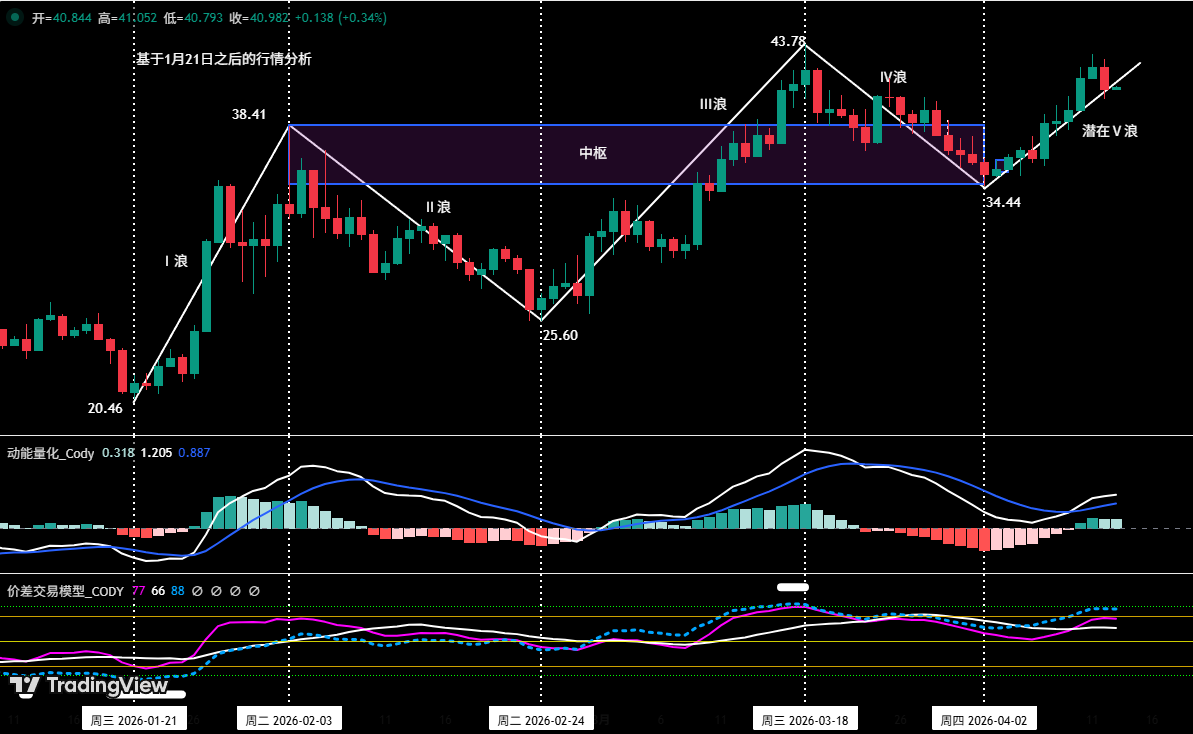
Figure One
As shown in (Figure One):
• Wave I (driving wave): from the low of 20.46 USD on January 21 to the high of 38.41 USD on February 3, lasting 14 days, with a maximum increase of 87.73%.
• Wave II (adjustment wave): from the high of 38.41 USD on February 3 to the low of 25.60 USD on February 24, lasting 20 days, with a maximum decrease of 33.35%.
• Wave III (main rising wave): from the low of 25.60 USD on February 24 to the high of 43.78 USD on March 18, lasting 23 days, with a maximum increase of 71.02%.
• Wave IV (adjustment wave): from the high of 43.78 USD on March 18 to the low of 34.44 USD on April 2, lasting 15 days, with a maximum decrease of 21.33%.
• Potential Wave V (driving wave): from the low of 34.44 USD on April 2 to now, having lasted 10 days, with a maximum increase of 25.38%. Since the current price has not yet broken through the high of Wave III (38.41 USD), this trend still belongs to the potential Wave V phase.
2. Full-cycle tracking of HYPE market dynamic evolution
• February 23 weekly review: First indicated that HYPE might enter an investment window, pointing out that the market was in the II wave adjustment phase and predicting that it would soon initiate the III wave main rising trend.
• March 3 weekly review: Determined that the low of 25.60 USD on February 24 could be the starting point of Wave III, confirming the potential location of the trend reversal.
• March 9 weekly review: Pointed out that the price had effectively broken through multiple moving average resistances at the daily level, then entered a pullback consolidation phase, expecting a rapid rise after it ended.
• March 16 weekly review: Pointed out that the market was in the III wave trend and was constructing a rising central axis (i.e., central B). Predicted a high probability of running in a wide range of oscillation after the construction is complete.
• March 30 weekly review: Pointed out that the entire market structure was still in an upward trend at the daily level, at which time the price was confirming the pullback after breaking through the peak and bottom of Wave I (38.41 USD), which was the IV wave adjustment phase.
• April 6 weekly review: Pointed out that the IV wave adjustment might have ended at the low of 34.44 USD on April 2, and a V wave rising phase might follow.
3. In-depth deconstruction of current HYPE trend structure (analyzed on a 4-hour basis)
HYPE 4-hour candlestick chart
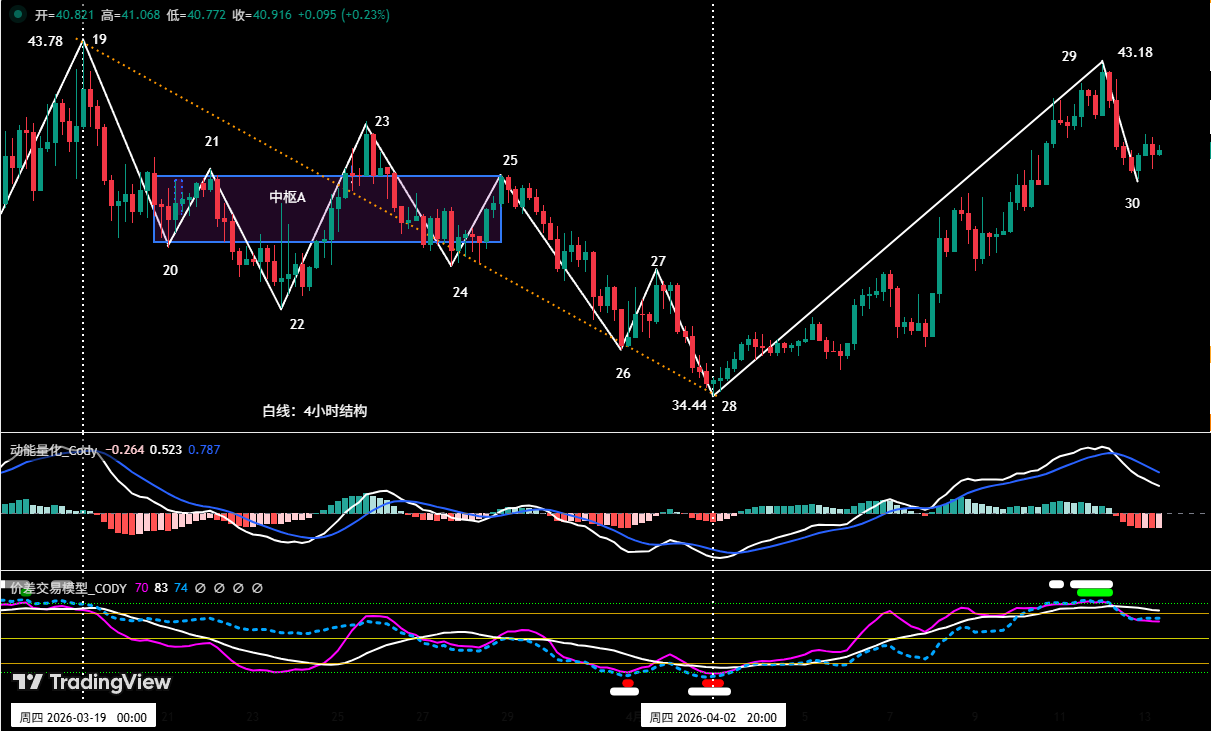
Figure Two
• Based on the potential V wave rising trend structure division after the low point of 34.44 USD on April 2.
• As shown in (Figure Two), the potential V wave can be subdivided into: between endpoint 28 and endpoint 30, forming an upward structure consisting of two segments 28-29 and 29-30.
• The current trend is running from segment 29-30. The chart shows that, from our constructed spread trading model, the endpoint 29 triggered a top warning signal (green and white points in the chart), indicating that the technical indicators are in an overbought state, indicating a short-term need for a volatile adjustment.
2. HYPE: This week's market prediction and short-term operational strategies
1. HYPE market trend prediction for this week:
• This week's market prediction: As shown in (Figure Two), since the low of 34.44 USD on April 2, HYPE has been rising for 10 consecutive days, very close to the previous III wave high of 43.78 USD. From the 4-hour chart, short-term technical indicators signal overbought status, suggesting there is oscillation risk in the price early this week. It is recommended that investors avoid blindly chasing the high prices, and can patiently wait for the end of the washout and low buy opportunities after the trend stabilizes, while strictly setting stop losses.
2. HYPE short-term operational strategy for this week:
• Based on the prediction of the overall upward trend, the strategy should follow "going with the flow, buying on dips."
• Based on the self-constructed quantitative model signals, using 30 minutes/60 minutes as the operational cycle, utilizing 30% of the position to capture long entry opportunities.
• Opening strategy: HYPE is facing a demand for adjustment early this week. If the price shows confirming signals above the key support area of 37.5-38 USD during the pullback process, combined with bottom buying signals triggered by two major models, long entry can be considered, with strict stop losses set.
3. Bitcoin: Structure analysis of oscillating trends
Bitcoin 4-hour candlestick chart
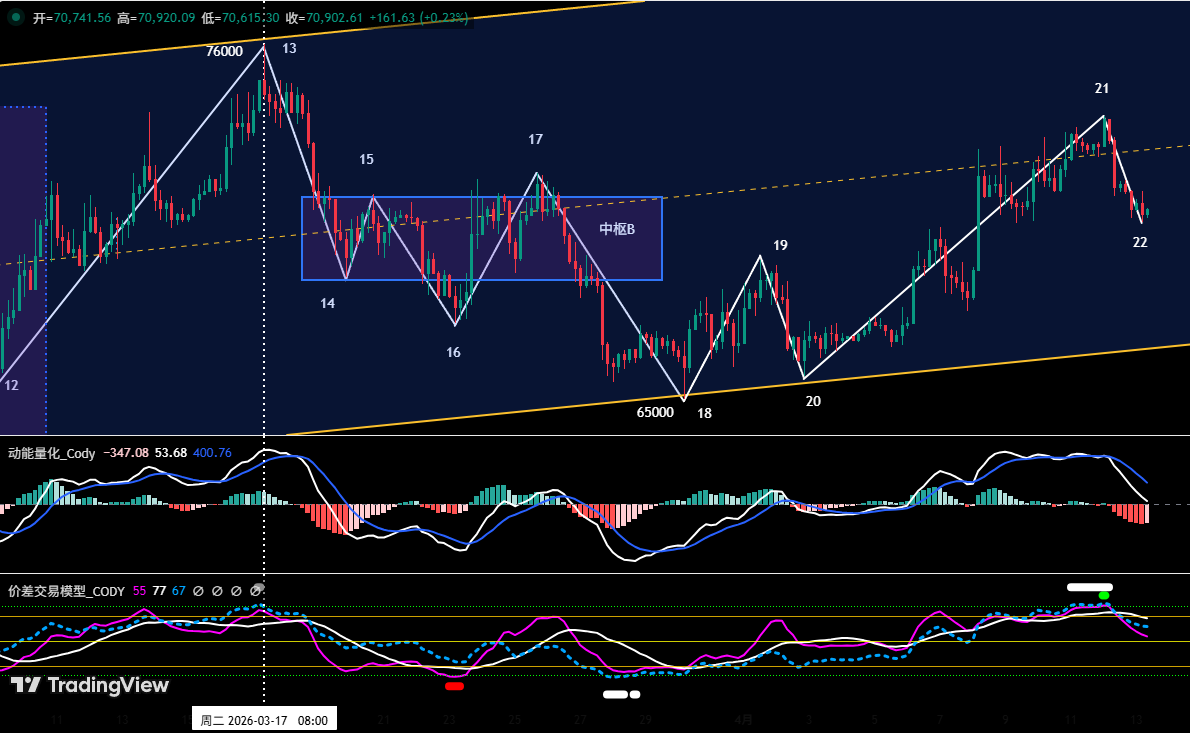
Figure Three
1. Based on the market evolution after the low of 65,000 USD on March 30.
2. As shown in (Figure Three), BTC initiated an oscillating upward trend from the low of 65,000 USD on March 30. From endpoint 18 to endpoint 22, it comprises four segments: 18-19, 19-20, 20-21, and 21-22.
3. Currently, the trend is running the 21-22 segment. The chart shows that, from our constructed spread trading model, the area near endpoint 21 has triggered a top warning signal (green and white points in the chart), indicating that the technical indicators are in an overbought state, and facing the key resistance level of 74,500. Therefore, the market has a short-term requirement for declining oscillation adjustment.
4. Bitcoin: This week's market prediction and operational strategies
1. BTC market trend prediction for this week:
• Core viewpoints for this week:
This week is expected to maintain a wide oscillation range between 65,000 and 74,000 USD. The current coin price is pulling back to the central axis of the range and the key support level of 69,500 USD. If this support holds effectively, the market will maintain a strong oscillating structure: should the support break down effectively, the oscillating structure will weaken, and the coin price may further test the key support near 65,000 USD. The current market is dominated by news, with sentiment sensitivity and unclear direction; it is recommended that investors maintain a wait-and-see approach.
2. Core pressure levels:
• First pressure zone: 74,500-76,000 USD region (near the low point of April 2025)
• Second pressure zone: 79,000-80,600 USD region (near the low point of November 2025)
3. Core support levels:
• First support level: near 69,500 USD (previously important support level)
• Second support level: 65,000-66,000 USD region (near the lower boundary of the oscillation range)
• Third support level: 60,000-62,500 USD region (near the low point of February 6)
4. This week's operational strategies (excluding sudden news impacts): (04.13-04.19)
① Medium-line strategy:
Bitcoin daily candlestick chart: (position monitoring model)
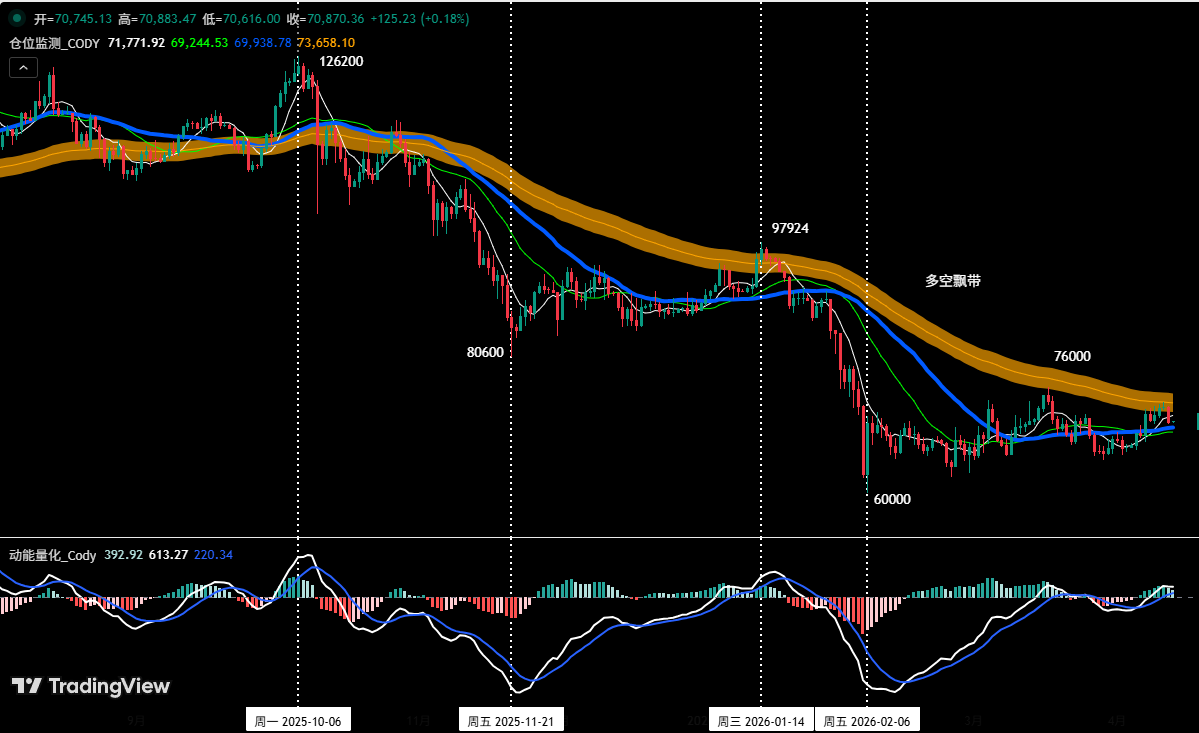
Figure Four
Position monitoring model: As shown in (Figure Four), the current coin price is below the bullish-bearish floating band (yellow), continuing the bearish trend. Based on the strategy rules, we will continue to hold the short position of 60% established at 89,000 USD (January 28).
• If the coin price rebounds and effectively breaks above the bullish-bearish floating band and stabilizes above it, all medium-line positions will be cleared.
② Short-line strategy: Utilize 30% position, set stop-loss points according to support and resistance levels, and seek to make "spread" opportunities. (Using 30 minutes/60 minutes as the operating cycle).
③ Based on the prediction of the medium-term bearish trend in the market, we should currently adhere to the operation principle of "going short against the trend." To dynamically respond to the market's complex evolution and integrate with the signals generated by our trading models, we will formulate A/B/C three short-line operational plans:
• Plan A: Resist rebound, short on highs.
• Opening: When the coin price rebounds to the 74,500-76,000 USD region, triggering a resistance signal combined with model top signals, a 30% short position can be established.
• Risk Control: The initial stop-loss level is set above 76,500 USD.
• Closing: When the price drops to a significant support level near and combined with model signals, positions can be gradually liquidated for profit taking.
• Plan B: Small position breakdown shorts.
• Opening: When the coin price effectively breaks below the critical support near 69,000 USD and triggers combined model top signals, a 30% short position can be established in the direction of the trend.
• Risk Control: The initial stop-loss level is set above 70,500 USD.
• Closing: When the price drops to support and combined with model signals, positions can be gradually liquidated for profit taking.
• Plan C: Large position breakdown shorts.
• Opening: When the coin price effectively breaks below the critical support near 65,000 USD, combined with model top signals, a 60% short position can be established in the direction of the trend.
• Risk Control: The initial stop-loss for shorts is set above 66,500 USD.
• Closing: When the price drops to support and combined with model signals, positions can be gradually liquidated for profit taking.
5. HYPE: Operational review
1. Short-line operation review: (See Table 1)
We strictly followed the operational plan, using trading signals generated by our self-constructed spread trading model and momentum quantification model. Last week, we completed two short-term (long) operations, achieving a total trading profit of 9.02%.
2. Summary of HYPE short-line trading details: (Leverage * 1x)
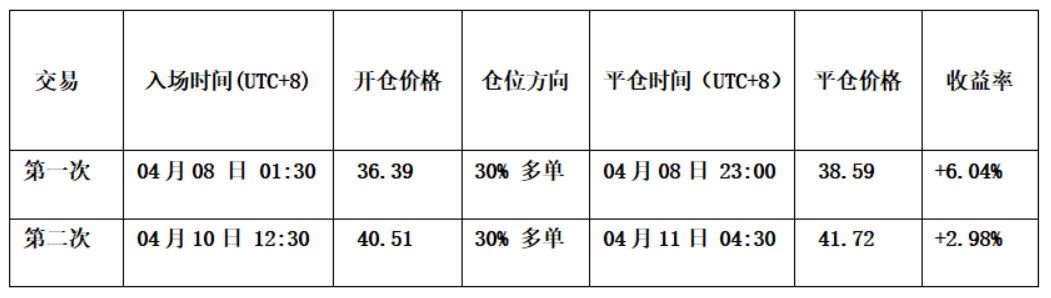
Table One
3. First short-line trading review: (See Figure Five)
• Opening strategy: Based on the determination that the market's IV wave adjustment has ended near 34.44 USD, combined with the bottom divergence signal emitted by the momentum model and the spread trading model being at the bottom, we formulated a plan to buy on dips. Therefore, when the price pulled back to that position and showed signals of stabilization, we established a 30% long position at 36.39 USD.
• Closing strategy: When the price reached around 40 USD and encountered resistance, and simultaneously, the spread trading model triggered a strong top warning signal (green point + white point), we cleared all positions at around 38.59 USD.
• Summary: This trade successfully earned about 6.04% profit.
3. Second short-line trading review: (See Figure Five)
• Opening strategy: When the price broke through the critical resistance of 39.5 USD and successfully pulled back, while the K line showed a "bottom-type" combination, and combined with resonance signals from the two major models, we established a 30% long position at 40.51 USD.
• Closing strategy: When the price reached around 43 USD and encountered resistance, and at the same time, the spread trading model triggered a strong top warning signal (green point + white point), we cleared all positions at around 41.72 USD.
• Summary: This trade successfully earned about 2.98% profit.
HYPE_30 minute candlestick chart: (momentum quantification model + spread trading model)
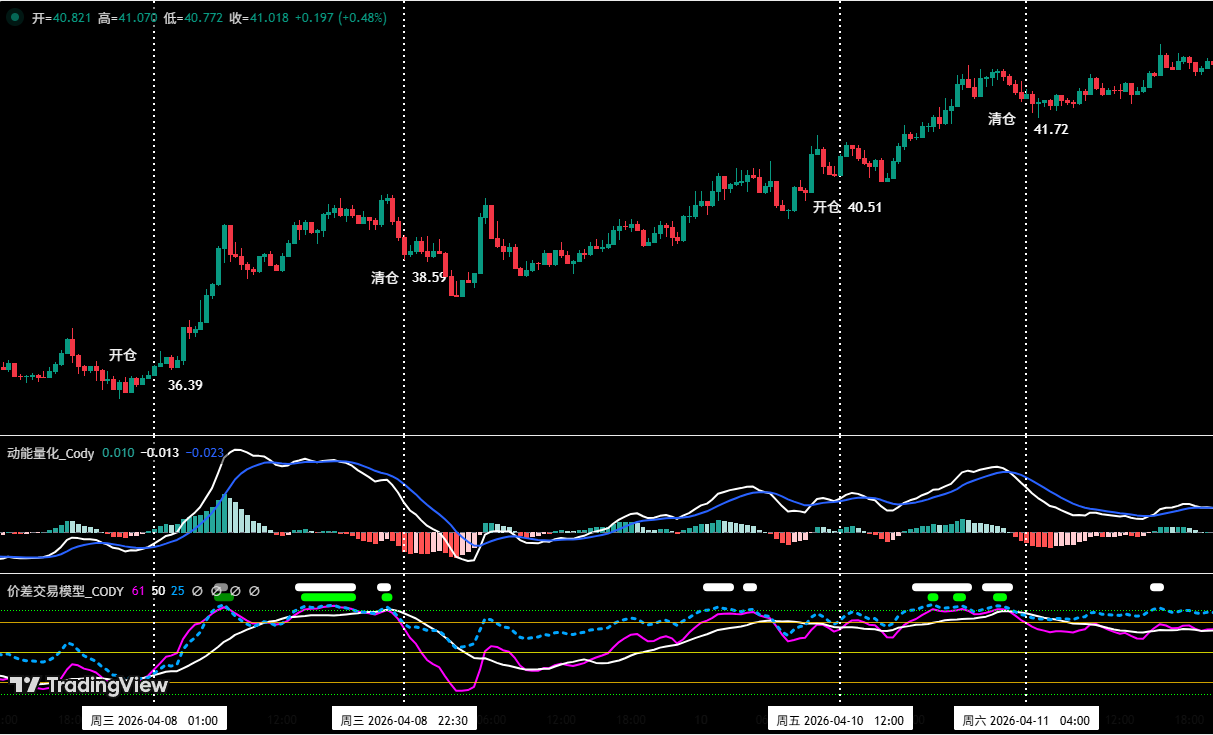
Figure Five (short-line trading illustration)
6. Special Reminder:
1. When opening a position: immediately set an initial stop-loss level.
2. When the profit reaches 1%: move the stop-loss level to the opening cost price (break-even point) to ensure the safety of the principal.
3. When the profit reaches 2%: move the stop-loss level to the position with a 1% profit.
4. Continuous tracking: thereafter, for every additional 1% profit earned, the stop-loss level will be moved 1% in sync, dynamically protecting and locking in profits.
The financial market is ever-changing, and all market analyses and trading strategies need to be dynamically adjusted. All viewpoints, analytical models, and operational strategies discussed in this article are derived from individual technical analyses and are for personal trading logs only, not constituting any investment advice or operational basis. The market has risks, and investment must be cautious; decisions should not be made based on this.
If you would like to receive daily market comments and engage in real-time discussions, welcome to join the Odaily market sharing group, where we will track the market and discuss strategies together.
免责声明:本文章仅代表作者个人观点,不代表本平台的立场和观点。本文章仅供信息分享,不构成对任何人的任何投资建议。用户与作者之间的任何争议,与本平台无关。如网页中刊载的文章或图片涉及侵权,请提供相关的权利证明和身份证明发送邮件到support@aicoin.com,本平台相关工作人员将会进行核查。


