Hello everyone, I am Qinglan, welcome to the Crypto Classroom! Today, we will use the Qinglan TPV three-point verification trading system to analyze the latest market data and see where the opportunities and risks truly lie.
Step 1: Look at the big picture (Multi-cycle trend overview)
Let's reveal the data from four cycles:
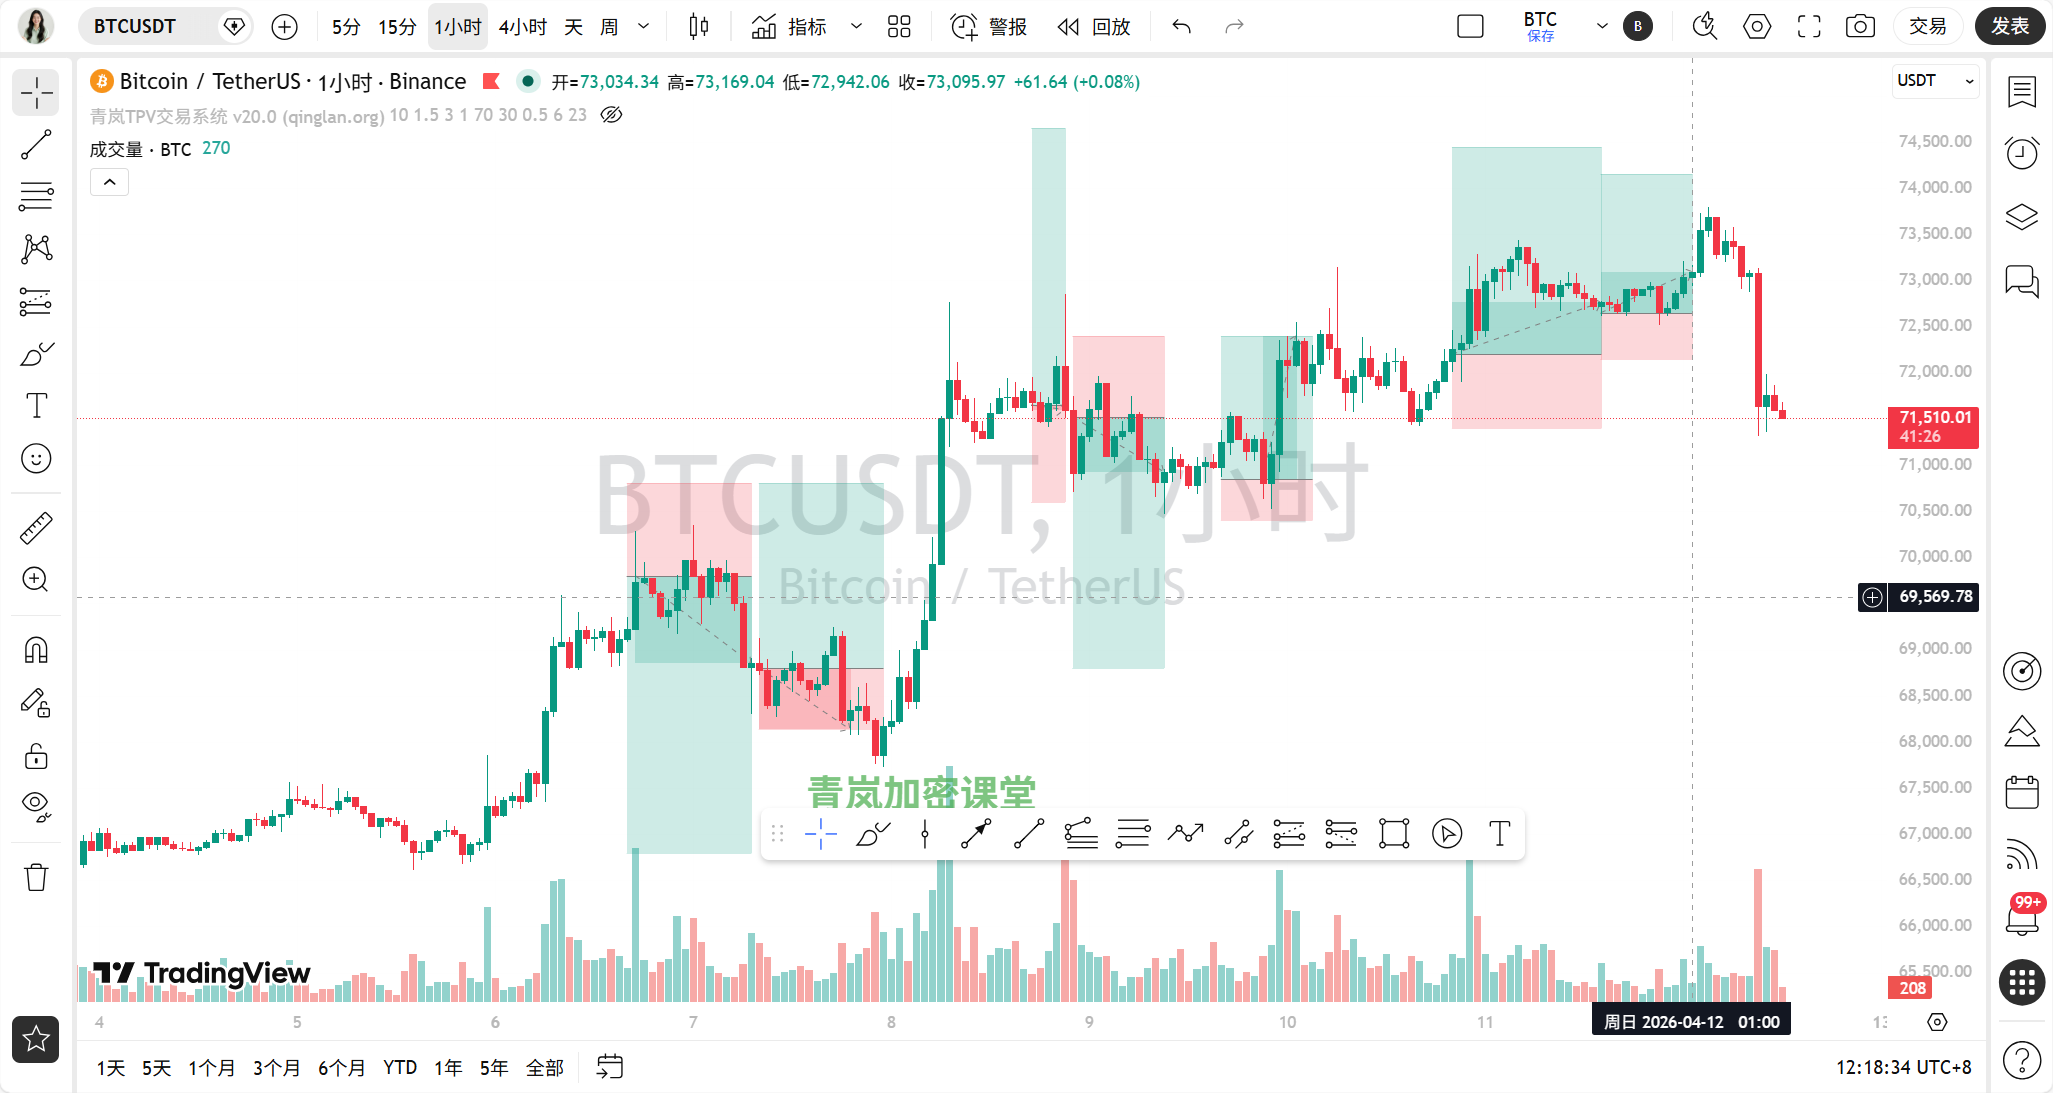
1-day chart (big direction): Closing price 71592.03, highest price 73137.24, lowest price 71310.0. The moving averages are MA5=72091.16, MA10=70453.26, MA30=69877.71, showing a “bullish arrangement”! The price is currently just below the MA5 moving average. The long-term trend is still upwards. On-chain sentiment is “extreme fear,” with an index of only 16, which shows a clear "divergence" from the bullish trend of the larger period, indicating a very fearful market sentiment, but the overall structure is not broken yet.
4-hour chart (medium-term rhythm): Closing price 71592.03, highest price 71685.31, lowest price 71519.0. Moving averages MA5=72554.74, MA10=72749.16, MA30=71677.30 display “interwoven moving averages,” with an unclear direction. The price is below all moving averages, indicating weakness. The entanglement of this cycle reflects the market's oscillation under panic sentiment.
1-hour chart (short-term momentum): Closing price 71592.03, highest price 71685.31, lowest price 71519.0. Moving averages MA5=71934.04, MA10=72649.40, MA30=72809.00 indicate a “bearish arrangement.” The price is pressed down by all moving averages, showing clear short-term downward momentum. On-chain panic sentiment is manifested here.
15-minute chart (micro fluctuation): Closing price 71592.03, highest price 71637.78, lowest price 71519.0. Moving averages MA5=71635.24, MA10=71714.92, MA30=72613.36 also show a “bearish arrangement.” This is the smallest cycle, reflecting that the price is undergoing rapid declines and being oversold.
News correlation: Negative news such as “BTC breaking below 72000 dollars,” “whales liquidating,” and “fear index rising to 16” corresponds to the declines on the hourly and 15-minute charts, as well as the extreme fear on-chain sentiment.
Step 2: Find pivot points and draw key lines (valid highs and lows + trend lines)
Let's find the key turning points for each cycle:
1-day chart: The most recent valid high point (Pivot High) is 73790.0 (from the 4-hour highest price sequence), and the most recent valid low point (Pivot Low) is 71310.0 (from the 1-day lowest price sequence). The low point of 71310 has just formed and requires confirmation from subsequent daily close.
4-hour chart: Valid high point 73264.76 (from the 4-hour highest price sequence), valid low point 71519.0 (from the 4-hour lowest price sequence). A descending trend line can be drawn connecting the recent highs, and the current price is below the trend line.
1-hour chart: Valid high point 73204.74 (from the 1-hour highest price sequence), valid low point 71519.0 (from the 1-hour lowest price sequence). The downward trend is clear, with 71519 being a newly created low.
15-minute chart: Valid high point 71982.46 (from the 1-hour highest price sequence), valid low point 71519.0 (from the 15-minute lowest price sequence). The descending channel is clear, with 71519 being the current focus.
Events in the news, such as “whale stopping losses at 73500 dollars” and “US-Iran negotiations breaking down”, may have intensified the selling pressure from the peak around 73200, helping to confirm the effectiveness of these resistance points.
Step 3: Indicators for support (technical indicator verification)
Using indicators to assess momentum and status:
1-day chart: MACD’s DIF=819.81, DEA=310.41, histogram=509.40, no crossover, but the bars are shortening, and upward momentum is weakening. RSI=70.95, at a relatively high level but not yet overbought. The indicators support the trend but indicate a slowdown in momentum.
4-hour chart: MACD’s DIF=597.02, DEA=810.57, histogram=-213.55, no crossover, but DIF is below DEA and the bar is negative, indicating bearish momentum. RSI=48.32, neutral but weak. The indicators validate the weak oscillation on the 4-hour chart.
1-hour chart: MACD’s DIF=-218.85, DEA=-0.54, histogram=-218.32, no crossover, with both lines below the zero axis, indicating strong bearish momentum. RSI=34.80, close to oversold territory. The indicators strongly confirm the downtrend on the hourly chart.
15-minute chart: MACD’s DIF=-413.58, DEA=-369.97, histogram=-43.61, no crossover, indicating bearish momentum. RSI=12.93, has already been severely oversold! This suggests that the short-term decline may be too fast and requires a rebound repair.
Currently, there is no obvious divergence between price and indicators.
Step 4: Bull and bear face-off (news + on-chain)
News:
Negative factors (clearly dominant): “whales liquidating and fleeing,” “funding rates remain negative,” “US-Iran negotiations breakdown impacting the market,” “1-hour total liquidations of 90.75 million dollars (with long positions accounting for 85 million),” “fear index rising to 16.”
Positive factors (few): “BTC breaking through 73000 dollars” (now in the past), “Ethereum ETH breaking through 2300 dollars.”
The core factors are "whale selling" and "geopolitical risks (US-Iran negotiations)", and the combination of these two led to a panic-driven market decline. The technical decline and negative news created a “resonance,” jointly pushing prices downward.On-chain data:
The fear and greed index is only 16, in a state of “extreme fear.” BTC's dominance is 57.06%. Total market capitalization is 2.51 trillion dollars, with a 24-hour change of -1.43%. These data clearly show that market sentiment is extremely pessimistic, with funds flowing out (total market cap declining). The extreme fear state on-chain resonates with the downtrends at the hourly and 15-minute levels, but diverges from the bullish trend at the daily level. This indicates that market sentiment has become overly pessimistic.
Step 5: The path of least resistance (trading strategy)
Overall, the multi-cycle trends are conflicted: daily shows a bullish trend, but mid- and short-term cycles are in bearish arrangements with panic sentiment. The current “path of least resistance” is clearly downward, as panic sentiment and short-term downward momentum are very strong.
However! Note that the 15-minute RSI has already reached an extreme oversold value of 12.93, making direct shorting risky.
A more reasonable strategy is: wait for a rebound and look for shorting opportunities near key resistance levels.
Key entry area: Pay attention to the pressure areas of hourly moving averages, such as MA5 (71934) and MA10 (72649). If the price rebounds weakly and approaches these positions, they can be considered.
Stop-loss basis: Place it above the key resistance, such as the recent valid high point of 73265 or above the downward trend line.
Target area: Look toward the recent valid low point around 71519, which, if broken, may further dip.
Todays' trading thought: The main idea is to short on the rebound, but it is crucial to patiently wait for a rebound signal and never short on impulse. Aggressive short-term traders can take a small position around 71500 to bet on an oversold rebound, but must be quick to enter and exit with strict stop-losses.
Step 6: Today's market prediction
Current (in a few hours): The price is around 71500, and the 15-minute RSI is severely oversold, expecting a slight technical rebound or oscillation, but the overall atmosphere remains bearish.
Key for today and the near term:
The most important support level: 71519 (recent valid low point), if broken, downward space may open up.
The most important resistance level: 71934 (1-hour MA5 moving average), 72649 (1-hour MA10 moving average).
Trend line position: Pay attention to the pressure from the descending trend lines on 4-hour and 1-hour levels.Trading thought: The only suitable trading direction right now is “wait for a rebound and then short.” The reason: Although the larger cycle is still intact, the mid- and short-term bearish arrangements + market extreme fear mean that the power of the rebound could be limited and shorting offers a better risk-reward ratio. Avoid blindly bottom-fishing in panic.
Summary: The current core contradiction in the market is the “bullish trend at the daily level” versus the “extreme fear sentiment and short-term downward momentum”.
Trading quote: Whale liquidations trigger a wave of panic, US-Iran negotiations only add confusion; only by strictly adhering to key pivot lines can we stabilize the helm in the whirlpool of emotions.
[Qinglan TPV trading system backtesting data]
Based on nearly 765 historical backtests (sample size 772), the accuracy rate is 70.2% (last backtest time 04-12 07:00:02). Backtesting results are for strategy confidence reference only, past performance does not represent future returns.
[Qinglan's personal opinion]
Oh, seeing that RSI has dropped to 12 in the data, the market is really scared. Such times often test one's mindset, as panic sentiment can push prices to unreasonable levels. We must respect the trend; the bearish sentiment on the hourly chart is indeed bearish, but the broad daily structure has not collapsed yet. My takeaway is not to follow the crowd in bloodshed but to patiently wait for a rebound, allowing the market to catch its breath before finding a more comfortable entry position. Remember, opportunities are waited for, not chased.
This TPV system has been honed through my years of market observation, backtesting, and real trading; I won’t say it’s 100% accurate, but it can help us maintain confidence at critical points. To obtain the latest entry opportunities based on the TPV system in real-time, feel free to visit the official Qinglan Crypto Classroom website www.qinglan.org
免责声明:本文章仅代表作者个人观点,不代表本平台的立场和观点。本文章仅供信息分享,不构成对任何人的任何投资建议。用户与作者之间的任何争议,与本平台无关。如网页中刊载的文章或图片涉及侵权,请提供相关的权利证明和身份证明发送邮件到support@aicoin.com,本平台相关工作人员将会进行核查。