Cryptocurrency Circle Academician: On April 12, Ethereum's volume and price are well coordinated, the bullish trend continues, aiming straight for the previous high! Latest market analysis and thought reference
The current price of Ethereum is 2260. To be honest, Ethereum rose from 1736 to 2260, and the pullback in between could wash off 90% of people. It's not that they don't understand the trend, but they can't control themselves: panic to run when it rises a bit, hastily replenish when it falls a bit, and in the end, they miss out perfectly. The hardest thing in trading is not the prediction, but maintaining the right mindset. We do not seek to get rich overnight, only to earn money that we can understand, using discipline to counter emotions, and gradually becoming rich. Those who want to walk steadily together, please follow, we can supervise each other and make progress together.
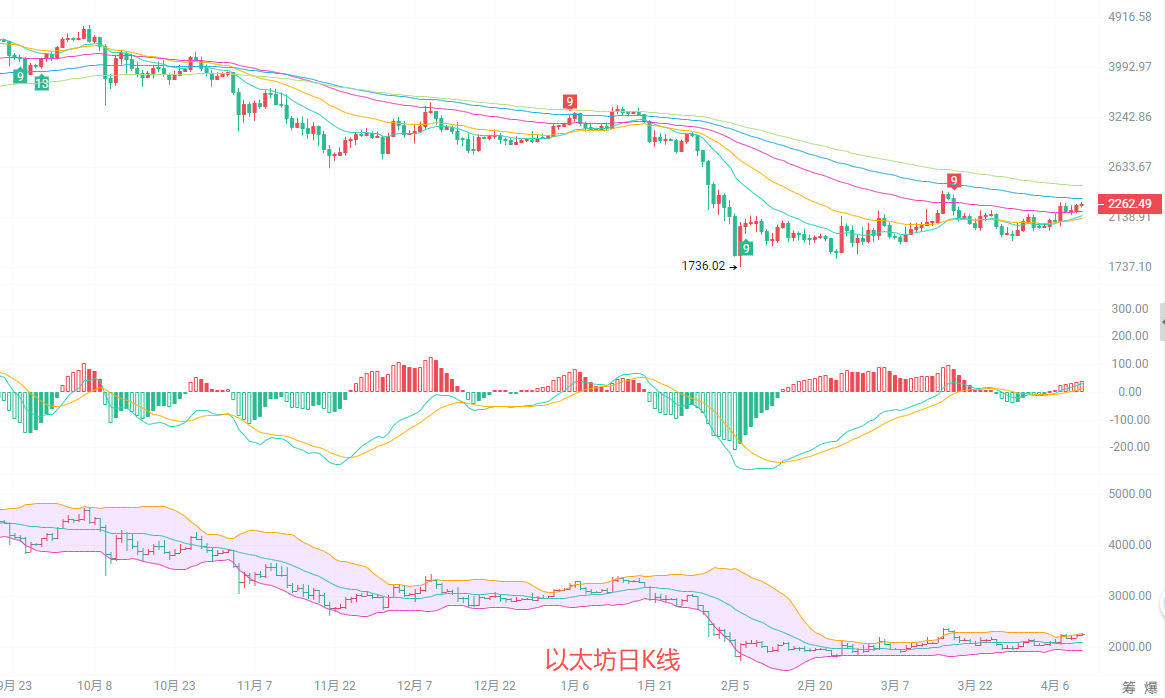
The daily K-line price stands above all moving averages, forming a northern arrangement, reversing the mid-term downward trend and entering a volatile upward channel. The MACD red bars continue to expand, with stable northern momentum. The middle track of the Bollinger Bands at 2113 serves as strong support, with the upper track at 2280 about to break, the overall trend is biased north, but the price is near the upper track of the Bollinger Bands, leading to short-term pullback demand; however, the pullback does not change the mid-term northward pattern, with strong support below and limited downward space.
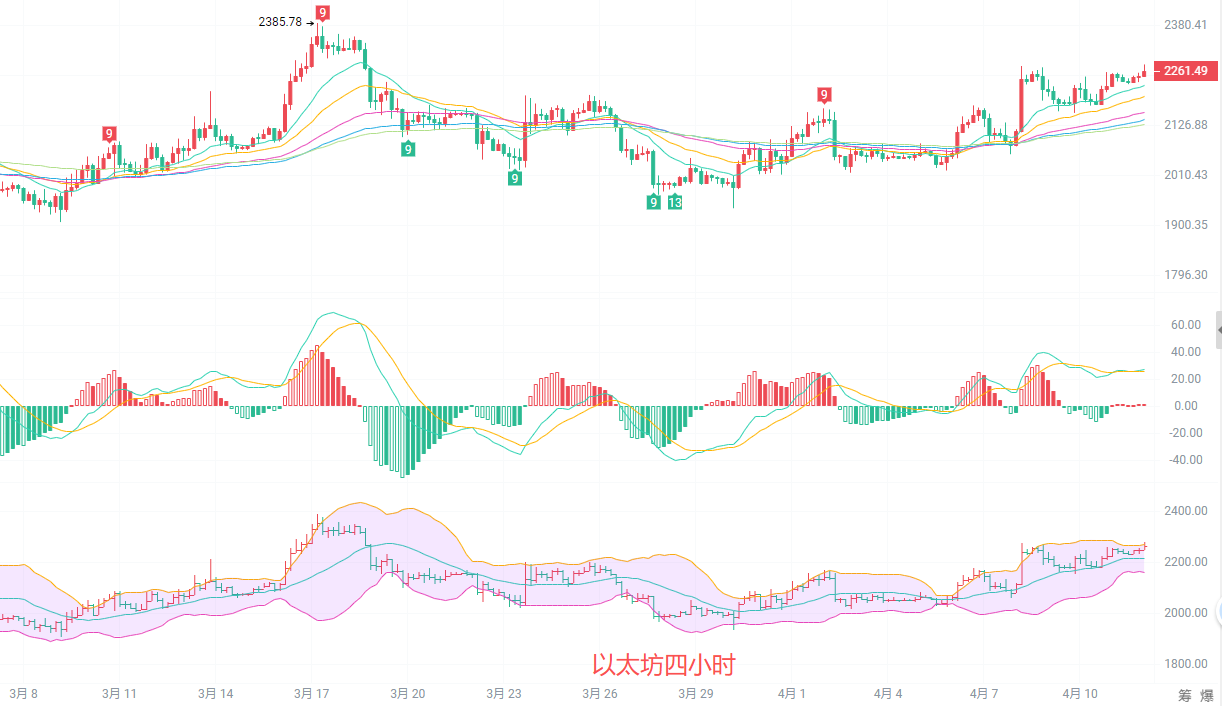
The four-hour price is fluctuating near the upper track of the Bollinger Bands, with a clear upward trend. The moving average system shows a northern arrangement, the MACD red bars are maintained, and northern momentum is still present. However, the price is at a high level, showing short-term pullback demand. The middle track at 2214 serves as strong support; if it doesn't break on the pullback, the upward trend will continue; if it breaks the middle track, it will enter a consolidation adjustment. The current market shows a strong fluctuation, and the pullback is an opportunity for low absorption.
Short-term reference: (Practical data has been updated, please consult the author for details)
If it rises from 2220 to 2230, stop loss at 2180, target looks at 2280 to 2300 and break out to look at 2350
If it cannot hold above 2300, it can lightly short downwards, stop loss at 2320, target at 2260
Specific operations should be based on real-time data from the market. For more information, please consult the author. The article may have delays in publication, so it is recommended for reference only and risks are borne by the reader.

Friendly Reminder: The above content is solely created by the author on the public account. The advertisements at the end of the article and in the comment area are not related to the author. Please identify with caution. Thank you for reading.
免责声明:本文章仅代表作者个人观点,不代表本平台的立场和观点。本文章仅供信息分享,不构成对任何人的任何投资建议。用户与作者之间的任何争议,与本平台无关。如网页中刊载的文章或图片涉及侵权,请提供相关的权利证明和身份证明发送邮件到support@aicoin.com,本平台相关工作人员将会进行核查。