Written by: @Murphychen888
We know that behind the chip structure is the behavioral logic of all market participants, which contains investors' sensitivity to price under various emotions (taking profits, pressure from losses, etc.) and the psychological changes of investors under this influence.
It can be said that this is one of the most effective methods to observe the true performance of the market from a god's eye perspective.
Recently, the price of BTC has been hovering between $66,000 and $69,000. From a macro perspective, this position is right in the middle of the chip structure's balance zone.
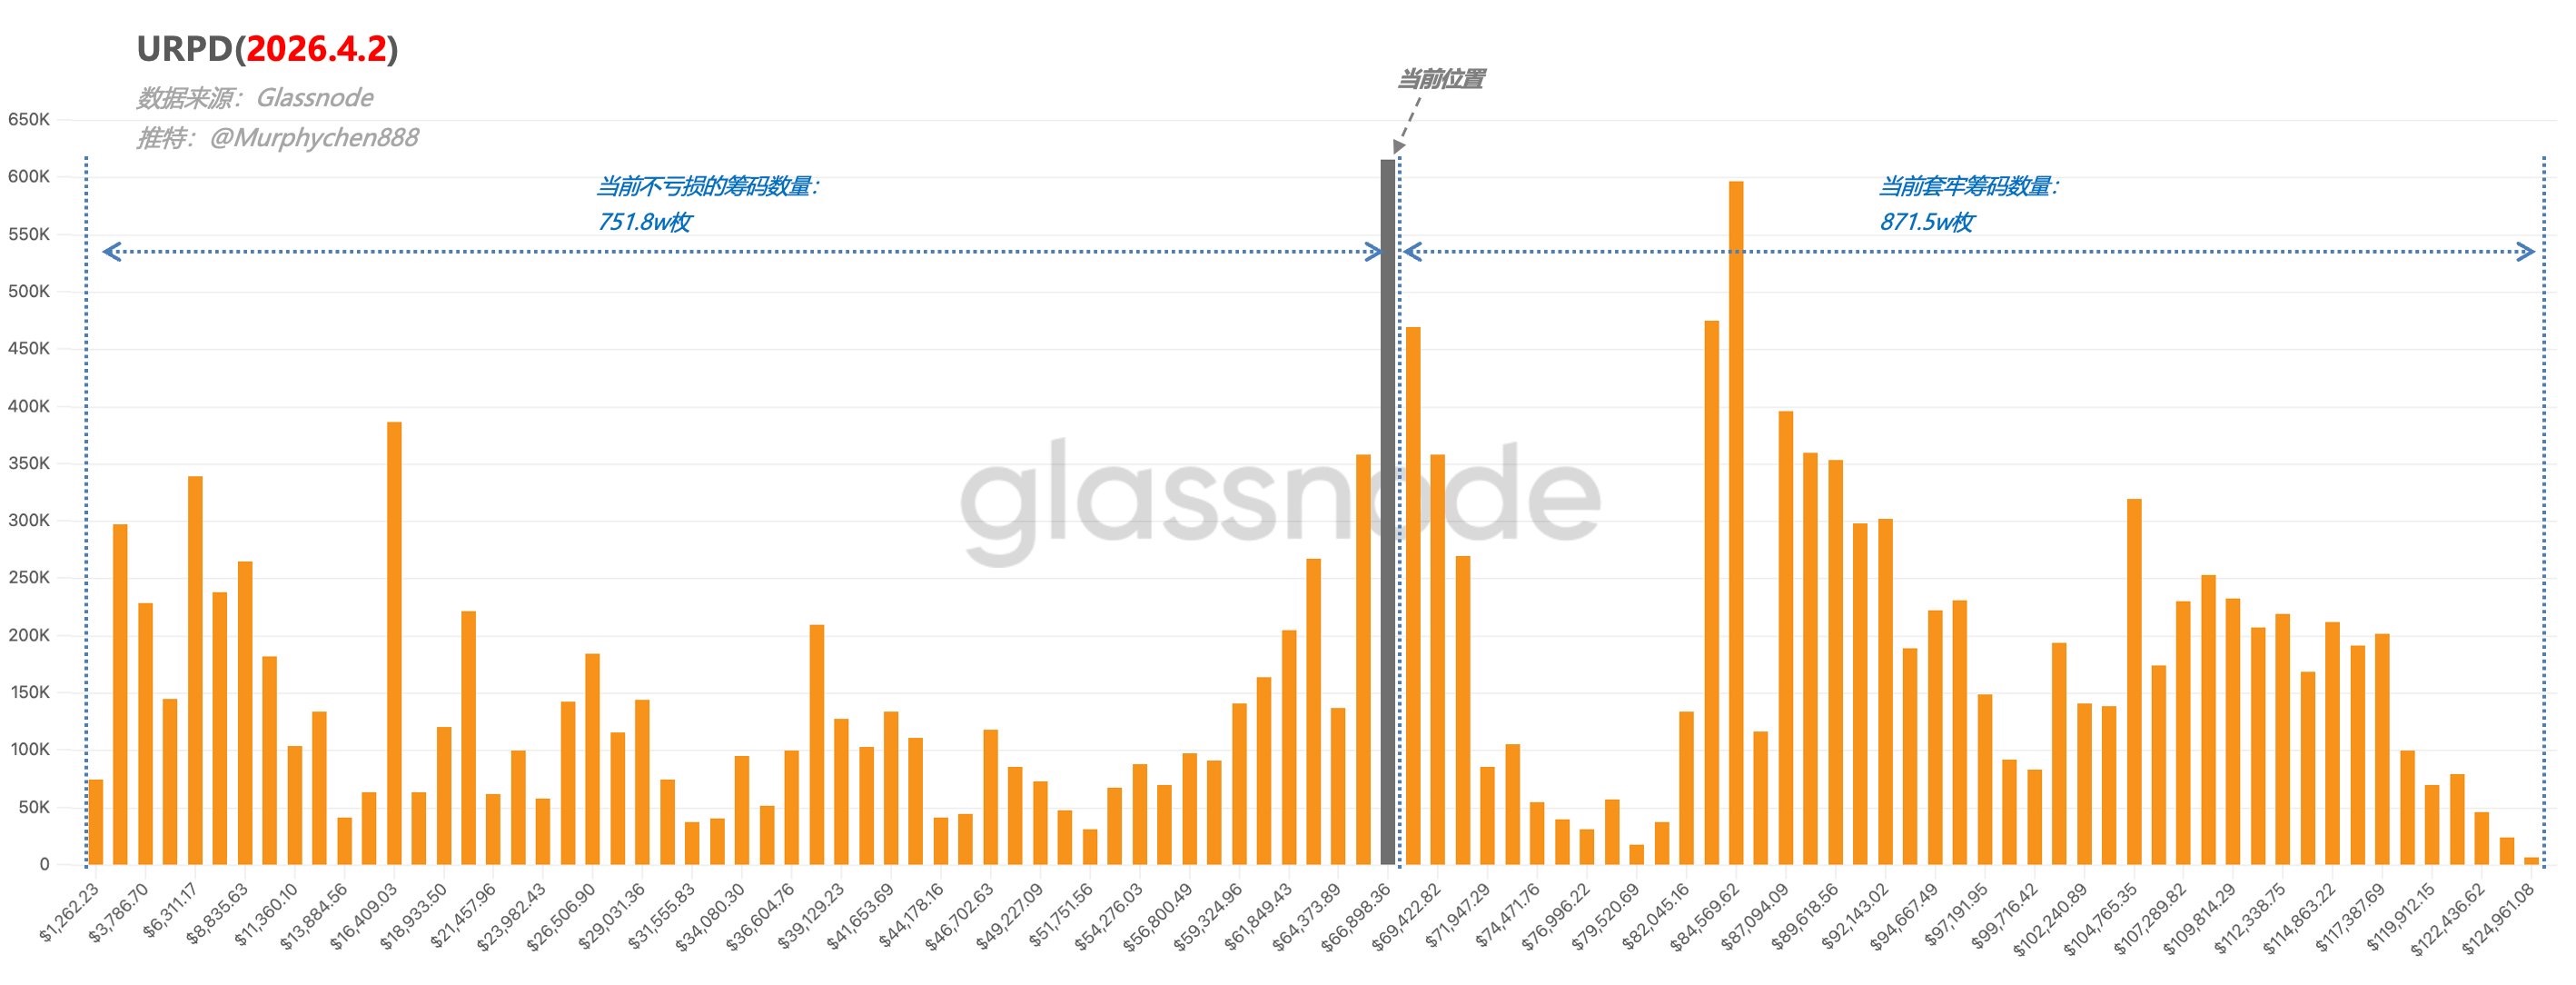
On the left are chips that still have a certain psychological advantage because they are currently not at a loss. If the price fluctuates between 66 and 69, their total number is roughly between 750,000 and 820,000 pieces.
On the right are anxious trapped chips, among which some are not strong enough; during price fluctuations or rebounds, they become the dominant force for selling pressure. During price fluctuations, their total number is roughly between 800,000 and 870,000 pieces.
The two sides of the scale are almost equal! This is a typical phase balance structure.
This structure has strong resilience, making it difficult to tilt suddenly, as the chips on both sides have reached a relatively stable state — those in profit feel there's no need to exit here, while those at a loss are reluctant to cut losses.
Therefore, this is why the previous low of 60,000 will be a level that is not easily broken.
Unless a major event disrupts this balance. Looking back at past cycles, the real bottoms of bear markets often appear after this balance structure is broken — when profit-taking is compressed and loss positions expand, it signifies the final purge of panic positions.
After looking at the macro level, let’s observe the movement of chips within various price ranges over the past three weeks to analyze the changes in market behavior and emotions.
March 11 - March 18
The price range of BTC was $70,000 to $80,000. During these 7 days, profit-taking chips decreased by 117,134 pieces; while loss-making chips decreased by 107,239 pieces. The total turnover was 227,000 pieces.
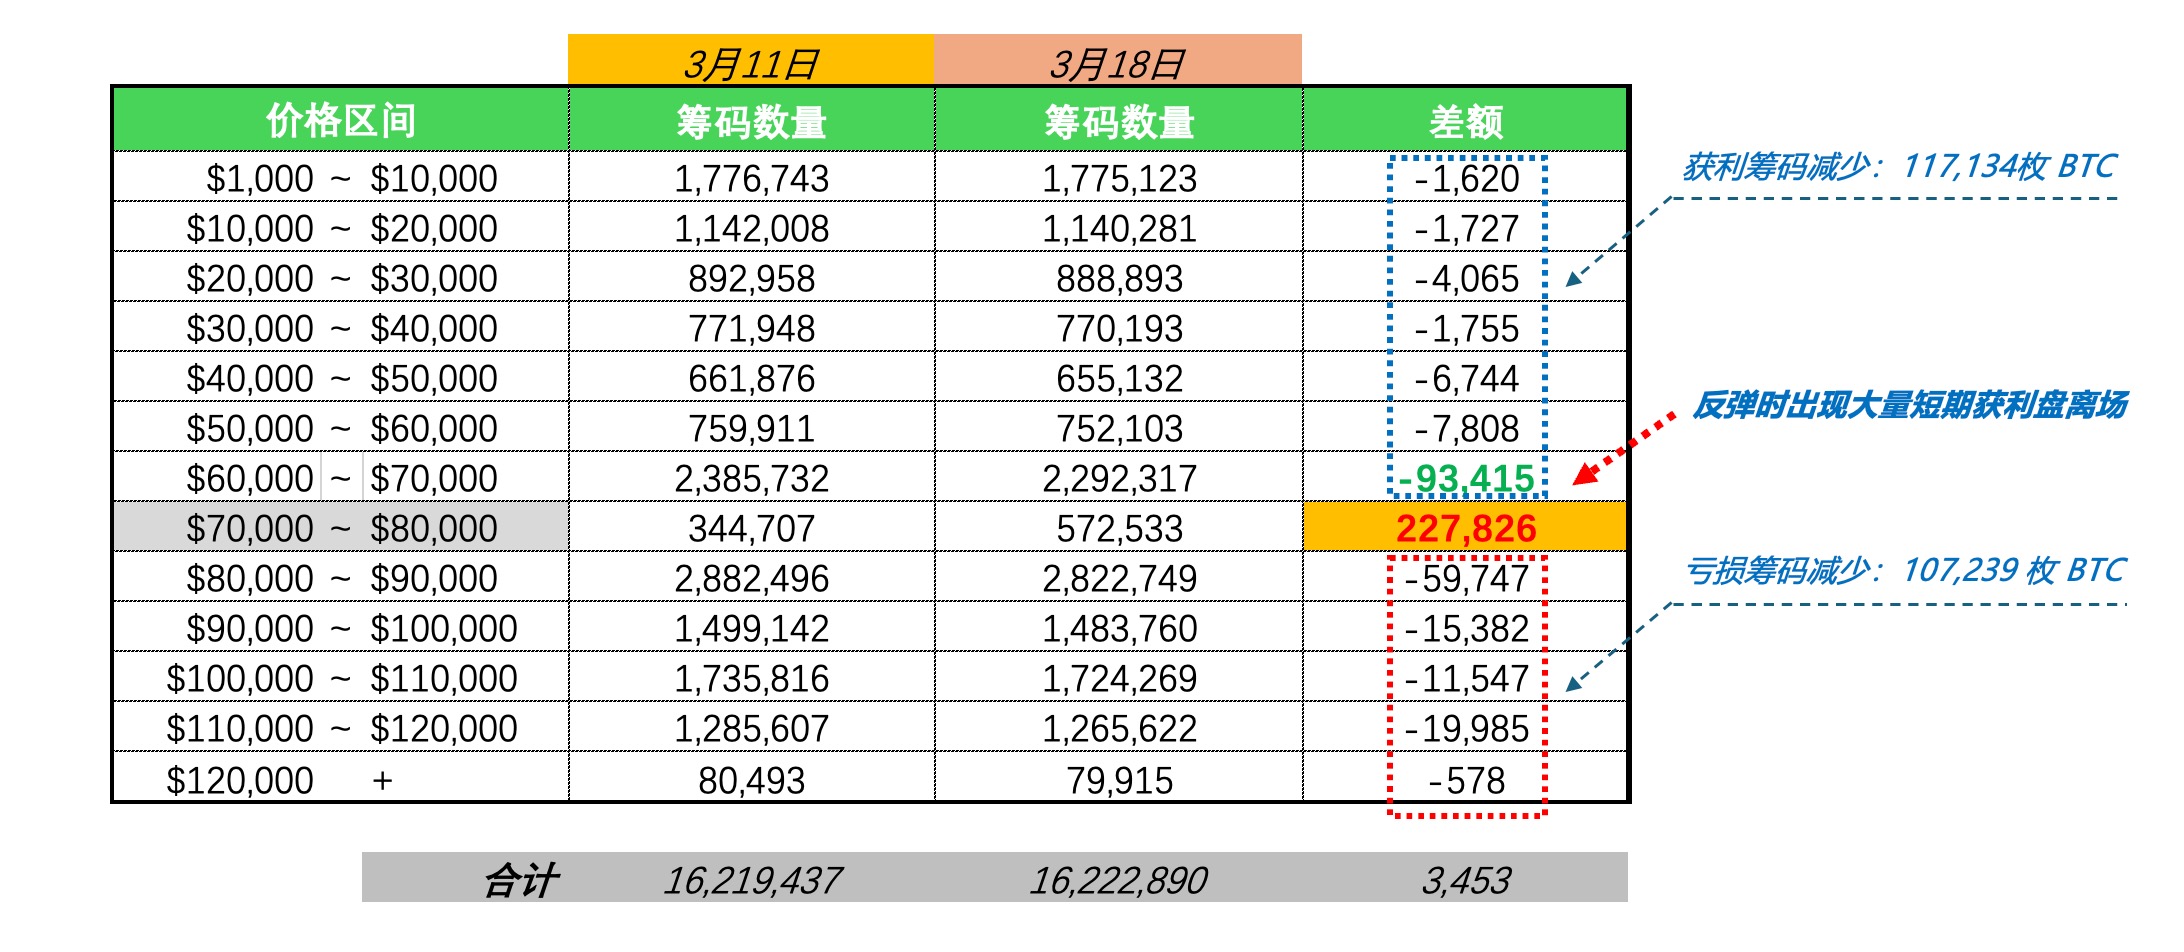
This is a relatively active data point, especially worth noting: when BTC rebounded to around $74,000, there was a sudden massive sell-off of chips that cost over 60,000, with 93,415 pieces standing out alarmingly compared to others.
This indicates that current market confidence is still in a severe deficit stage.
March 18 - March 25
This week, the price range of BTC was $60,000 to $70,000. Over these 7 days, profit-taking chips decreased by 24,113 pieces; loss-making chips decreased by 216,489 pieces. The total turnover was 246,000 pieces.
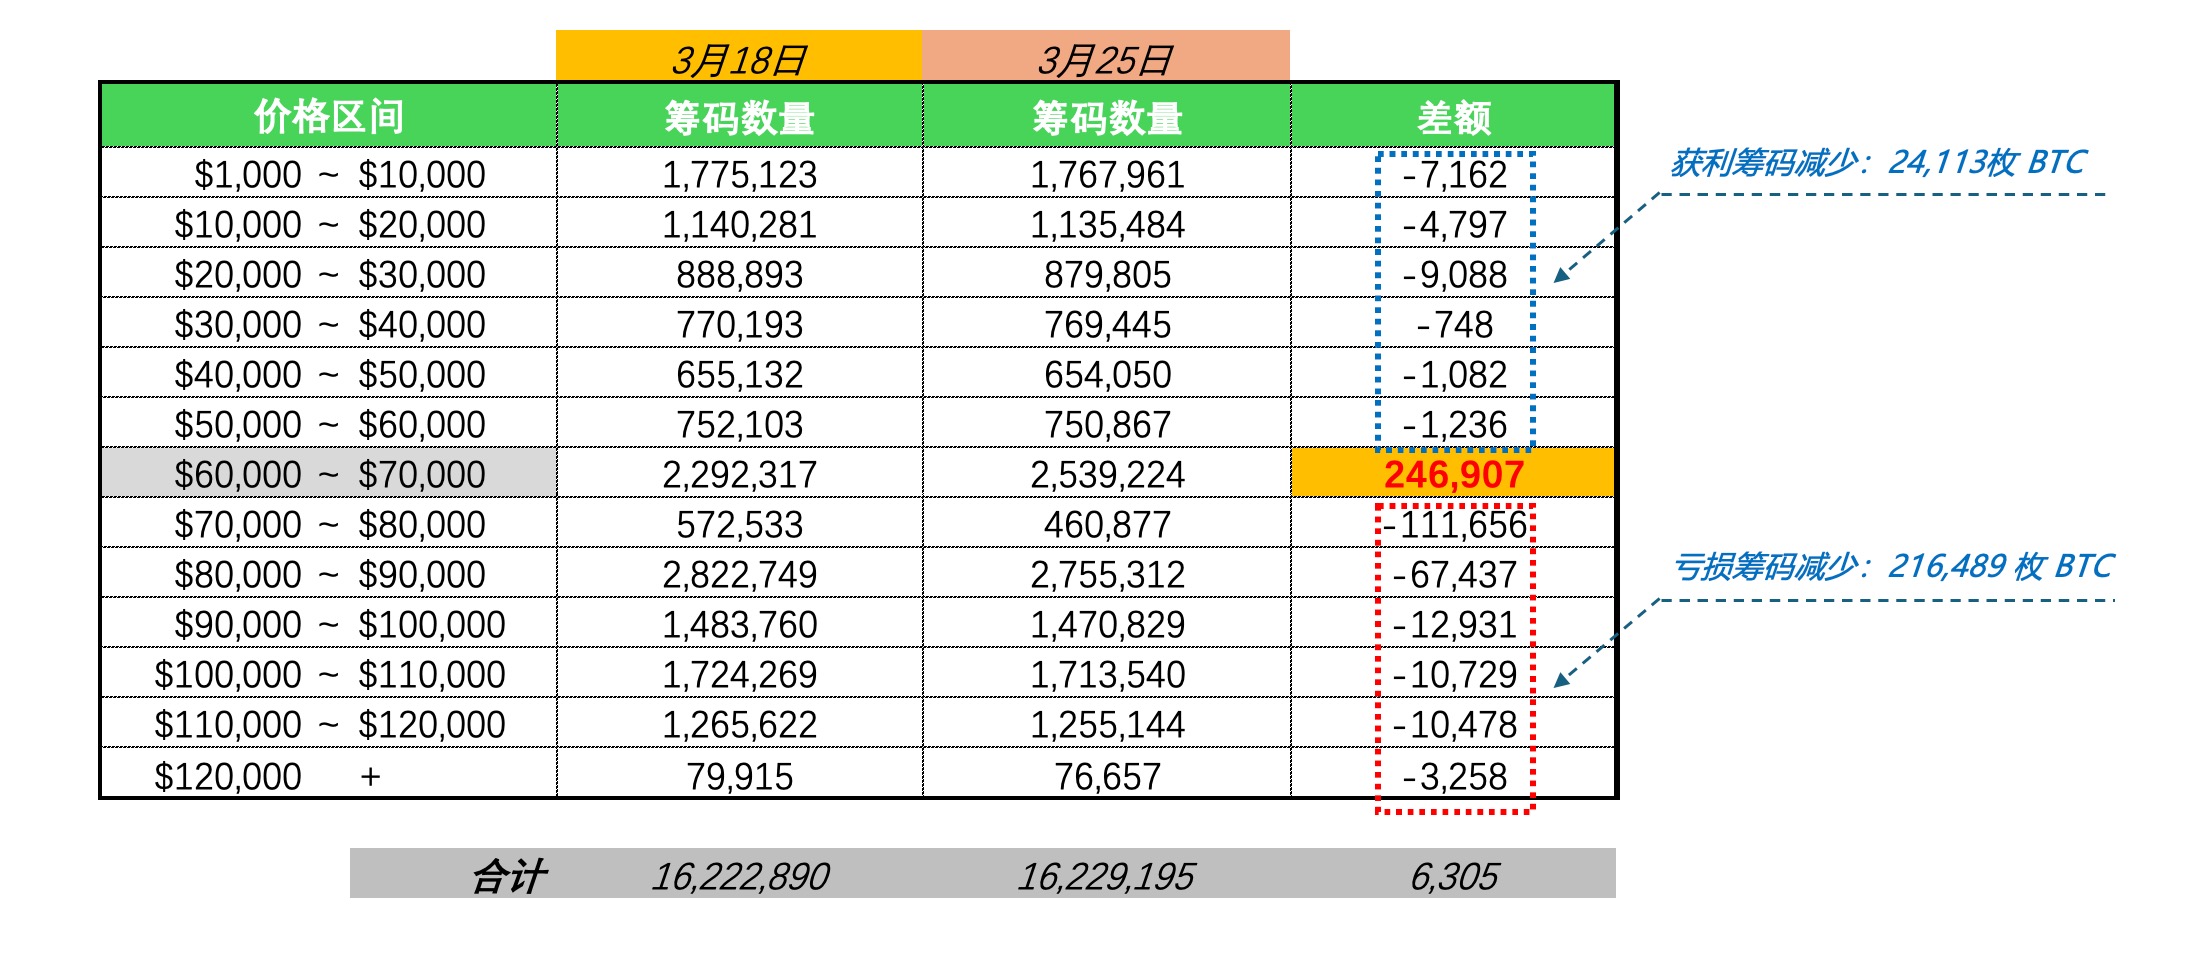
Although the total turnover remained roughly the same as the previous week, the number of profit-taking chips decreased significantly. Last week's data was due to a price rebound, with a large number of short-term profit-takers fleeing. This week, as the price declined, those who genuinely hold long-term positions were not as inclined to sell.
March 25 - April 2
In the past week, the price range of BTC was still $60,000 to $70,000. During these 7 days, profit-taking chips decreased by 19,597 pieces; loss-making chips decreased by 113,070 pieces. The total turnover was 137,000 pieces.
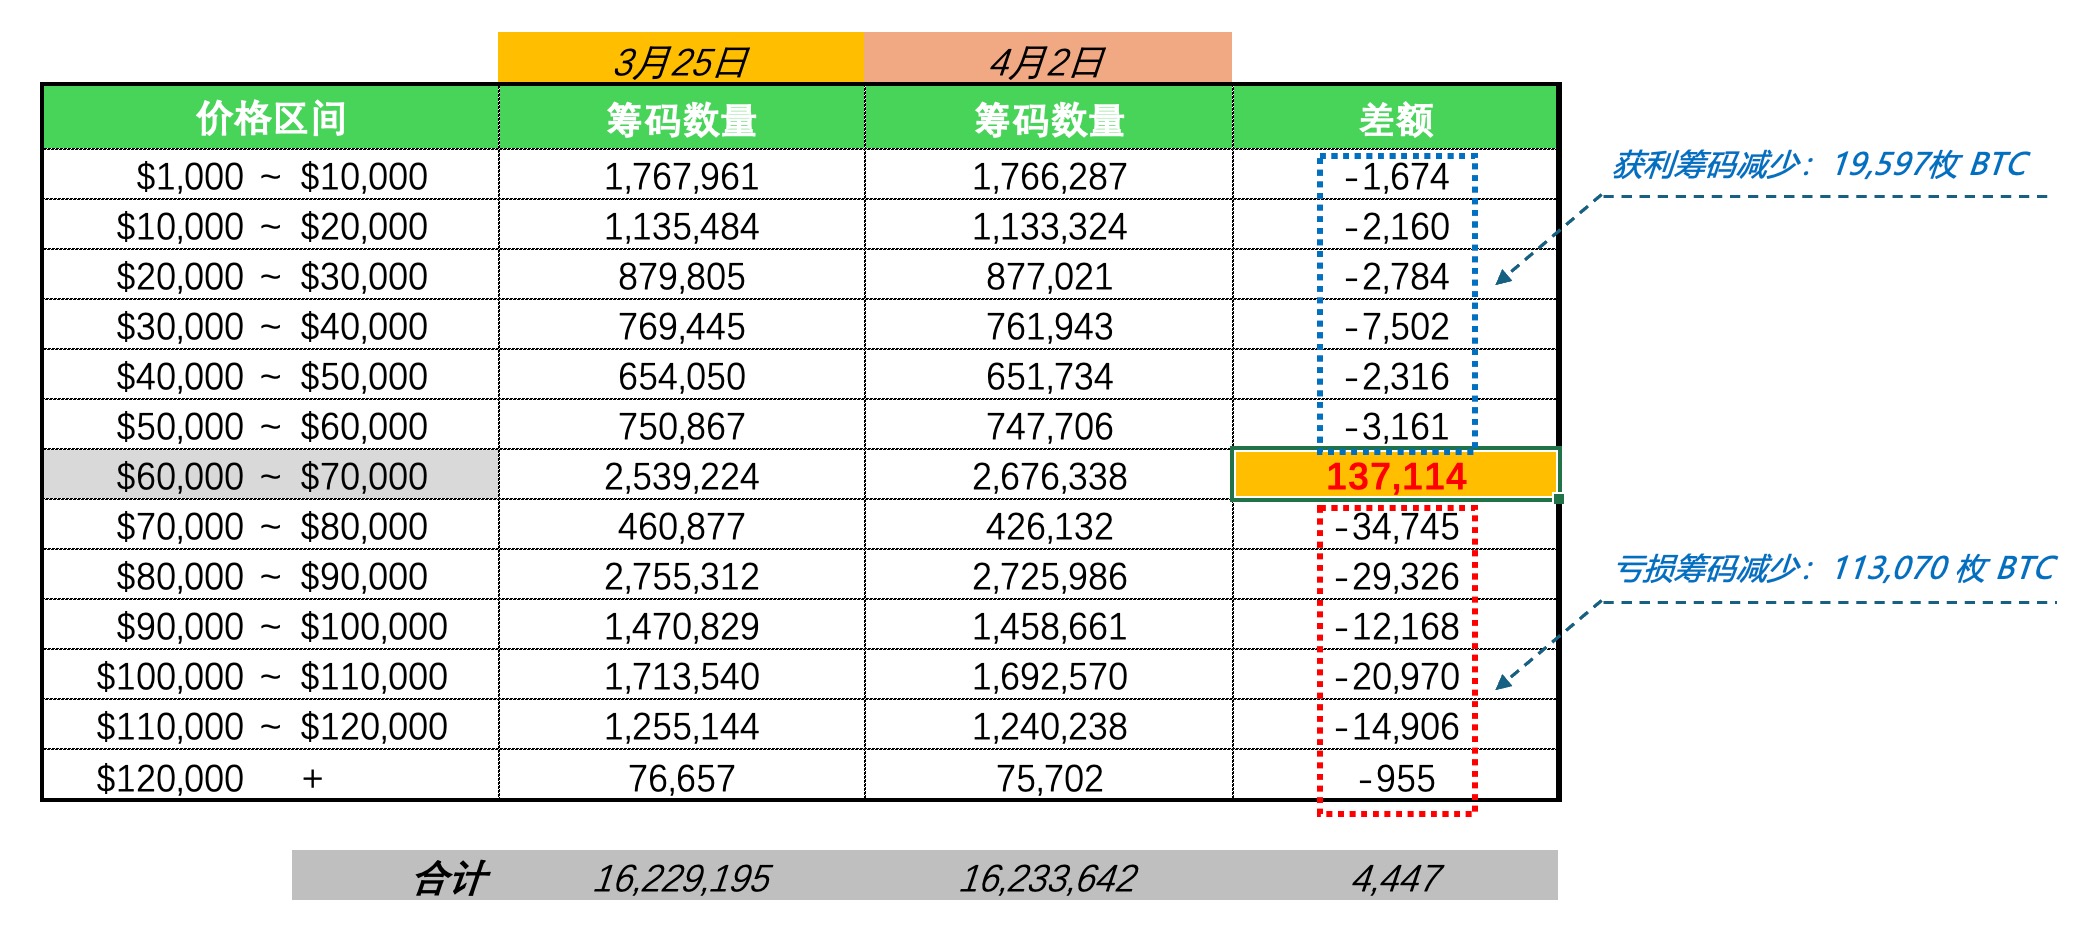
By comparing the data from the three weeks, we can see that the dominant selling pressure currently comes from the loss-making chips above. As mentioned earlier, their mindset is anxious; they are pained to cut losses and worry about being hit again.
It can be anticipated that if an event causes the balance to break, these anxious individuals will undoubtedly be the vanguard of any sell-off. Even if balance is maintained, the real bottom structure will only appear after they have completed their turnover (purge).
There is also another point worth noting:
This week’s total turnover has decreased by nearly 50% compared to the previous two weeks, indicating extremely reduced liquidity. This suggests that amid ongoing geopolitical conflicts and the spectacle of Trump, whether real or fake, the market is slowly beginning to grow weary.
What seems calm on the surface often hides undercurrents, which are typically the signs before a storm. When liquidity and volatility reach extreme lows, greater fluctuations are likely to follow.
But for us, this is both a risk and an opportunity!
免责声明:本文章仅代表作者个人观点,不代表本平台的立场和观点。本文章仅供信息分享,不构成对任何人的任何投资建议。用户与作者之间的任何争议,与本平台无关。如网页中刊载的文章或图片涉及侵权,请提供相关的权利证明和身份证明发送邮件到support@aicoin.com,本平台相关工作人员将会进行核查。


