Welcome to the Qinglan Crypto Class, I'm Sister Qinglan! Today, we will use the TPV three-point verification system to thoroughly analyze the market conditions, all practical insights!
Step 1: First, look at the big picture (multi-timeframe trend overview)
Let's take a look at the trend list for four timeframes:
Daily: Closing price 67190.28, price below MA5 (67279.40) and MA10 (67989.49), moving averages in a bearish arrangement. The long-term trend is weak and in a correction phase.
4-hour: Closing price 67190.28, price below MA5 (68222.42) and MA10 (68083.48), but MA5 is above MA10, moving averages in a bullish arrangement. The medium-term trend shows signs of stabilization, but the price is temporarily under pressure.
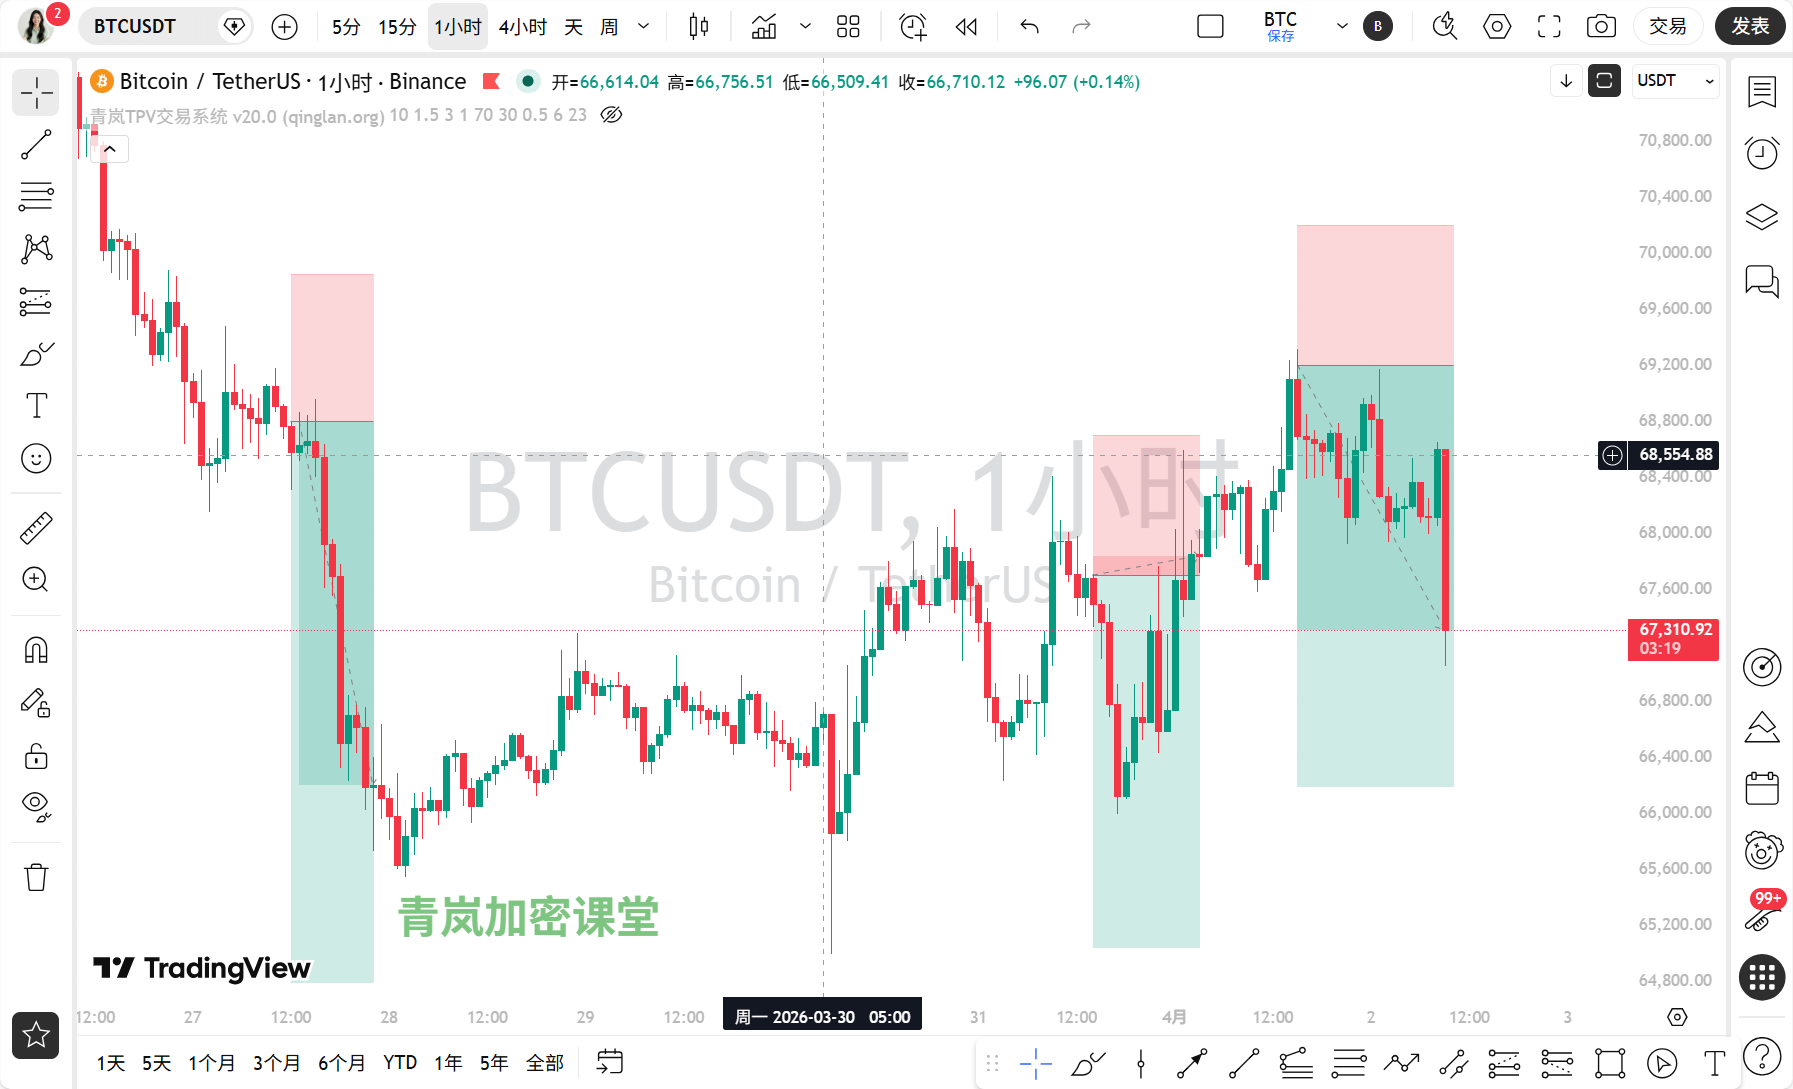
1-hour: Closing price 67190.28, price below MA5 (68078.00) and MA10 (68192.57), moving averages in a bearish arrangement. The short-term trend is clearly downward.
15-minute: Closing price 67190.28, price below MA5 (67737.95) and MA10 (67985.67), moving averages in a bearish arrangement. The ultra-short-term trend is downward.
Regarding market sentiment, on-chain data shows the fear and greed index is 12, indicating "extreme fear"! The total market cap is 2396188619218.6455 USD, with a 24-hour change of -0.65%. This indicates that market sentiment is very panicked, with funds flowing out, and this sentiment is affecting prices across all timeframes, especially with obvious short-term selling pressure. The news mentions "breaking below 68000" and "whale selling accelerating", which just confirms this panic sentiment.
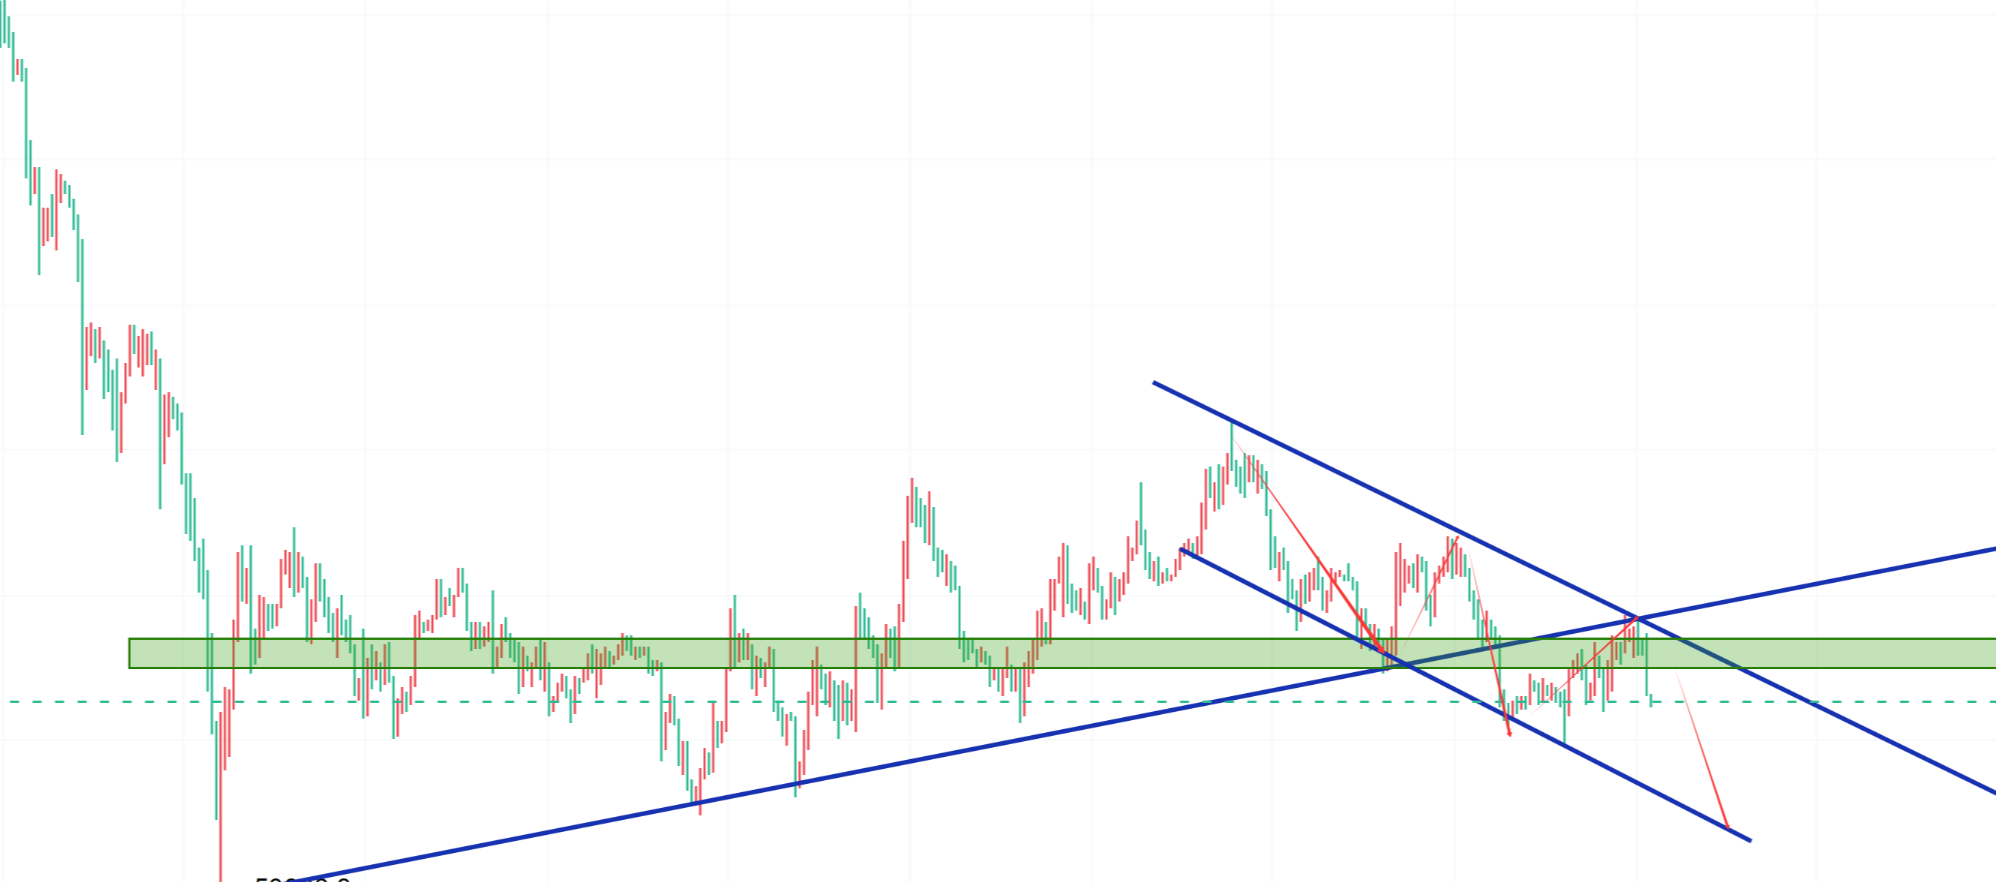
Step 2: Find support points, draw key lines (valid high and low points + trendline)
Let's find the key highs and lows:
Daily: Recent valid high is 68653.38 (from the 1-hour highest price sequence), valid low is 67050.84 (from the 1-hour lowest price sequence). The price is testing near the low point.
4-hour: Valid high is 69171.77 (from the 4-hour highest price sequence), valid low is 67050.84 (from the 4-hour lowest price sequence). This has formed a descending channel.
1-hour: Valid high is 68653.38 (from the 1-hour highest price sequence), valid low is 67050.84 (from the 1-hour lowest price sequence). The short-term descending trend is clear.
15-minute: Valid high is 68600.29 (from the 15-minute closing price sequence), valid low is 67190.28 (latest closing price). A new low point is forming.
Based on these support points, a key descending trendline can be drawn, connecting points like 68653.38 and 68600.29. Currently, the price is operating below the trendline, indicating bears are dominant. The event of "breaking below 68000" occurred during this descending trend, reinforcing the pressure at the support lows.
Step 3: Indicators to assist (technical indicator verification)
Let's see what the indicators say:
15-minute: MACD DIF is -190.09, DEA is -84.17, histogram is -105.92, no crossover, momentum is bearish. RSI is 28.36, near the oversold zone, indicating the short-term decline is quite aggressive.
1-hour: MACD DIF is -7.43, DEA is 118.42, histogram is -125.86, no crossover, strong bearish momentum. RSI is 33.65, in the weak zone, but not extremely oversold.
4-hour: MACD DIF is 143.09, DEA is 73.16, histogram is 69.93, no crossover, bullish momentum still exists. RSI is 55.03, neutral and slightly strong. There is a divergence here with the price decline, indicating potential bullish resistance in the medium term.
Daily: MACD DIF is -713.14, DEA is -445.48, histogram is -267.66, no crossover, strong bearish momentum. RSI is 41.49, neutral and slightly weak.
The indicators confirm a short-term downward trend, but the bullish momentum divergence at the 4-hour level with price decline is a key signal that we should pay close attention to!
Step 4: Long and short arm wrestling (news + on-chain)
News:
Positive factors: Daily net inflow of 1752 BTC into U.S. Bitcoin ETFs; SEC approves NYSE listing of multiple cryptocurrency trust options, relaxing investment thresholds; BlackRock has nearly 100 million USD BTC flowing out from Coinbase (possibly indicating institutional accumulation).
Negative factors: Acceleration of whale selling; BTC's short-term sharp decline breaking below 68000 USD; Riot Platforms suspected to sell 500 BTC; Solana ecosystem projects suffer significant losses from a hacker attack.
The most critical core factors are "whale selling" and "extreme market fear sentiment", leading to short-term selling pressure. Currently, both technicals and the news resonate downwards, and the panic sentiment amplifies the technical selling pressure.On-chain data:
The fear and greed index is only 12, extreme fear! The total market cap is shrinking (24 hours -0.65%). This indicates that market sentiment is very poor, with funds flowing out. The on-chain data and the downward trend in technicals form a strong resonance, both pointing towards bear dominance.
Step 5: The path of least resistance (trading strategy)
In summary, the current path of least resistance is still downwards. However, due to the bullish divergence in the 4-hour MACD and the extreme panic market sentiment, we should be wary of an oversold rebound.
Key entry area (shorting): If there is a rebound to the key resistance level near 68000 (reference to recent high point area) and momentum is insufficient, it can be considered.
Stop loss basis: Place above the descending trendline, such as above 68600.
Target area: Look towards recent valid low near 67050.84, or even lower.
Today's trading idea: Focus on shorting on rebounds, but do not excessively pursue shorts, as sentiment indicators have reached extremes.
Step 6: How will it unfold today (market prediction)
Current (within a few hours): Expected to weakly fluctuate between 67050 and 68000, with a possibility of rebound testing resistance, but the strength may be limited.
Key for today and in the near term: The most important support level is 67050.84, if broken, the space for decline may open up. The most important resistance level is the area around 68000 and the descending trendline (around 68500-68600).
Trading idea: The currently most suitable direction for trading is to wait for a rebound before shorting at highs. Reason: Main timeframe trend is down, panic sentiment prevails, and the news is mostly bearish, a rebound to the key resistance level presents a relatively good risk-reward opportunity for shorts.
Summary: The core contradiction in the current market is the selling pressure under extreme panic sentiment versus the potential rebound strength implied by the mid-term technical indicators' divergence.
Trading quote: When "fear" becomes a news headline, the market is often brewing an emotional turning point, but the turning point requires confirmation from the price.
[Qinglan TPV Trading System Backtest Data]
Based on nearly 508 historical backtests (sample size 519), the accuracy rate is 71.7% (last backtest time 04-01 09:00:37). Backtest results are for strategy confidence reference only, past performance does not guarantee future returns.
[Qinglan's Personal Opinion]
Oh, seeing the fear index at 12 made Sister Qinglan's heart tighten, the market is indeed cold as ice. During such times, irrational selling is most likely to happen, but it is also when we need to closely monitor critical positions. That MACD divergence on the 4-hour chart is like a little flame, cannot be ignored, but we should not go against the trend recklessly. My takeaway is to wait for a rebound, wait for a signal of bullish weakness before taking action, so we can sleep more soundly. Remember, the market is always right, and what we need to do is follow and respond.
This TPV system has been honed over the years through market watching, reviewing, and practical experience. I can't say it's 100% accurate, but at least it can provide us with more confidence at critical positions. If you want to be the first to receive the latest entry opportunities captured by my TPV system, welcome to the Qinglan Crypto Class official website www.qinglan.org, see you in class~
免责声明:本文章仅代表作者个人观点,不代表本平台的立场和观点。本文章仅供信息分享,不构成对任何人的任何投资建议。用户与作者之间的任何争议,与本平台无关。如网页中刊载的文章或图片涉及侵权,请提供相关的权利证明和身份证明发送邮件到support@aicoin.com,本平台相关工作人员将会进行核查。