
TL, DR
- The macro environment in March is generally bearish: The Federal Reserve maintains interest rates unchanged while releasing hawkish signals, sticky inflation, rising oil prices, and weakening employment strengthen concerns about "stagflation," with interest rate cut expectations notably pushed back; at the same time, U.S. stocks weaken amidst repeated tariffs and geopolitical risks, putting pressure on risk assets overall. Looking ahead to April, the market will continue to grapple with inflation, non-farm jobs, and policy paths; although the crypto market is lifted by clearer regulatory margins, it still faces macro and political pressures.
- The March trading volume showed a "pulsing increase followed by a rapid retreat," with multiple instances of extreme fluctuations yet a lack of sustainability, indicating that funds primarily drive short-term trading; the overall market capitalization experienced moderate fluctuations, peaking in mid-March before falling back to the range of $2.45 trillion to $2.50 trillion, with overall momentum lacking.
- In March, BTC and ETH spot ETFs both transitioned from net outflows to net inflows, with asset scales and prices rebounding simultaneously; ETH showed stronger capital inflow and price elasticity, reflecting a marginal recovery in risk appetite, with funds replenishing to high volatility assets; at the same time, the total amount of stablecoins shifted from contraction to mild expansion, but distinctly concentrated in the leading assets, indicating that while new liquidity is flowing back into the market, it remains in a cautious recovery phase rather than a comprehensive risk expansion stage.
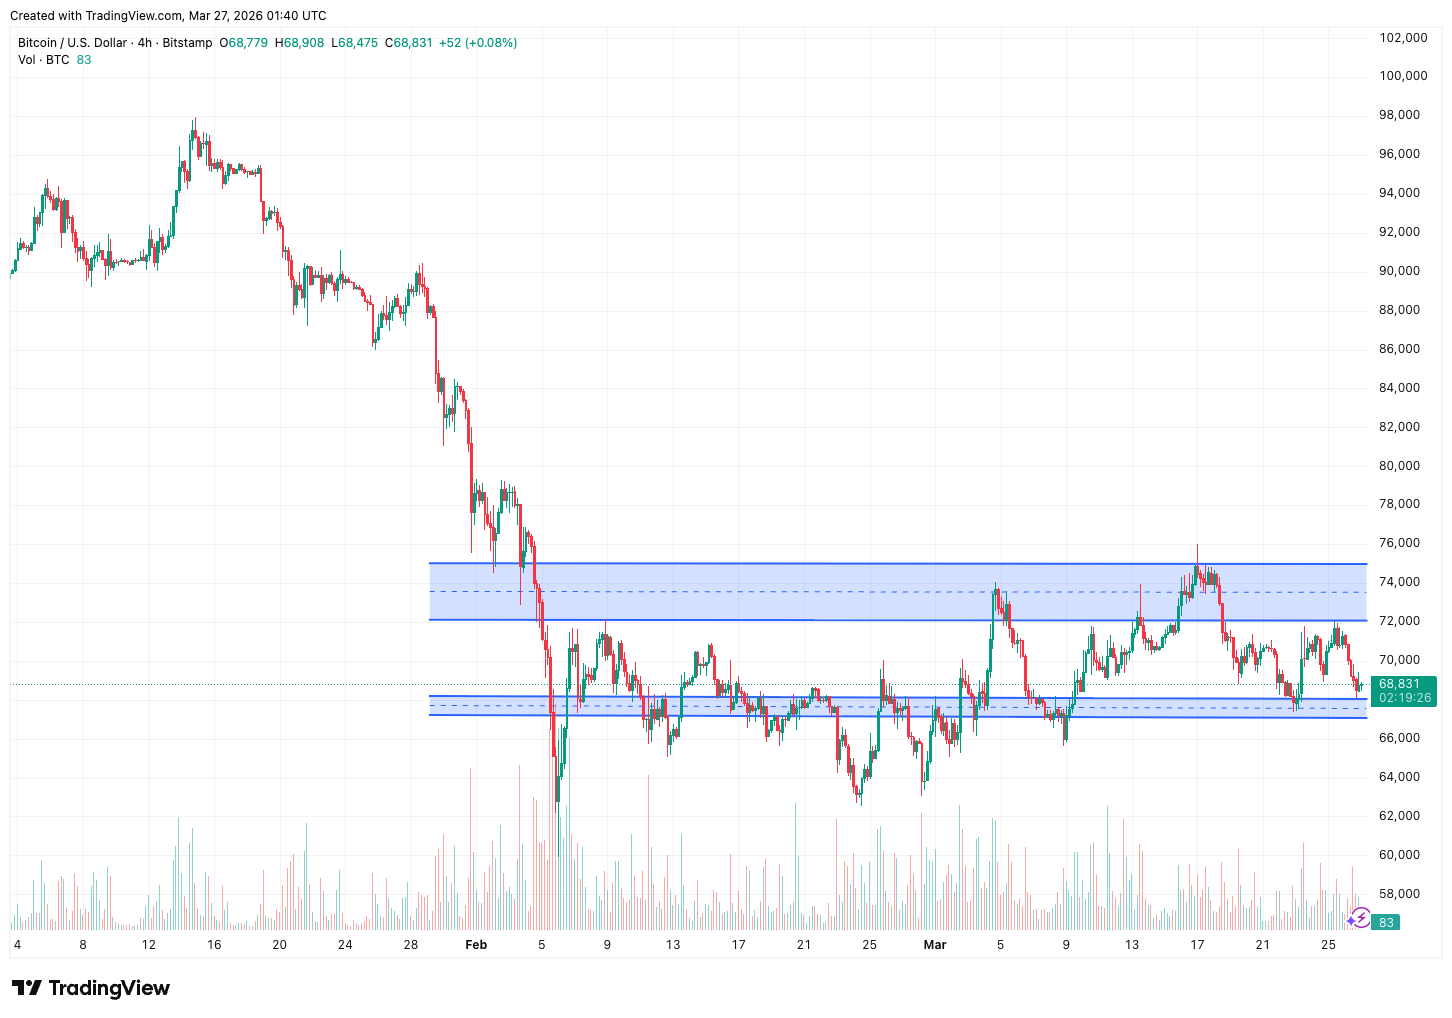
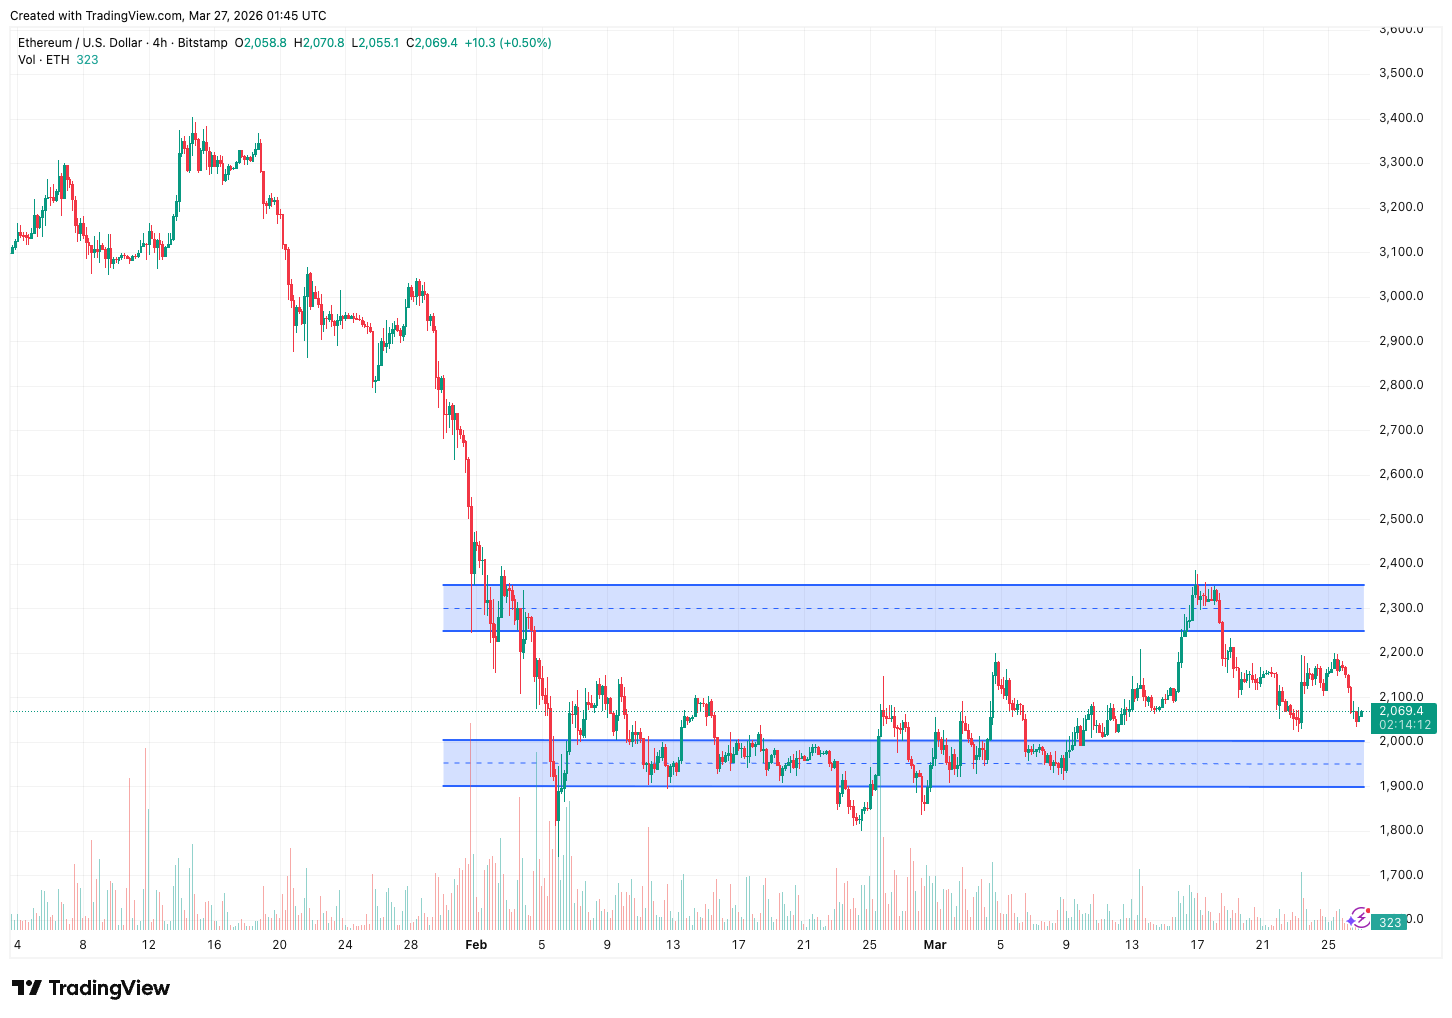
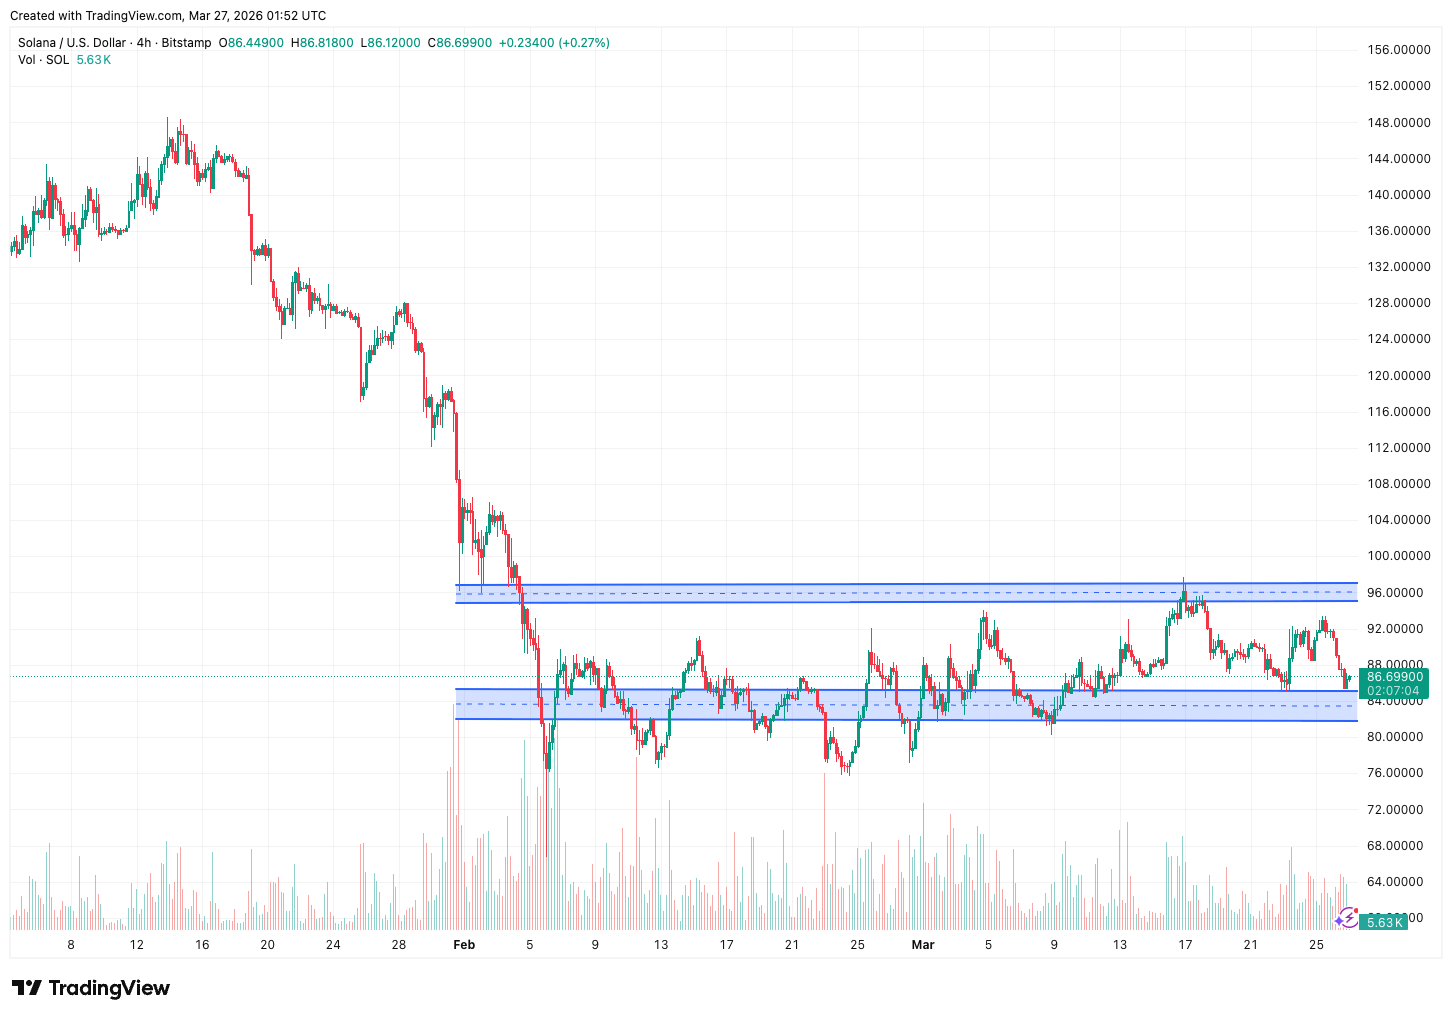
- In March, BTC oscillated within the range of $62,000–$74,000, currently around $69,000–$71,000, generally between the $65,000–$67,000 support level and the $72,000–$75,000 resistance; directional breakthroughs still require a conducive macro environment; ETH performed relatively weakly, mainly oscillating in the $1,900–$2,200 range, temporarily suppressed by ETF capital slowing and the hawkish stance of the FOMC, needing to establish itself above $2,200 to signal a strengthening; SOL performed relatively well, running in the $82–$97 range, currently around $88–$92, maintaining an oscillating pattern, with short-term focus on the breakthrough of $82 support and $95–$97 resistance.
- The SEC and CFTC jointly established a framework for classifying digital assets, explicitly categorizing BTC, ETH, and 16 other mainstream assets as "digital commodities," and proposed the "Token Safe Harbor" concept, marking a significant alleviation of regulatory uncertainty and providing a key legal foundation for institutional entry. Meanwhile, BlackRock launched an Ethereum ETF (ETHB) that distributes staking rewards, pushing crypto ETFs from a pricing tool to an income-generating asset; however, security incidents like Resolv highlight that industry risks are shifting from on-chain vulnerabilities to off-chain infrastructure and private key management, further emphasizing the importance of security systems.
- April will be a critical time window for crypto regulation and legislation; if the CLARITY Act can achieve breakthroughs in the committee stage and advance to voting, it will create a complete regulatory loop alongside the SEC/CFTC classification framework, significantly enhancing policy certainty for institutional entry; conversely, if progress is blocked, market sentiment may face temporary pressure. At the same time, the Ethereum Glamsterdam upgrade enters a critical testing phase, compounded by expectations of expanding the staking ETF ecosystem, which will provide support for ETH's mid-term fundamentals and strengthen the long-term logic for institutional participation in the Ethereum network.
1. Macroeconomic Perspective
Policy Direction
On March 18, the Federal Reserve's FOMC held its second policy meeting of the year, maintaining the federal funds target rate within the unchanged range of 3.50%–3.75%. The most notable aspect of this meeting to the market was the dot plot and Powell's hawkish language at the press conference—the dot plot shows that the median expectation for interest rate cuts within 2026 remains at one, but the divergence among committee members regarding the interest rate cut path has significantly widened (some members even expect no rate cuts). Powell emphasized the non-linear characteristics of the inflation decline process and warned of the persistent inflation risks potentially posed by tariffs and energy prices, clearly stating that the policy committee is not in a hurry to take action and will remain cautiously observant until inflation and employment data provide clear signals. The Federal Reserve raised the 2026 PCE inflation expectations to about 2.7%, higher than prior expectations, further suppressing the market's pricing for a rapid interest rate cut within the year, causing risk assets including cryptocurrencies to feel pressure in late March.
U.S. Stock Performance
In March, U.S. stocks showed a generally downward trend, significantly weaker than early in the year. In late February, U.S. trade policy tightened again, leading to repeated market speculation surrounding tariff policy uncertainty, temporarily weighing on risk appetite. As March began, the geopolitical tensions between the U.S. and Iran continued to escalate, with Brent crude oil prices temporarily breaking through $100 per barrel, reaching their highest levels in recent years, compounded by several institutions issuing recession warnings, which markedly deteriorated market sentiment; by mid-March, the S&P 500 experienced a phase retreat, showing a noticeable correction from its early-year peak, with the VIX fear index rising rapidly, reflecting a shift from tactical profit-taking by institutions to a broader defensive approach to risk. Within the technology sector, there was continued differentiation, with AI computing power and infrastructure being relatively resilient, while traditional software, fintech, and other sectors experienced valuation re-evaluation pressure, maintaining a high overall risk premium.
Inflation Data
On March 11, the U.S. Bureau of Labor Statistics announced February 2026 CPI data: CPI rose 2.4% year-on-year, unchanged from January, and increased 0.3% month-on-month; Core CPI (excluding food and energy) increased by 2.5% year-on-year, and 0.2% month-on-month, both in line with market expectations. Overall, inflation data stayed above the Federal Reserve's 2% target without further rising. Notably, service sector inflation remains sticky, and conflicts in the Middle East have driven oil prices up rapidly, with Brent oil prices breaking $100, creating renewed upward pressure on energy inflation. Thus, the Federal Reserve raised its inflation forecast at the March FOMC meeting, acknowledging that the "final mile" task is more challenging than expected, increasing the necessity of maintaining high rates in the short term.
Employment Data
On March 1, the U.S. Department of Labor released the February 2026 non-farm payroll report, showing that non-farm payrolls unexpectedly decreased by about 90,000, marking a rare negative growth post-pandemic, significantly weaker than market expectations; the unemployment rate rose to about 4.4%, with labor force participation slightly declining. The decline in employment was mainly influenced by strikes, fluctuations in government sectors, and slowdown in corporate hiring. The unexpected weakness in the job market somewhat supports interest rate cut expectations, but the coexistence of sticky inflation and a decline in employment indicates a "stagflation signal" that places the Federal Reserve in a dilemma: cutting rates might fuel inflation, while inaction could exacerbate economic downturns. The market has shifted the expected timing for the first rate cut of the year to a significant degree towards the second half.
Political Factors
In March, multiple uncertainties at the political and policy levels intertwined, significantly affecting market sentiment. U.S. trade policies continued to fluctuate, and the uncertainty regarding tariffs disrupted corporate profits and supply chains. Meanwhile, the escalating geopolitical situation between the U.S. and Iran constituted the main external risk for this period, as oil prices breaking $100 directly raised inflation expectations and suppressed consumer confidence. In the crypto realm, regulators are still advancing discussions on asset classification and legislative frameworks, maintaining a certain level of optimistic expectations towards长期合规化 in the process, but in the short term, macro factors continue to dominate pricing. Gold prices further increased during this time, maintaining near historical highs, reflecting that risk aversion remains strong. Overall, geopolitical risks, tariff uncertainties, and a hawkish stance from the FOMC constitute triple pressures, leading to a generally negative impact from political factors on crypto market sentiment.
Outlook for the Next Month
Looking ahead to April, the market will focus on CPI and PCE inflation data for March, along with the March non-farm payroll report, as these data will directly impact the Federal Reserve's policy judgment at the May FOMC meeting. Notably, the employment weakening in February coupled with oil prices breaking through $100 has made concerns of "stagflation" the core narrative in the market; if the March data follows this trend, risk assets will continue to face pressure. The direction of the U.S.-Iran geopolitical situation is also a key variable in April; if the situation further escalates, rising oil prices will strengthen inflation stickiness and exacerbate market volatility. Additionally, Federal Reserve Chairman Powell's term will end in May 2026, and the uncertainty surrounding his successor will gradually become a market focus. In terms of crypto assets, the regulatory legislative process (such as the progress of the CLARITY Act) and the capital flow of BTC spot ETFs remain core observation variables; whether BTC can hold key support levels and maintain net inflows will determine the direction of the market in the next phase.
2. Overview of the Crypto Market
Currency Data Analysis
Trading Volume & Daily Growth Rate
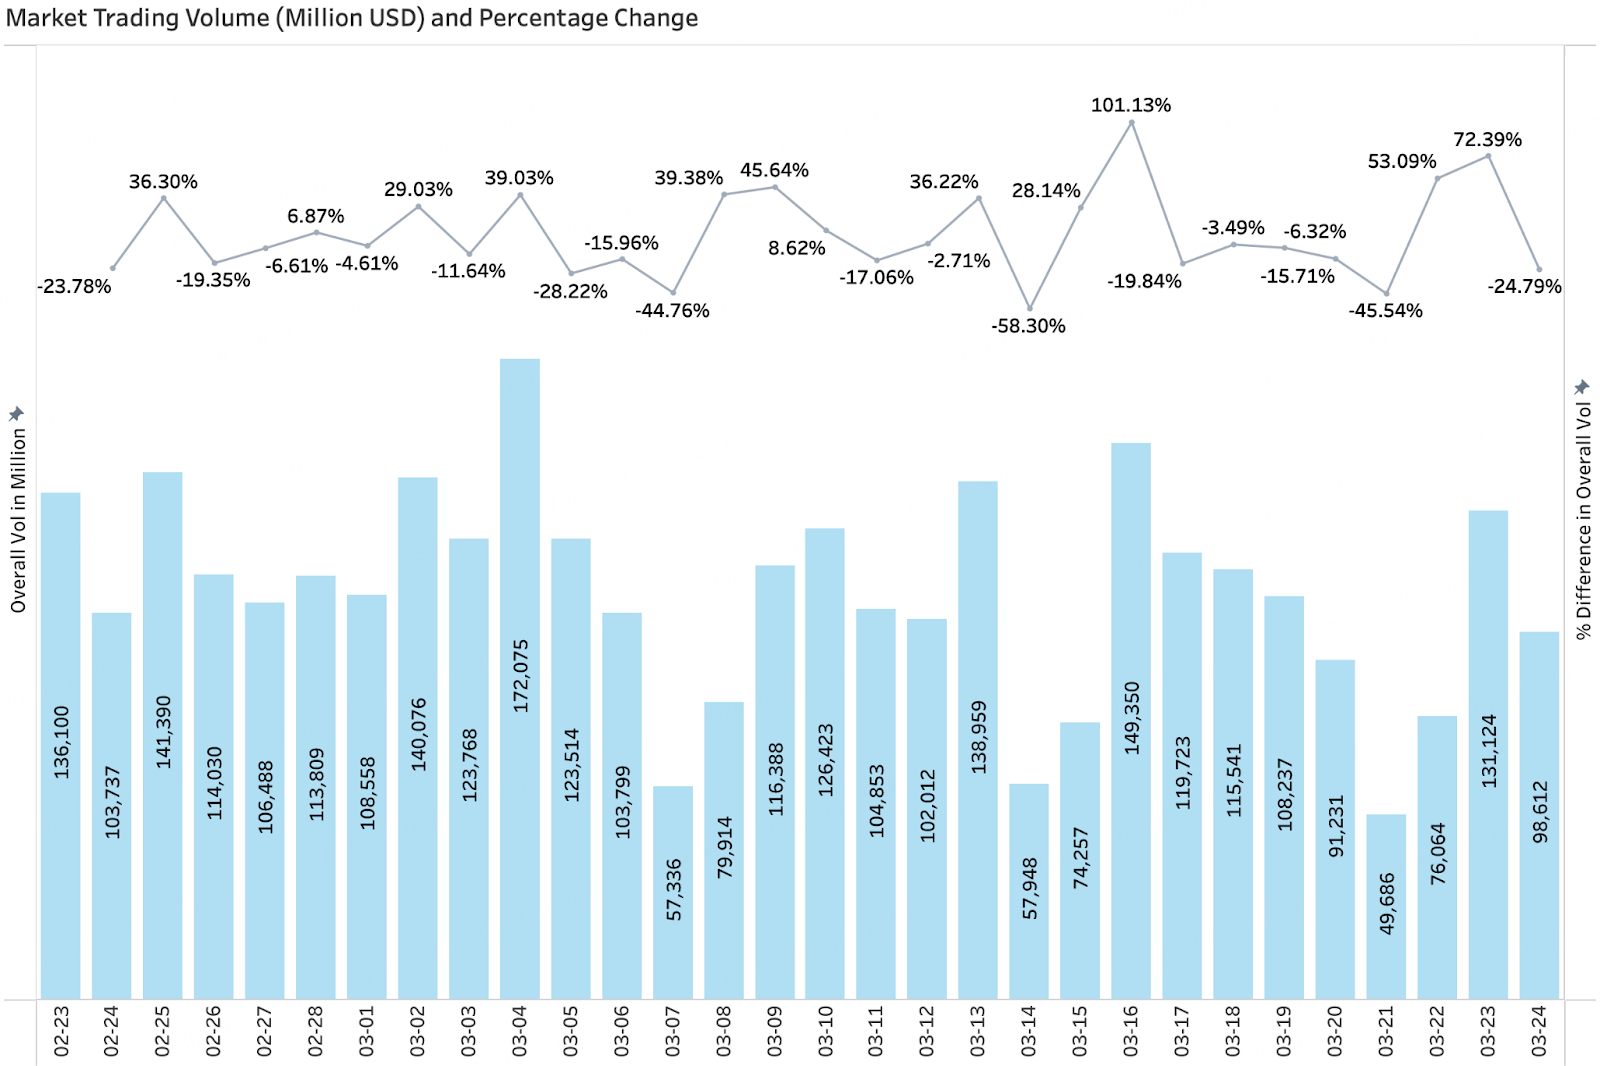
According to CoinGecko data, the overall market trading volume in March exhibited a clear "pulsing increase followed by a rapid fall," with significant volatility compared to February. From the beginning of the month to March 4, trading volume rapidly surged to a phase high of about $170 billion, and then quickly fell back; mid-March, driven by market sentiment and events, it surged again, experiencing a single-day increase of up to 101% on March 16, but this lack of sustainability led to another contraction phase later. In terms of rhythm, trading increased significantly during short-term emotional catalysts or event shock windows (such as amplified market fluctuations or on-chain/security incidents), while other times trading remained at low-medium levels, reflecting that funding is mainly driven by short-term speculation and trading, with mid-long term incremental capital still absent. The volume further weakened towards the end of the month with multiple significant negative growths (e.g., -45%, -24%), indicating a marginal retreat in market activity. Overall, while March displayed stronger bursts of volume compared to February at certain points, the volume lacked continuity, and the market still failed to form a stable trend of increasing volume, with structural and event-driven market dynamics remaining dominant.
Total Market Capitalization & Daily Growth Amount
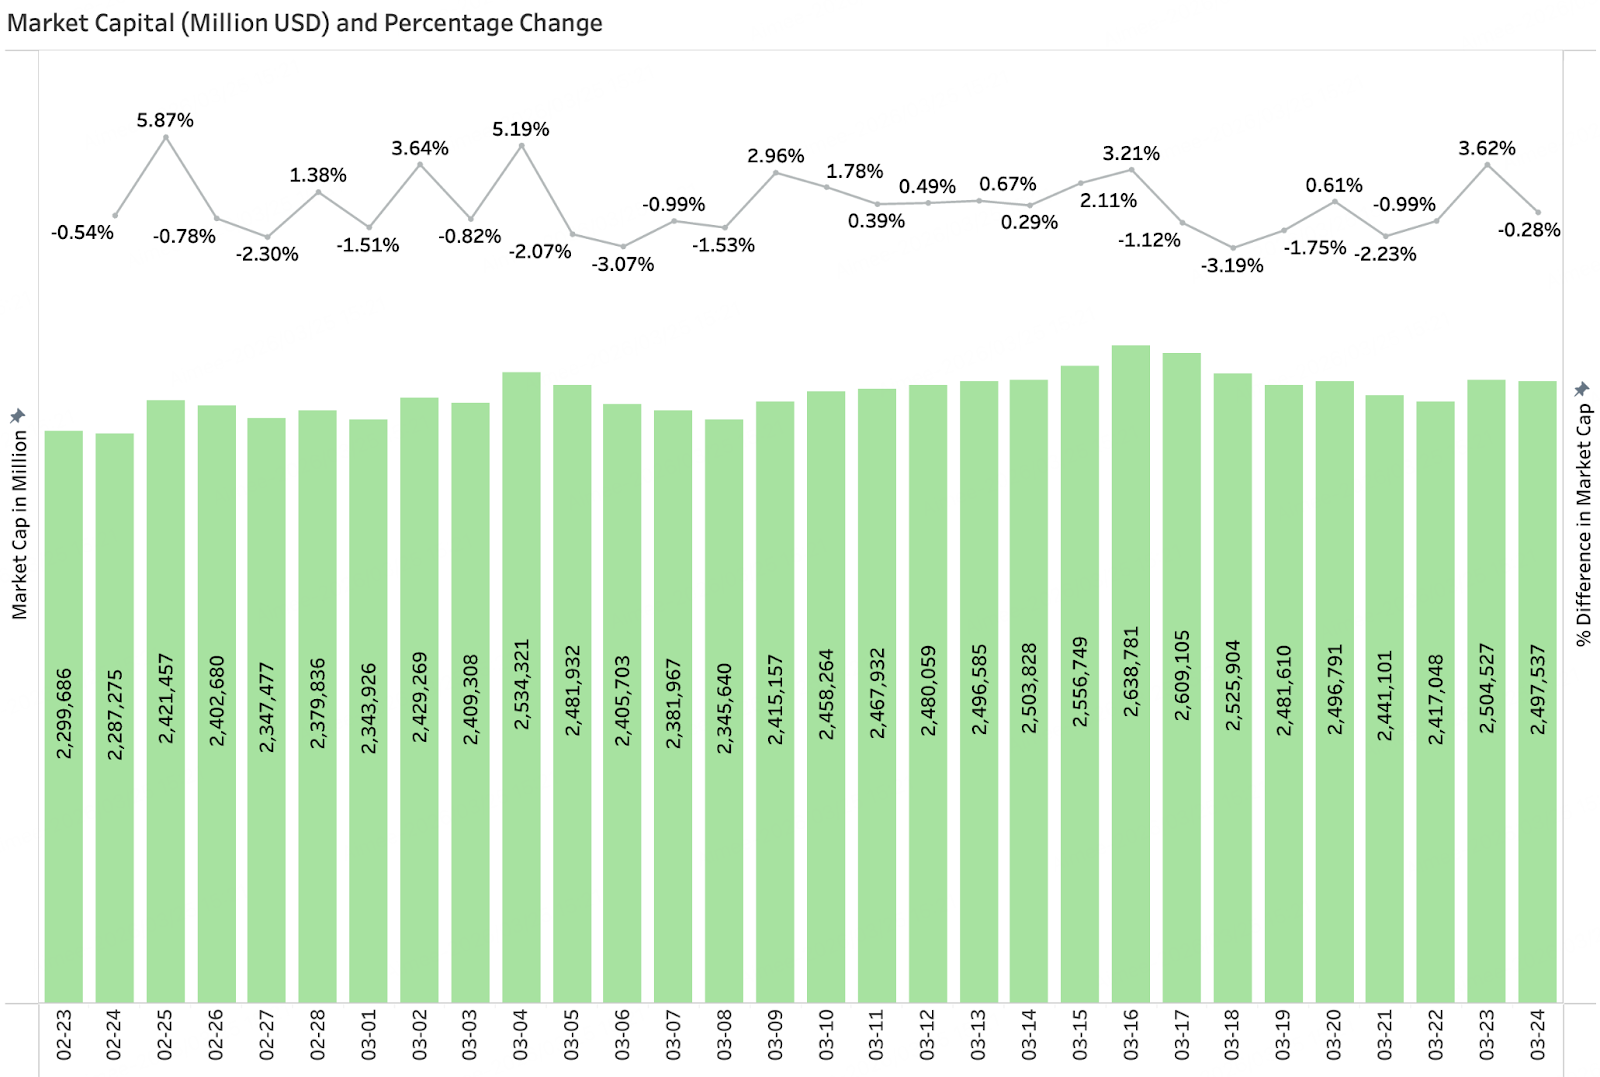
According to CoinGecko data, the total market capitalization of the crypto market in March demonstrated a structure of "oscillating upwards before retreating and stabilizing." At the beginning of the month, the market capitalization fluctuated around $2.3 trillion, gradually recovering and peaking in mid-March at about $2.63 trillion, with daily increases relatively moderate, mostly within ±3%, indicating cautious sentiment despite market recovery. In comparison to February, March's market capitalization showed more stability, without extreme single-day major retracements, reflecting that systematic risk has temporarily eased. However, after the mid-month high, market capitalization fell back again, repeatedly oscillating in the $2.45 trillion–$2.50 trillion range, with growth momentum weakened. In summary, the current market is in a platform consolidation phase post-recovery, with insufficient dynamic momentum for upwards trends, and risk appetite is still in the recovery process. Future trends still rely on improvements in macro liquidity, sustained inflows into ETFs, and further policy catalysts.
3. On-Chain Data Analysis
BTC, ETH ETF Inflow and Outflow Analysis
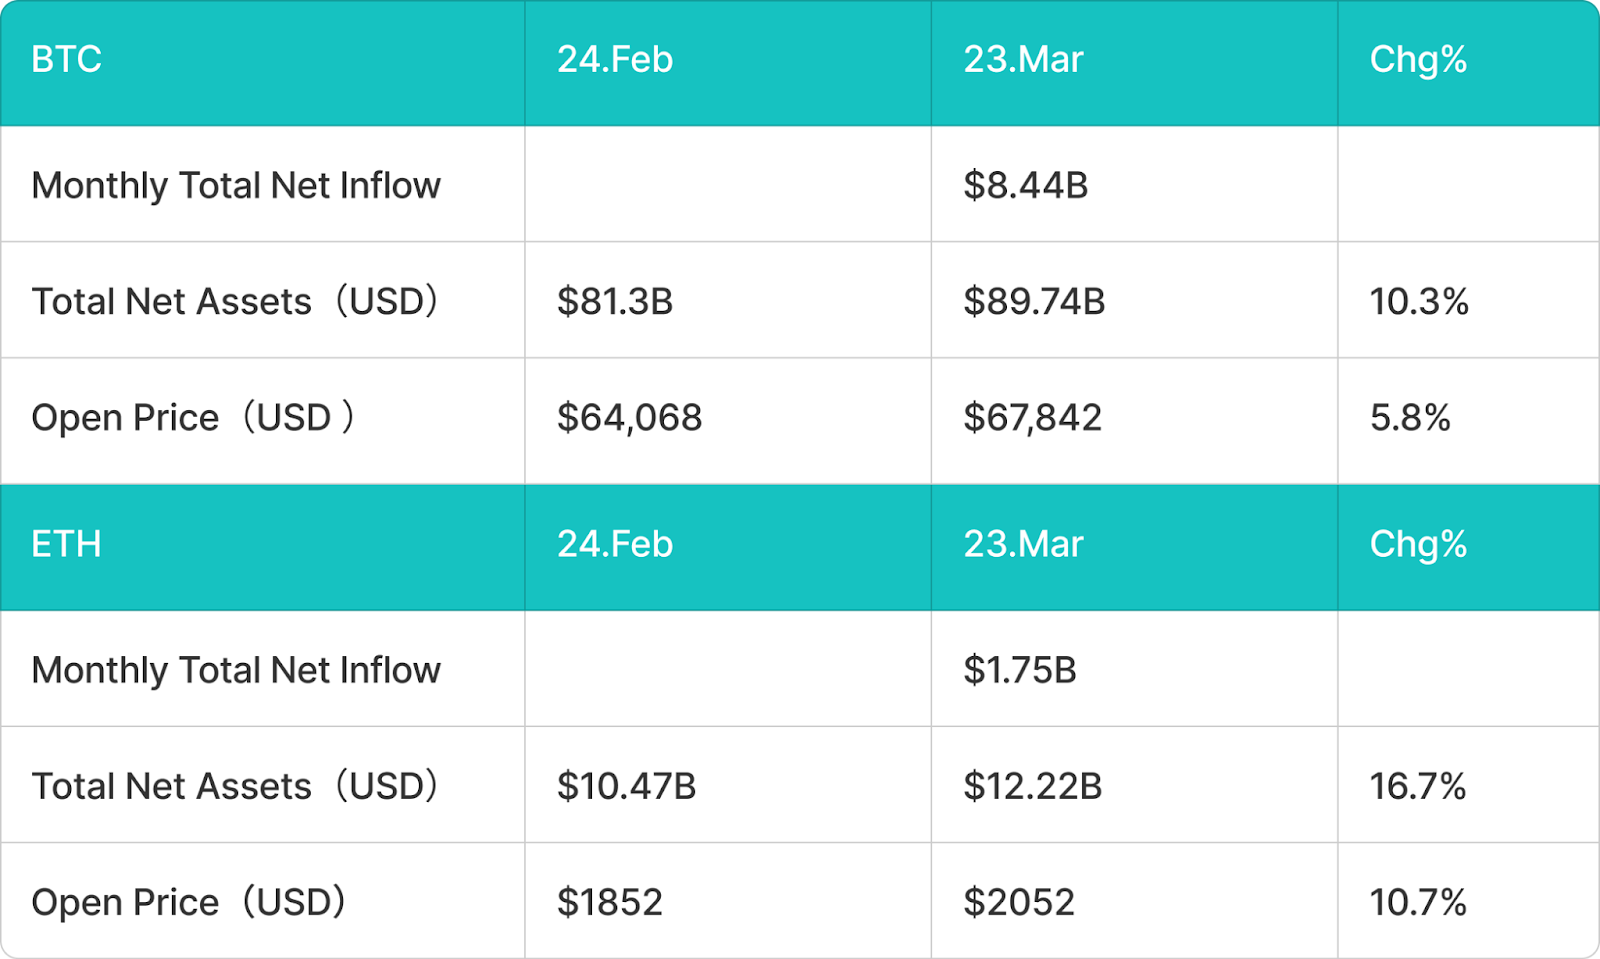
In March, the BTC spot ETF capital significantly reversed to a net inflow, transitioning from net outflows. This month, the BTC spot ETF realized a net inflow of approximately $8.44 billion, with total net assets increasing from about $81.3 billion on February 24 to $89.74 billion, a month-on-month growth of about 10.3%. In terms of price, BTC rose from about $64,068 at the beginning of the month to $67,842, an increase of about 5.8%. Overall, the re-entry of ETF funds and price recovery formed positive feedback, indicating an improvement in institutional capital risk appetite. Compared to the concentrated outflows in February, March resembled a phase of reallocation; on one hand, marginal improvement in macro liquidity alleviated pressures on risk assets, while on the other hand, BTC became attractive for valuation after a prior significant correction, prompting institutions to re-establish exposure, thus displaying "capital inflow + price stabilization" recovery characteristics.
Similarly, in March, the ETH spot ETF showed significant improvement, with funds transitioning from outflows to inflows. This month, the ETH spot ETF net inflow was approximately $1.75 billion, with total net assets growing from about $10.47 billion to $12.22 billion, a month-on-month improvement of 16.7%. ETH prices rose from $1,852 to $2,052, increasing by approximately 10.7%. In performance, the inflow magnitude and price elasticity of ETH were higher than BTC, reflecting that in a phase of marginal recovery in risk appetite, funds were more inclined to replenish high volatility assets. As a less favored asset for reduction in February, ETH became a priority for recovery in March, yet its overall scale has not returned to previous high levels, indicating that institutions are currently more engaged in tactical replenishment while maintaining a cautious approach toward mid to long-term allocations.
Stablecoin Inflow and Outflow Analysis
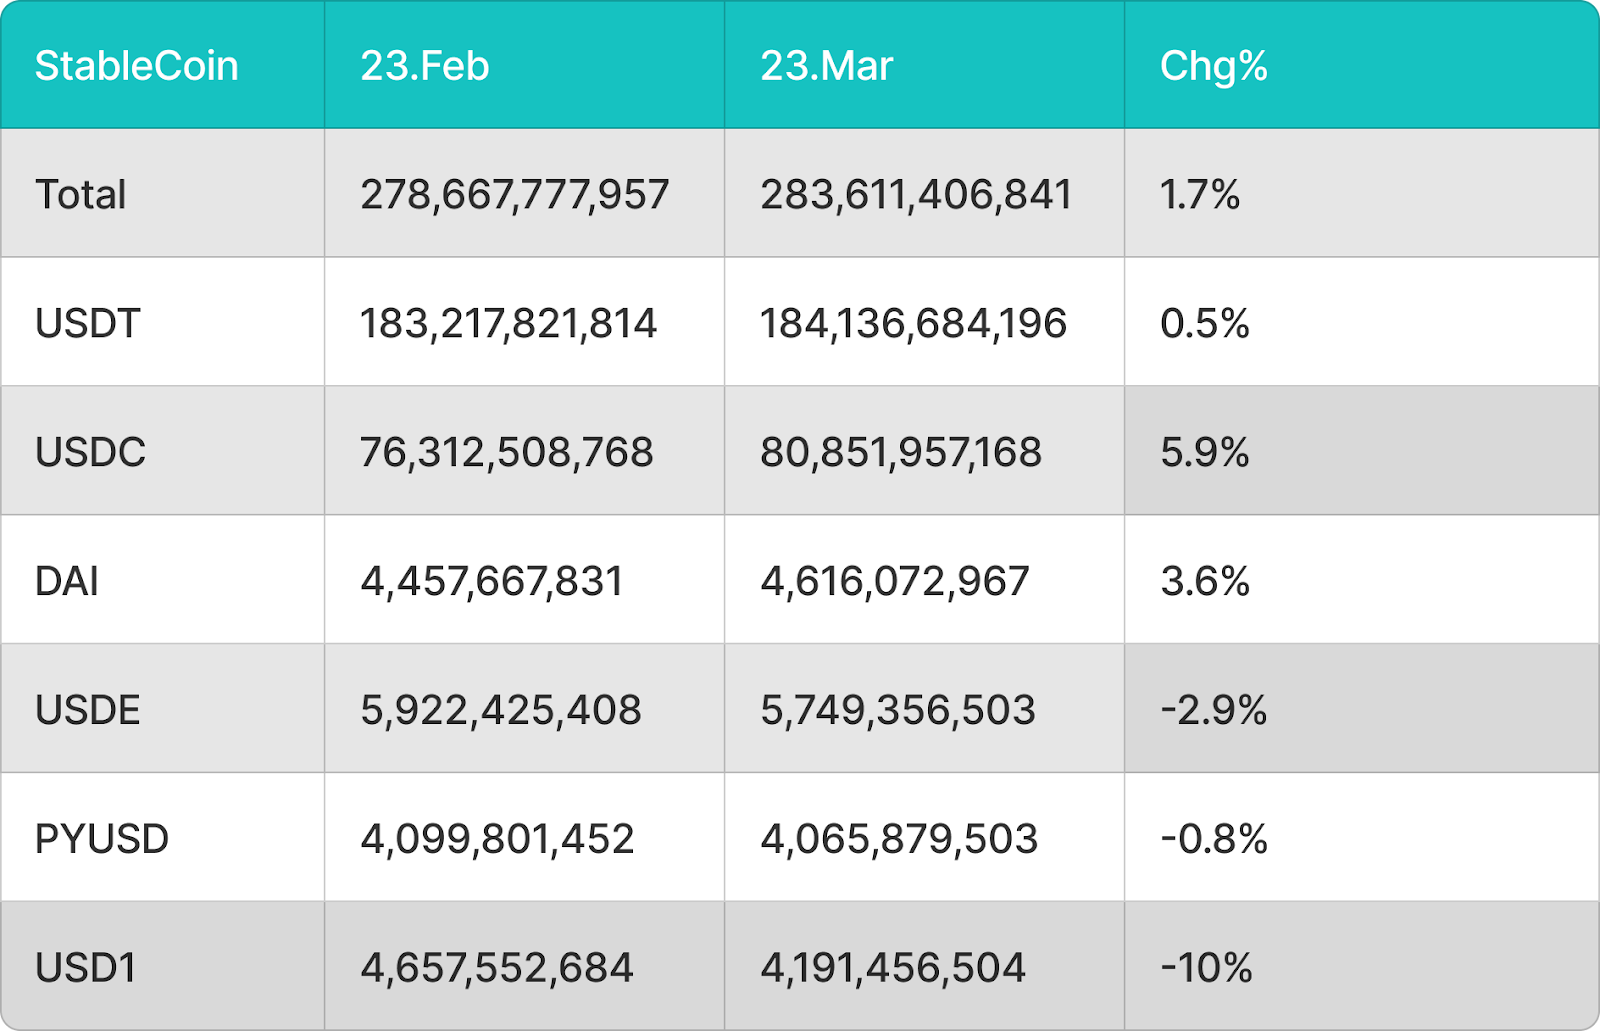
Regarding stablecoins, the overall circulation increased from about $278.668 billion to $283.611 billion in March, reflecting a month-on-month growth of about 1.7%, shifting from slight contraction in February to mild expansion, indicating marginal improvement in market liquidity. Structurally, USDT increased slightly by about 0.5%, maintaining its dominant position; USDC increased by about 5.9%, with the most notable increase, reflecting that compliant stablecoins are more favored during capital inflow phases; DAI grew by about 3.6%, demonstrating relatively steady performance. Meanwhile, USDE, PYUSD, and USD1 declined by approximately 2.9%, 0.8%, and 10%, respectively, with USD1 experiencing the most significant contraction, indicating that demand for some non-mainstream or specific ecosystem stablecoins remains under pressure. Overall, while stablecoins expanded, funding is clearly concentrating towards leading assets, further exacerbating structural differentiation.
In summary, March exhibited typical recovery characteristics: both BTC and ETH spot ETFs transitioned from net outflows to net inflows, asset scales and prices rebounded simultaneously; the total amount of stablecoins shifted from contraction to expansion, validating that new funds are re-entering the market. However, structurally, funds remain concentrated in mainstream assets and leading stablecoins, indicating that the current phase is still characterized by cautious recovery in risk appetite, more closely resembling a phase of capital replenishment-driven recovery rather than a comprehensive trend of rising markets.
4. Price Analysis of Mainstream Currencies
Bitcoin (BTC) Price Analysis
In March, Bitcoin prices oscillated widely in the range of $62,000–$74,000. After BTC rebounded to about $69,000 following five weeks of net outflows on February 25, it entered a stage of range consolidation, with major resistance concentrated between $72,000–$75,000, experiencing multiple touches within the month but failing to break through effectively. Key support is focused on the $65,000–$67,000 range, with a brief test around $63,000–$64,000 this month before quickly recovering. Following the hawkish statements from the FOMC on March 18, BTC fell about 5% in a single day, retesting the $67,000–$68,000 support, as of March 27, it was around $69,000–$71,000, continuing to operate within this range. If it can effectively break and hold above $74,000, it may begin a repair towards $78,000–$82,000; conversely, if it loses support at $65,000, it may further probe mid-term support around $60,000–$62,000. Overall, Bitcoin is currently in a range oscillation pattern, with $65,000–$67,000 as the main support and $72,000–$75,000 as the recent resistance area, with directional breakthroughs needing to be supported by improvements in the macro environment.
Ethereum (ETH) Price Analysis
In March, Ethereum prices continued a weak oscillation pattern, overall performing worse than Bitcoin. After ETH rebounded around $2,050 at the end of February, it entered a range consolidation, mainly oscillating between $1,900–$2,200, as of March 27, it was around $2,100–$2,200. The key resistance above first revolves around the $2,250–$2,350 range, corresponding to short-term dynamic moving averages and prior dense trading areas, repeatedly preventing price increases. The $1,900–$2,000 area serves as important support; if lost, it could further test key mid-term support at $1,700–$1,800. After the hawkish signals from the FOMC on March 18, ETH faced pressure briefly, and the inflow of ETFs slowed down, further suppressing rebound momentum. Whether it can gradually establish itself above $2,200 with increasing volume will be an important indicator for gauging if the trend can turn from weak to strong; the short-term technical outlook remains neutral to weak.
Solana (SOL) Price Analysis
In March, Solana's overall performance was relatively stable, operating within the $82–$97 range, showing a certain resilience compared to BTC and ETH. As of March 27, SOL was around $88–$92, showing slight fluctuations compared to late February. The short-term support is primarily集中于$82–$85区域, this position has recently played a supporting role multiple times; $95–$97 above is the key resistance area corresponding to the mid-March phase high, requiring robust volume to break through. If SOL can effectively hold above $90 and break through $97 with volume, it may open a repair trend towards $100–$105; conversely, if it loses $82 support, it may further probe down to mid-term support near $75–$78. Overall, SOL remains volatile, seeking directional breakthroughs within the $82–$97 range prior to improvements in macro risk appetite.
5. Hot Events of the Month
SEC/CFTC Jointly Releases Explanations on Cryptocurrency Asset Classification; 16 Assets Officially Recognized as "Digital Commodities"
On March 17, the U.S. Securities and Exchange Commission (SEC) and the Commodity Futures Trading Commission (CFTC) jointly released a 68-page document explaining the classification of cryptocurrency assets, formally establishing a systematic regulatory classification framework for the digital asset market. The document categorizes 16 mainstream cryptocurrencies, including BTC, ETH, SOL, XRP, Cardano, Chainlink, Avalanche, Polkadot, Stellar, Hedera, Litecoin, Dogecoin, Shiba Inu, Tezos, Bitcoin Cash, and Aptos, as "digital commodities," under the jurisdiction of the CFTC, clearly stating that they do not belong to securities. The overarching framework divides digital assets into five categories: digital commodities, digital collectibles, digital tools, stablecoins, and digital securities, with only digital securities (i.e., tokenized versions of traditional financial instruments) remaining under the full jurisdiction of the SEC.
This joint classification explanation was viewed by the market as one of the most significant regulatory breakthroughs in the history of the cryptocurrency industry. SEC Chairman Paul Atkins announced the concept of the "Token Safe Harbor" provision in the same day's speech, offering a transitional compliance protection space for protocols that have not yet fully decentralized. Following the announcement, mainstream cryptocurrencies reacted positively, with institutional compliance departments rapidly re-evaluating the configurability of digital assets; several asset management companies stated that they would expedite the process of including BTC, ETH, and SOL in their investment portfolios. Analysts generally believe that this joint action by the two agencies ends a long period of regulatory ambiguity lasting several years, paving the way for the next round of institutional entry by removing the most critical legal barriers.
BlackRock Launches Staked Ethereum ETF (ETHB), Spot ETFs Enter Income Era
On March 12, BlackRock, the world's largest asset management firm, officially launched the iShares Staked Ethereum Trust ETF (ETHB) on NASDAQ, becoming the first spot ETF in the U.S. that distributes staking rewards from Ethereum to investors. The product opened with seed assets of approximately $107 million, with first-day trading volume of about $15.5 million, and had nearly 80% of the ETH held staked on-chain at launch, with a target staking ratio maintained between 70%–95%. In terms of revenue distribution, ETHB will allocate approximately 82% of staking rewards to holders on a monthly basis, with a fee of 0.25% (the first $2.5 billion in scale enjoys a temporary discount of 0.12%), combining exposure to ETH prices and on-chain yields. The key difference between this and traditional spot ETH ETFs (like the BlackRock-owned ETHA) is that ETHB is a "yield-generating ETF," bringing Ethereum's PoS staking mechanism into the compliant traditional fund framework for the first time.
The approval and listing of ETHB is a direct product of the changing crypto regulatory environment in the U.S. Previously, former SEC Chairman Gensler required all submitted Ethereum ETF applications to strip away staking functionality, whereas the current Chairman Paul Atkins-led SEC approved the staking structure for ETHB without objection; meanwhile, the implementation of the GENIUS Act also paved the way for compliant income-generating crypto products. From a market impact perspective, the launch of ETHB signifies a paradigm shift of U.S. spot crypto ETFs from being "purely price tools" to "income generation tools," directly competing with traditional income assets like bonds and REITs. Analysts point out that if ETHB quickly scales up, it will provide sustainable staking demand support for the Ethereum network and encourage more asset management companies to follow suit and apply for similar products, opening new entry points for institutional participation in the Ethereum ecosystem.
Resolv Labs Suffers Private Key Attack, Frequent Security Incidents in the Crypto Market
On March 22, decentralized yield stablecoin protocol Resolv Labs encountered a severe security incident. Attackers gained access to privileged private keys stored in AWS KMS by hacking its cloud infrastructure, thus bypassing normal minting mechanisms to illegally mint approximately 8 million USR stablecoins with very low collateral, cashing out about $25 million through a Curve liquidity pool in a short span, leading to a price crash of USR from $1 to $0.025 within 17 minutes. This incident stemmed not from an on-chain smart contract vulnerability, but from the failure of off-chain key management and infrastructure security, highlighting the significant risks associated with concentrating core private keys in a single cloud service environment.
From a broader perspective, Resolv’s incident is not an isolated case. Recent security incidents, including Solv Protocol suffering a re-entrance attack, indicate that the attack patterns in the crypto industry are undergoing a structural shift: the proportion of traditional smart contract vulnerabilities is decreasing, while private key leaks, cloud service intrusions, and social engineering "Web2 attack vectors" have become mainstream, accounting for over 76% of stolen funds' sources. Coupled with around $17 billion in historical losses and a trend of frequent large-scale events, the industry has entered a new stage where "off-chain security determines upper limits," necessitating DeFi protocols to elevate key management and overall operational security systems to equal importance as on-chain audits.
6. Outlook for Next Month
CLARITY Act Legislative Sprint; April May Be a Key Window for the Year
April will be a decisive moment for whether the CLARITY Act can be implemented in 2026. Galaxy Digital's research department clearly stated that if the act cannot complete the committee process before April, the chances of it being passed within the year will be "extremely low"; the core controversy of the act revolves around whether stablecoins can pay market interest—banking sectors advocate for strict restrictions on passive yields, while the crypto industry strives to retain compliant income space. Senators announced on March 10 that negotiations would begin on this clause, with Treasury Secretary Bessent signaling that stablecoin legislation is expected to be signed into law in spring 2026. If negotiations in April are successful and advance to a full vote, it will create a complete loop of this round of historical breakthroughs in crypto regulation alongside the March 17 SEC/CFTC joint classification, providing unprecedented policy certainty for institutional allocations. Conversely, if the legislative pace delays again, the "reset of negative expectations" effect may cyclically suppress market sentiment.
Ethereum Glamsterdam Upgrade Progress Accelerating; Staking ETF Ecosystem Expanding
The Ethereum Glamsterdam upgrade has been identified by the foundation as a core priority for the first half of 2026, with a target window around June, entering a critical phase for testing network verification in April. This upgrade is the largest technical iteration for Ethereum since "The Merge," with core goals including: increasing the gas limit per block from 60 million to 200 million, aiming for a network throughput of 10,000 TPS (approximately ten times the current), reducing gas fees for complex smart contracts by approximately 78.6%, and simultaneously introducing parallel transaction processing and on-chain block construction mechanisms, significantly optimizing MEV structures. If the core EIP of the test net moves forward smoothly in April, it will significantly enhance ETH's mid-term ecological expectations, providing fundamental support for the relatively weak performance of ETH prices recently. In terms of staking ETFs, following the listing of ETHB, applications for similar products from institutions like Franklin Templeton and Grayscale will enter the SEC review window, and approval dynamics for follow-up products may appear in April, further expanding the scale and market impact of the staking ETF ecosystem while providing continuous staking demand support for the Ethereum network.
Powell's Term Completion and Walsh's Succession Raise Monetary Policy Continuity Concerns
Federal Reserve Chairman Jerome Powell's term will officially end on May 15, 2026. Trump nominated former Federal Reserve governor Kevin Walsh for the position on January 30; if he successfully completes the Senate confirmation process, Walsh will officially take office in May. This personnel transition will enter the final political game window in April, with the timing and phrasing of the Senate confirmation votes being highly interpreted by the market.
Walsh's policy stance represents a double-edged sword for the crypto market. Historically labeled as "hawkish," he advocates for raising real interest rates and shrinking the Federal Reserve's balance sheet; if this stance is implemented in policy, it could suppress risk assets like Bitcoin. However, his recent statements have softened, citing AI-driven productivity improvements bringing structural deflationary opportunities, aligning with Trump's low-interest rate demands. On the stance toward crypto assets, Walsh's position is somewhat contradictory: he has publicly referred to cryptocurrencies as "software disguised as money," categorizing the rise of BTC as a "speculative bubble symptom" created by loose monetary policy; yet on the other hand, he has investment records in crypto startups and supports central banks' participation in the digital currency space, which has led analysts to characterize him as "pragmatic rather than hostile."
For the crypto market, Powell’s departure eliminates a known policy stability anchor, while Walsh symbolizes a larger uncertainty premium. If Walsh releases dovish signals in the April confirmation hearing, the market may price in expectations for rate cuts in the second half of 2026 in advance, boosting crypto assets; if his hawkish stance is reinforced, combined with the current sticky inflation and oil prices, it will double press risk appetite. This personnel variable, alongside the legislative window of the CLARITY Act and macro data, constitutes one of the three core observational focal points for the crypto market in April.
免责声明:本文章仅代表作者个人观点,不代表本平台的立场和观点。本文章仅供信息分享,不构成对任何人的任何投资建议。用户与作者之间的任何争议,与本平台无关。如网页中刊载的文章或图片涉及侵权,请提供相关的权利证明和身份证明发送邮件到support@aicoin.com,本平台相关工作人员将会进行核查。


