1. News
Federal Reserve's "Hawkish Pause": The March FOMC meeting kept interest rates unchanged at 3.5%-3.75%, but significantly raised inflation expectations, suggesting minimal room for rate cuts in 2026 (0-1 time). This "Higher for Longer" expectation has led to a decrease in institutional risk appetite.
Continued ETF Outflows: Recently, the US spot BTC ETF recorded net outflows of several hundred million dollars (such as $66 million in outflows on March 24), indicating that traditional institutions are taking profits or are in a risk-averse position at the current price levels.
Regulatory Disturbance: Amendments related to the Clarity Act have restricted platforms from paying interest on stablecoins, causing related cryptocurrency stocks (like Coinbase) to weaken and dragging down market sentiment.
Sovereign Reserve Expectations: Discussions within the US government about establishing a strategic reserve of Bitcoin are ongoing (currently holding about $29 billion in BTC), providing a psychological support baseline for long-term prices.
Predicted Market Explosion: In early 2026, the predicted market trading volume is expected to exceed $20 billion, showing extremely high on-chain activity and stable liquidity demand for BTC as an underlying asset.
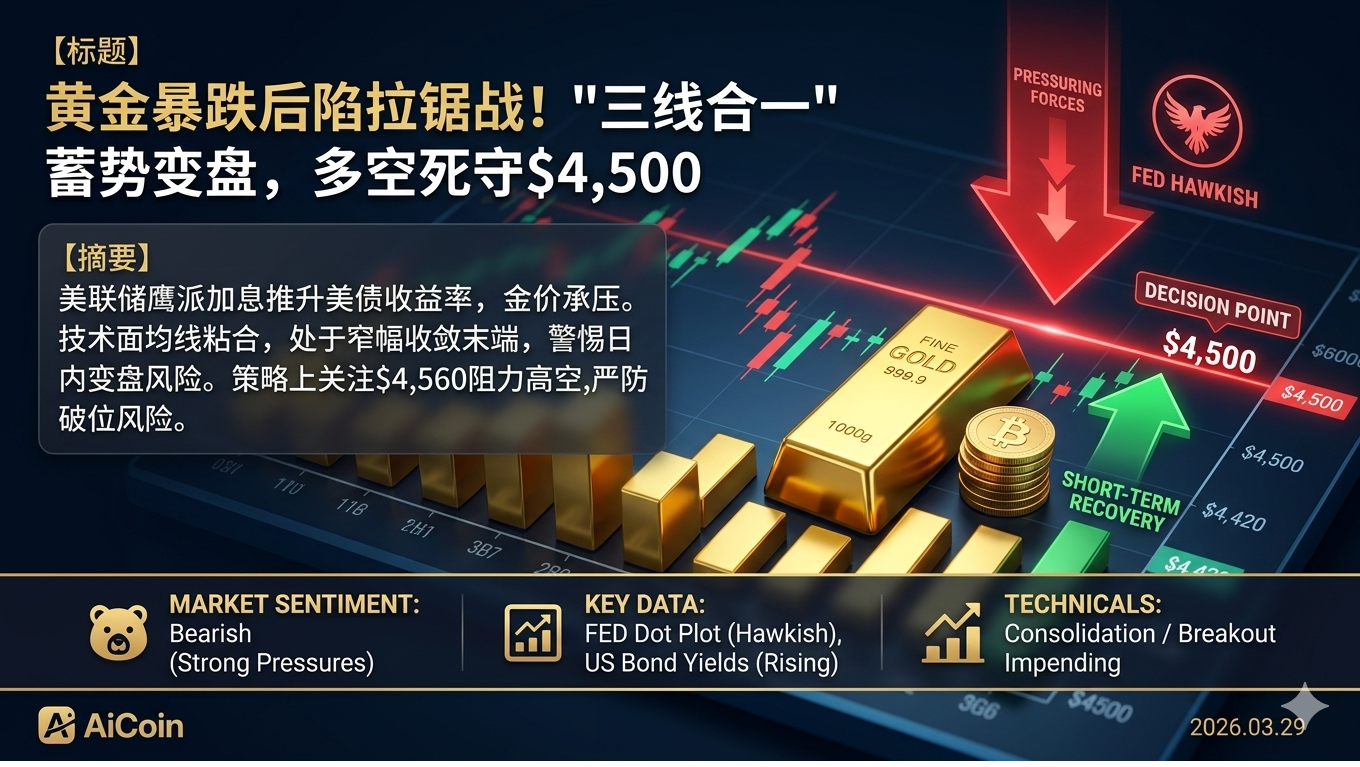
The news is biased bearish. The biggest resistance currently is the expectation of tightening macro liquidity, with the market in a transition period between "popping bubbles" and "basing".
2. Technical Analysis
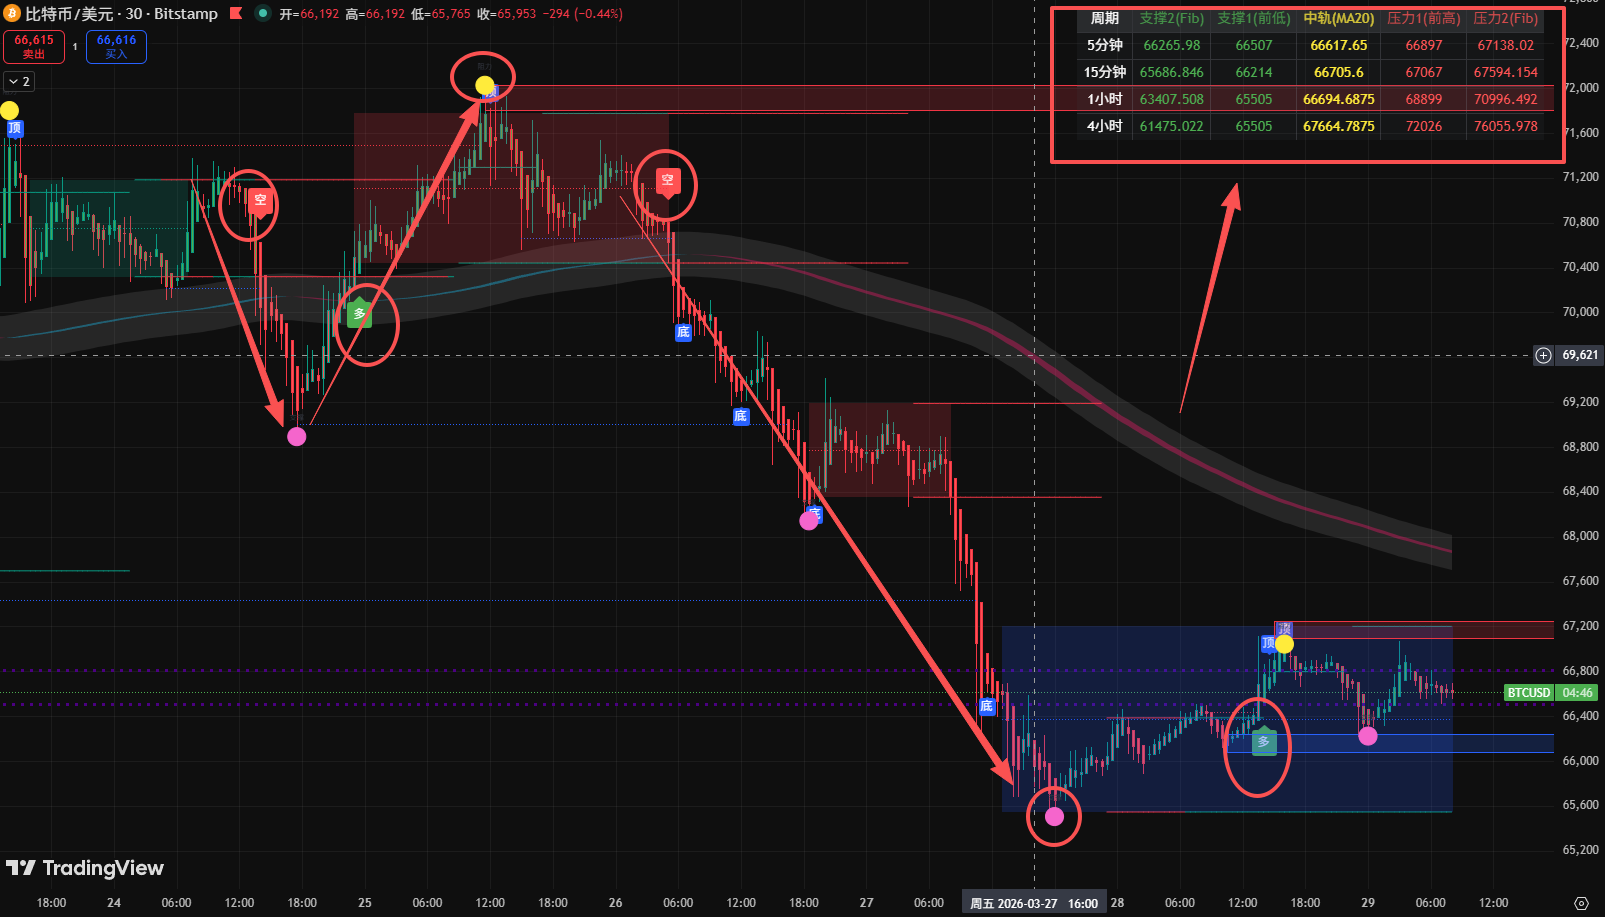
The moving average price is currently fluctuating around MA24 (66682) and MA52 (66677), with a high degree of adherence to the moving averages, indicating the market is at an extremely compressed turning point.
The long-term moving average MA120 (68708) forms significant resistance above; if the price cannot effectively break through this level, the medium-term trend will still be dominated by a downward channel.
RSI (14): Currently around 49.7 (neutral zone), neither overbought nor oversold, confirming the current sideways consolidation trend.
TD recently showed bottoming signals of TD9 and TD13 (around 65548), followed by a slight price rebound. It is currently in a sideways consolidation after a low-level rebound, forming a weak repair pattern.
Key Support and Resistance
Resistance Level: 68700 - 70000 (MA120 and previous dense trading zone).
Support Level: 65500 (recent low) and 64200 (lower boundary support).
Strategy
Wait for a breakout, don't easily enter left side.
Recommended Levels: Light position to test long: If the price retraces to stabilize at 65600 - 65800, you can enter, with a stop loss set at 65000.
Right side chase long: Enter upon confirmation after a breakout on volume at 68800.
Target Level: 71000
Risk Warning
Geopolitical Emergencies: The international situation in March 2026 (especially in the energy sector) is highly volatile; if oil prices soar again, it will push up inflation expectations, leading to a second bottom-testing for risk assets like BTC.
Accelerated ETF Outflows: If ETF outflows widen when US stocks open next Monday, it will directly breach the key psychological level of 65000.
Liquidity Risks: The market trading volume is low over the weekend; be cautious of "spike" actions caused by large holders (whales) with small amounts of funding.
Pay attention to扣1 to receive the TV long-short oscillation signal indicator for free,

免责声明:本文章仅代表作者个人观点,不代表本平台的立场和观点。本文章仅供信息分享,不构成对任何人的任何投资建议。用户与作者之间的任何争议,与本平台无关。如网页中刊载的文章或图片涉及侵权,请提供相关的权利证明和身份证明发送邮件到support@aicoin.com,本平台相关工作人员将会进行核查。