Cryptocurrency Circle Academician: Why will Ethereum southbound on March 29? From 2380 to 2000 precisely hitting the southbound trend! Latest market analysis and thought reference
Article edited at 04:00
Ethereum's current price is 2022. Watching Ethereum drop from 2200 to 2022, and then repeatedly oscillate above 2000, is there anyone who can't help but want to catch the bottom again? There has never been a myth of guaranteed profit from catching the bottom in the cryptocurrency circle; only those who understand the trend and execute strictly can survive. The current rebound provides an opportunity for southbound movement, don't be misled by short-term fluctuations anymore. How to proceed next? It's very simple: the rebound is the window for going south.
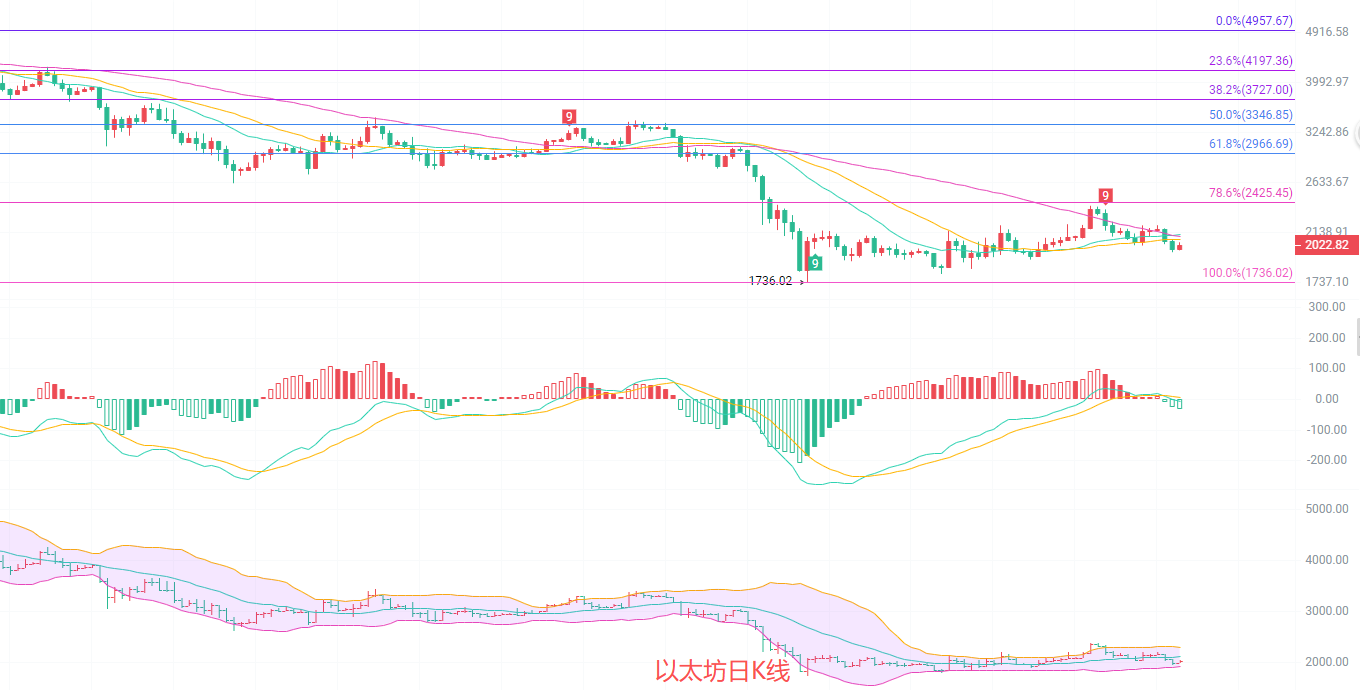
From the daily candlestick chart, it can be seen that this wave is a trend of going down, not a short-term correction. After the price broke below the key support at 2100, all short-term moving averages tilted downward forming pressure. After the MACD death cross, it has not turned red again, indicating that the upward movement has no power of resistance. The lower track of the Bollinger Bands continues to open, and the price oscillating between 2000 and 2050 is merely a continuation of the decline, not a stabilization. The upper pressure points at 2100 and 2120 are insurmountable, while the first target below is 1900 to 1950, and the space for going south is still opening.
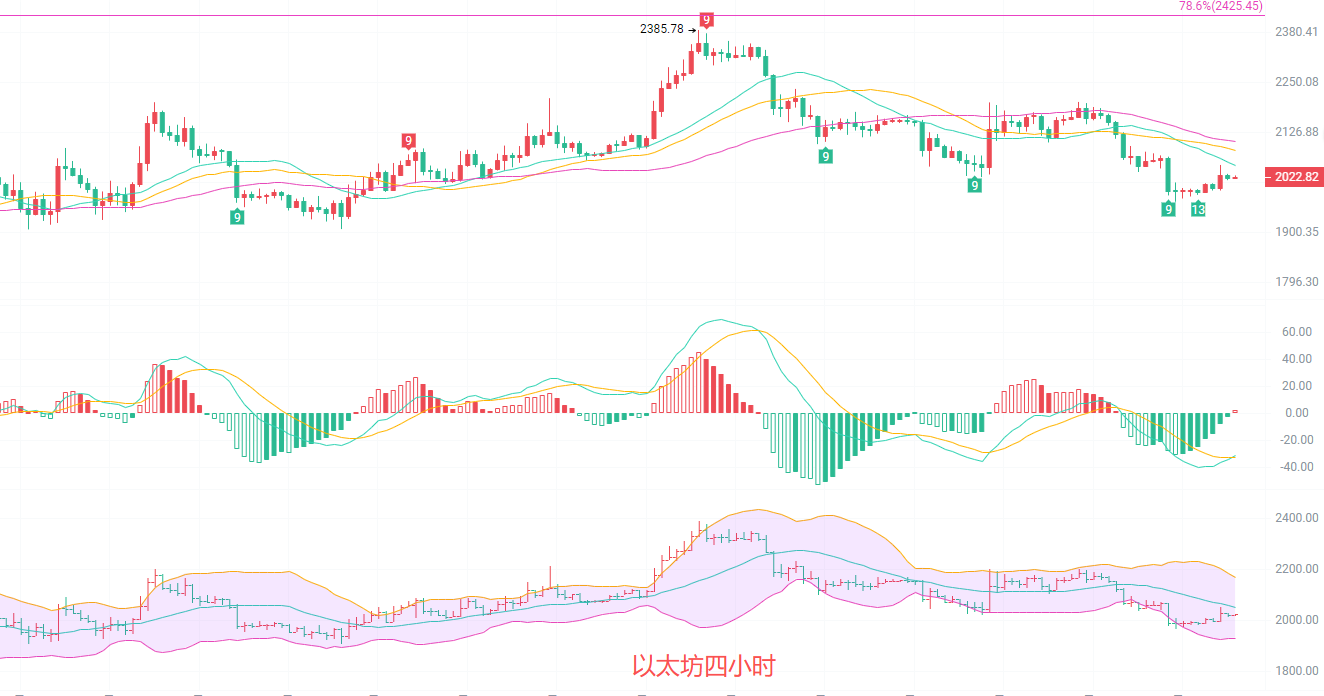
The four-hour fast line is under pressure below the MA20 and MA30 moving averages, and the short-term moving averages have formed a southbound arrangement. After the MACD death cross, the green bars have shrunk, but DIF is still below DEA, and the downward momentum remains dominant; the Bollinger Bands open downward, and the price is oscillating in the middle-lower track area, with the rebound not reaching the middle track, indicating a clear southbound trend. Therefore, everyone can focus on the short-term resistance level from 2050 to 2100, and the critical support level from 1950 to 2000, as both sides are roadblocks and also key turning points.
Short-term reference: (Live data has been updated, please consult the author for details)
Above 2050 to 2100 going south, stop loss at 2120, target looking at 2000 to 1950, after breaking look at 1740
(Alternative) Below 1950 to 2000 going north, stop loss at 1930, target looking at 2050 to 2100
Specific operations are based on real-time data from the market, for more information please consult the author. The article is published with a delay, advice is for reference only and risks are borne by the reader.

Warm reminder: The above content is solely created by the author of the public account. The advertisements at the end of the article and in the comment section are unrelated to the author, please discern carefully, thank you for reading.
免责声明:本文章仅代表作者个人观点,不代表本平台的立场和观点。本文章仅供信息分享,不构成对任何人的任何投资建议。用户与作者之间的任何争议,与本平台无关。如网页中刊载的文章或图片涉及侵权,请提供相关的权利证明和身份证明发送邮件到support@aicoin.com,本平台相关工作人员将会进行核查。