Crypto Circle Academician: Don't ask if Ethereum can hit the bottom on 3.28 anymore, the trend has already given the answer! Latest market analysis and thought reference
The current price of Ethereum is 1980. This wave of Ethereum fell from 2180 to 1979, truly engraving the phrase "the trend is king" on the market. Previously, some people shouted to break new highs at 2200, and some hurried to buy the dip at 2100, but they were all harshly educated by the market. I signaled a downward trend from the convergence triangle's endpoint and watched the target drop from 2120 to 2100, and now to 1979. Every step verifies the judgment; in reality, there is no mysticism in trading, it is merely understanding the structure, controlling your hands, and executing strategies, leaving the rest to time.
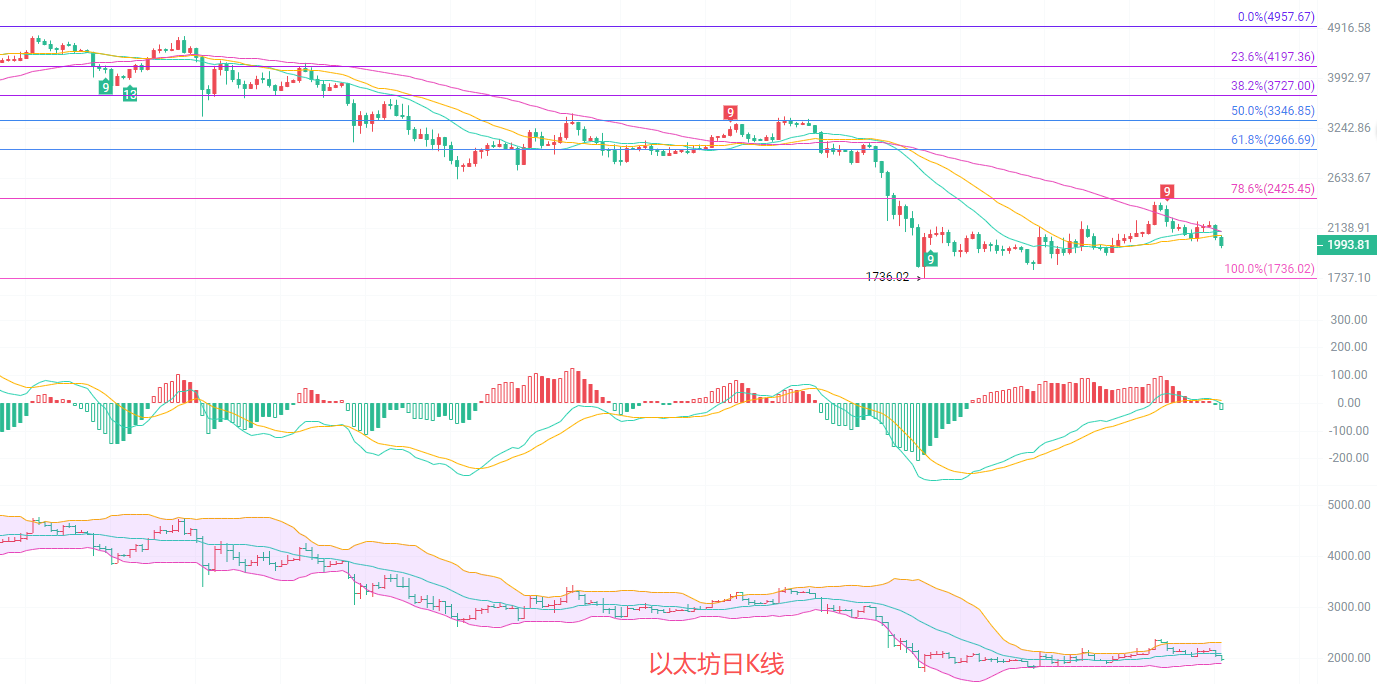
The daily candlestick chart has given the clearest signal: this descent is not a pullback but a trend downward. After the price broke the key support at 2100, all short-term moving averages turned downward, forming resistance. After the MACD crossed bearish, the green histogram continued to expand, and the Bollinger Bands' lower band continued to open. The price is moving along the lower band with no signs of stopping. The upper level of 2100 has turned into a roadblock, making it difficult to rise again; the lower range of 1900 to 1950 is the first line of defense. If it breaks down further, it will fall deeper, and the daily level is clearly dominated by the downward trend.
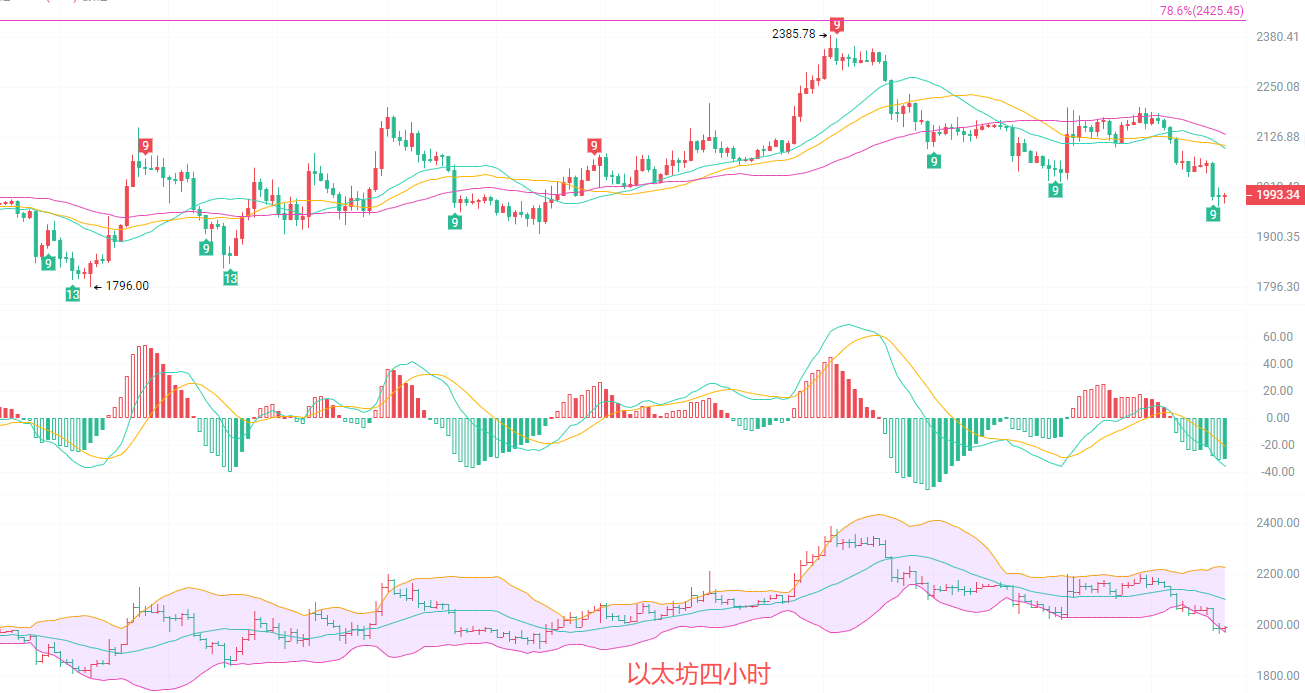
The four-hour chart has completely opened up the downward space after breaking below 2100. All short-term moving averages are firmly pressed down on the price; after the MACD crossed bearish, the green histogram continues to enlarge, indicating that the downward pressure is still strong, with no signs of stopping. The Bollinger Bands' lower band continues to open, and the price is moving down along the lower band with very weak rebound strength. The upper level of 2000 is a defensive level for the downward move, while the lower target of 1900 to 1950 is the first objective. The four-hour level is completely dominated by the downward trend.
Short-term reference: (Real-time data has been updated; for details, please consult the author)
Sell down from 2000 to 2050, stop loss at 2080, target 1950 to 1900, and if broken, look at 1740
(Alternative) Buy up from 1900 to 1950, stop loss at 1880, target 2000 to 2050
Specific operations depend mainly on real-time market data; for more information, you can consult the author. There may be a delay in article publication, so it is recommended for reference only, with risks borne by the reader.

Warm reminder: The above content is created by the author of the public account. The advertisements at the end of the article and in the comments section are not related to the author. Please distinguish carefully. Thank you for reading.
免责声明:本文章仅代表作者个人观点,不代表本平台的立场和观点。本文章仅供信息分享,不构成对任何人的任何投资建议。用户与作者之间的任何争议,与本平台无关。如网页中刊载的文章或图片涉及侵权,请提供相关的权利证明和身份证明发送邮件到support@aicoin.com,本平台相关工作人员将会进行核查。