Original author: sealaunch intelligence
Original translation: Chopper, Foresight News
Most reports on Polymarket only touch on superficial data: trading volume milestones, user growth, transaction counts, open positions, but never delve into who is actually trading behind these numbers. This article categorizes all active wallets based on transaction frequency and trading volume, outlining the true user profile structure of Polymarket.
The vast majority of Polymarket's trading volume comes from a small group of algorithmic traders and high-frequency trading participants; the massive number of low-frequency retail investors has almost no intersection with this professional trading group. Recognizing the differences between these two types of users directly determines the platform's fee structure, product priority planning, and market category strategy layout.
Note: All data in this article comes from the Dune data dashboard, with the analysis period covering nearly three months of wallet-level total behavior; user profiles are classified based on transaction frequency (T1–T7) and trading amount (V1–V7), with the amount measured in dollars.
User Transaction Frequency and Volume Distribution
Transaction frequency shows a typical log-normal distribution decay characteristic. The largest user group had transaction counts between 2 and 10 during the entire study period, accounting for 32% of all users. When adding users with transaction counts between 11 and 50, they nearly constitute two-thirds of the total user base. These users typically participate in trading during elections, sporting events, or significant macroeconomic events, placing small amounts of money on the line.
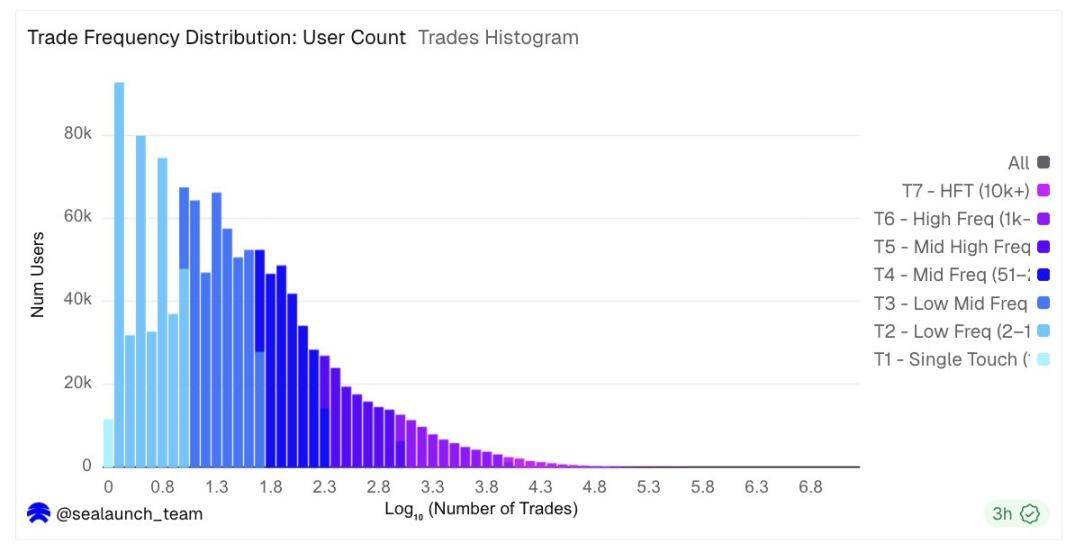
Transaction Frequency Distribution Diagram
In contrast, the trading volume distribution is completely different. Although transaction frequency sharply declines from the left side, the volume histogram shows a bell shape under a logarithmic coordinate system, peaking at around $600 to $3000 per user. This means that a typical active user's trading amount is in the four-digit range, but the number of users on the right tail starting from $25,000 is relatively small, yet they account for the vast majority of the platform's trading volume.
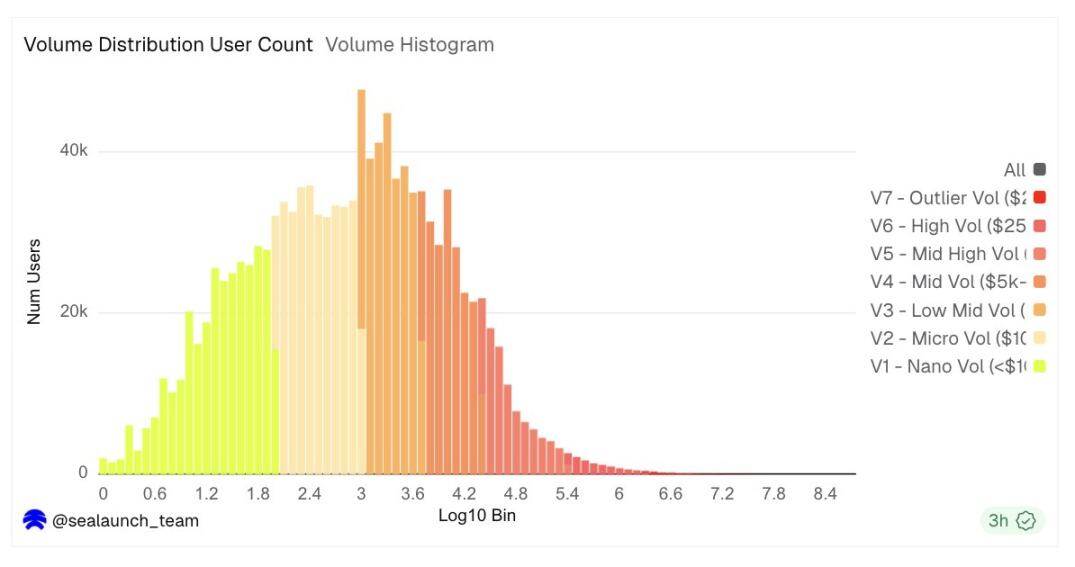
Trading Volume Distribution Diagram
These two histograms together reveal a structural split: one part consists of low-frequency participants, while the other part consists of high-volume participants, who leave almost no footprint in the user charts, yet have a dominant impact on the trading volume charts.
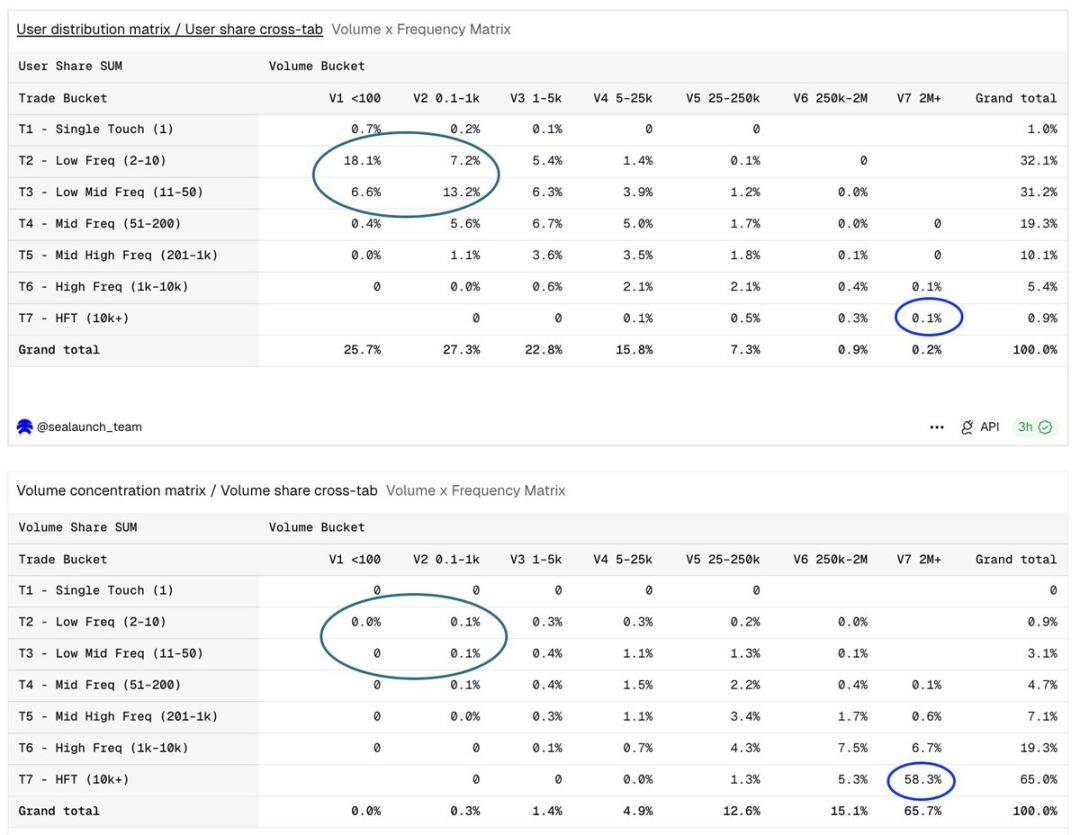
User Proportion & Volume Concentration Matrix is more intuitive: user dimension concentrated in low-frequency small amounts, volume dimension completely reversed
How to Build a User Profile System
Simply relying on frequency or volume to segment users ignores the associative logic between the two. A trader who made 500 transactions totaling $50 is a completely different type of participant compared to one who made 500 transactions with a total of $5 million. We classify each wallet by integrating these two dimensions.
First, we assign each wallet to different transaction frequency levels: from T1 (single transaction) to T7 (over 10,000 transactions). Then, we assign them to different trading volume levels: from V1 (total trading amount less than $100) to V7 (over $2 million). The intersection of these two dimensions produces seven types of user profiles, each representing a distinctly different participant type.
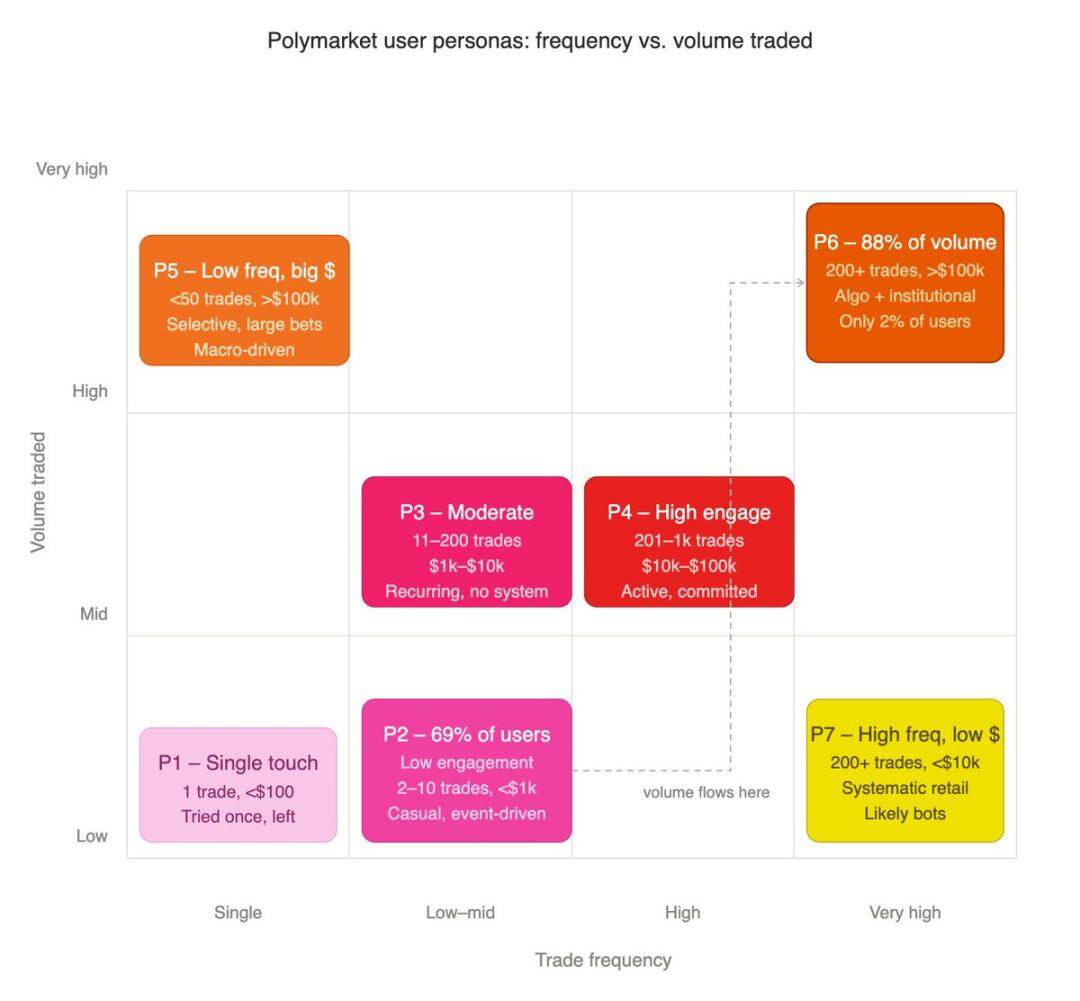
- P1 Single Silent User: Only 1 transaction, total amount less than $100, a one-time trial experience of the platform
- P2 Low Active Retail Investor: 2–10 transactions, total volume less than $1000, purely event-driven casual participants
- P3 Moderate Participant: 11–200 transactions, volume $1000–$10,000, repeated entries but no systematic trading logic
- P4 High Depth Retail Investor: 201–1000 transactions, volume $10,000–$100,000, actively and steadily participate but do not reach institutional levels
- P5 Low-Frequency High-Net-Worth Investor: Less than 50 transactions, single large amounts over $100,000, selected opportunities, targeted large positions
- P6 High-Frequency Professional Trader: More than 200 transactions, volume over $100,000, algorithmic strategies and institutional trader groups
- P7 High-Frequency Small Player: More than 200 transactions, total amount less than $10,000, high entry variability but limited capital
2% of Users Account for Nearly 90% of Trading Volume
P2 low-active retail investors number as high as 849,000, accounting for 69% of the overall user base; P6 high-frequency high-investment users number only 27,000, accounting for about 2%.
However, during the statistical period, the P6 group created a total trading volume of up to $39 billion. This is the most extreme manifestation of the Pareto principle: not the conventional 80/20, but rather 2% of users support nearly 90% of trading volume.
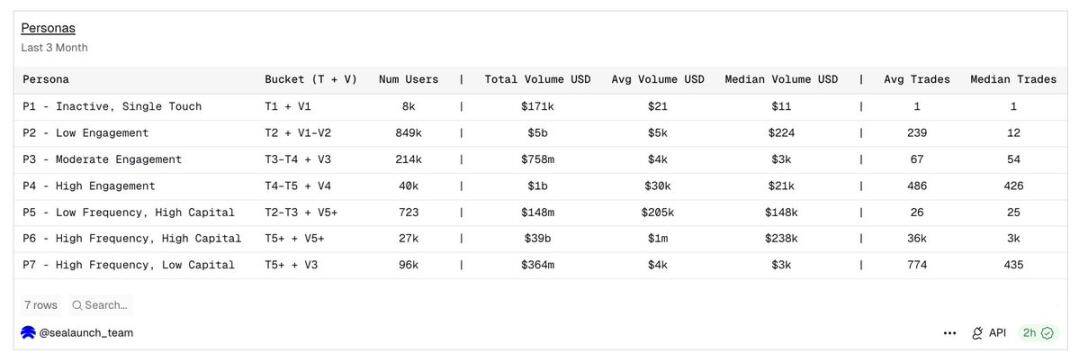
User Profile Summary Table: Seven major user types derived from the intersection of trading frequency and trading scale
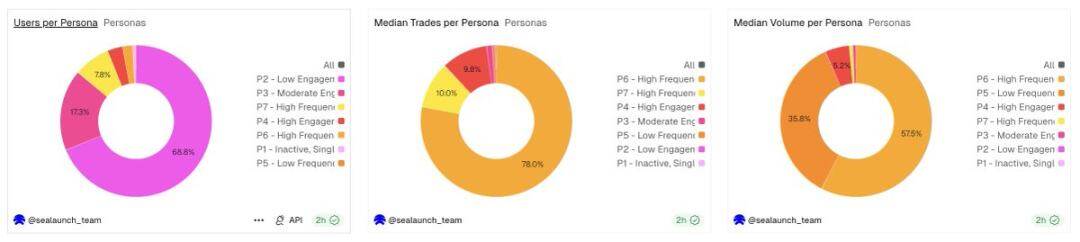
The number of users in each group, median transaction counts, and median transaction amounts: Three data sets show starkly different user distribution characteristics
The user growth chart and the trading volume growth chart describe almost completely different user groups. Platforms targeting user growth and those targeting trading volume growth have entirely different product decisions.
Category Preferences of Different User Profiles
Sports and cryptocurrencies are the two largest trading categories on Polymarket, accounting for 42% and 31% of total trading volume, respectively, with significant structural differences in the underlying user groups.
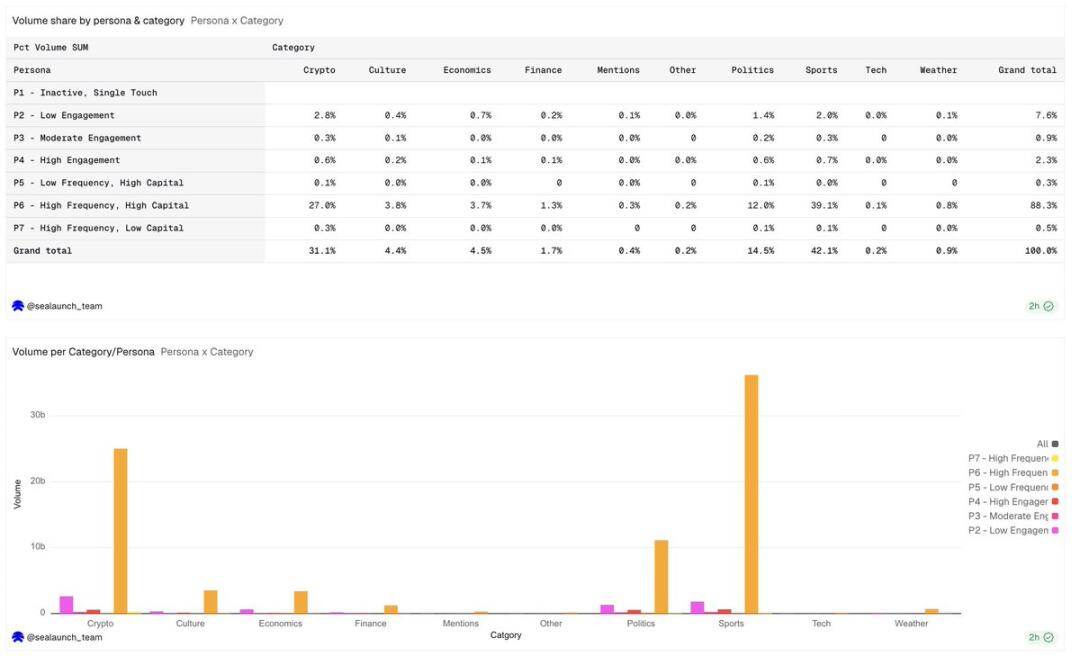
Trading volume share across different user profiles and categories
The proportion of high-frequency high-capital (P6) traders in the cryptocurrency market is significantly higher than the overall user base, which is consistent with the algorithmic trading model. These participants are not casual bettors but utilize systematic strategies for crypto trading. The trading volume is high, and the transaction frequency is also high, indicating that the trading execution is automated and not subjectively determined.
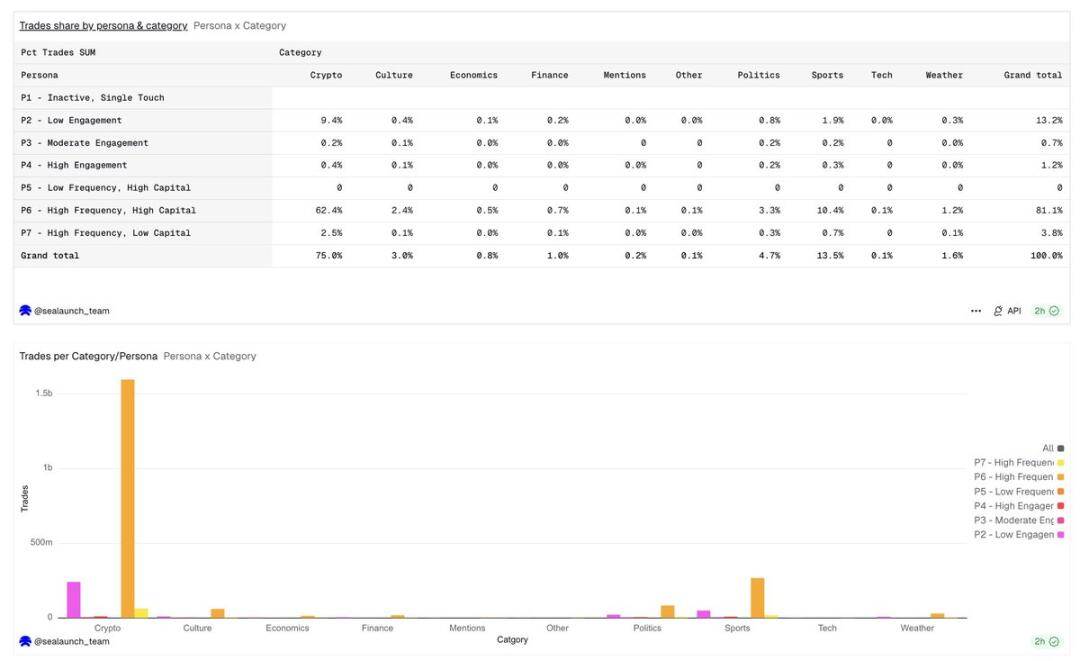
Transaction count shares across different user profiles and categories
Sports betting, while also dominated by high-frequency, high-capital (P6) trading volume, has a higher proportion of moderate (P3) and high (P4) participation than the cryptocurrency category. Sports betting features both institutional algorithmic capital and a large number of seasoned manual judgment players who rely on subjective discretion for firmer bets, rather than machine-driven high-frequency iteration.
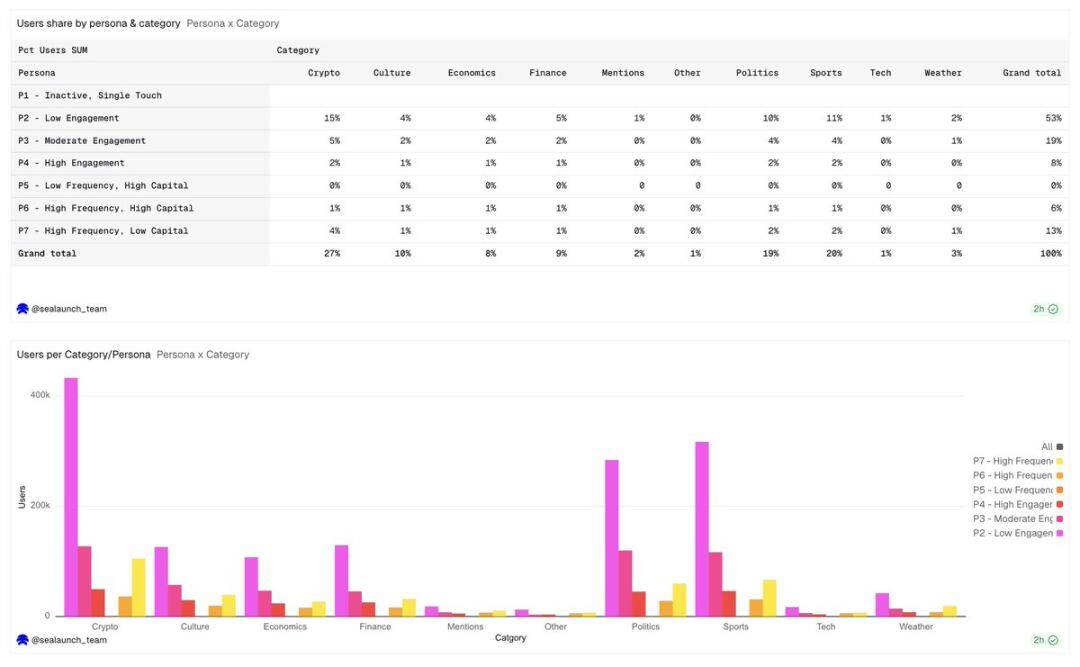
User distribution in different categories: showing stark contrasts with trading volume and transaction counts
The political category has the highest user proportion, reaching 19%, but the user number is relatively evenly distributed among all user groups. Low participation users (P2) have the highest proportion among political users; compared to other categories, these users are typically event-driven one-time retail investors, registering to participate in election betting.
The economics and finance sectors attract a disproportionate number of low-frequency high-capital (P5) participants, implying that while their trading frequency is low, each of their transactions involves a massive amount, as they invest substantial capital into macroeconomic outcomes but have relatively few trades.
The categories on the platform directly determine the user groups attracted and influence liquidity depth, user retention, and tolerance for fees.
A new cryptocurrency market will attract algorithmic traders and high-frequency traders; a new political market will attract event-driven participants, who may never return after the event ends. More specialized market formats, like binary options or structured outcome markets, may further attract high-frequency high-capital (P6) user groups, which already dominate the cryptocurrency market. If the goal is trading volume, then build towards the P6 user group. If the goal is user growth and brand influence, then build towards the P2 user group. These two objectives require starkly different category choices.
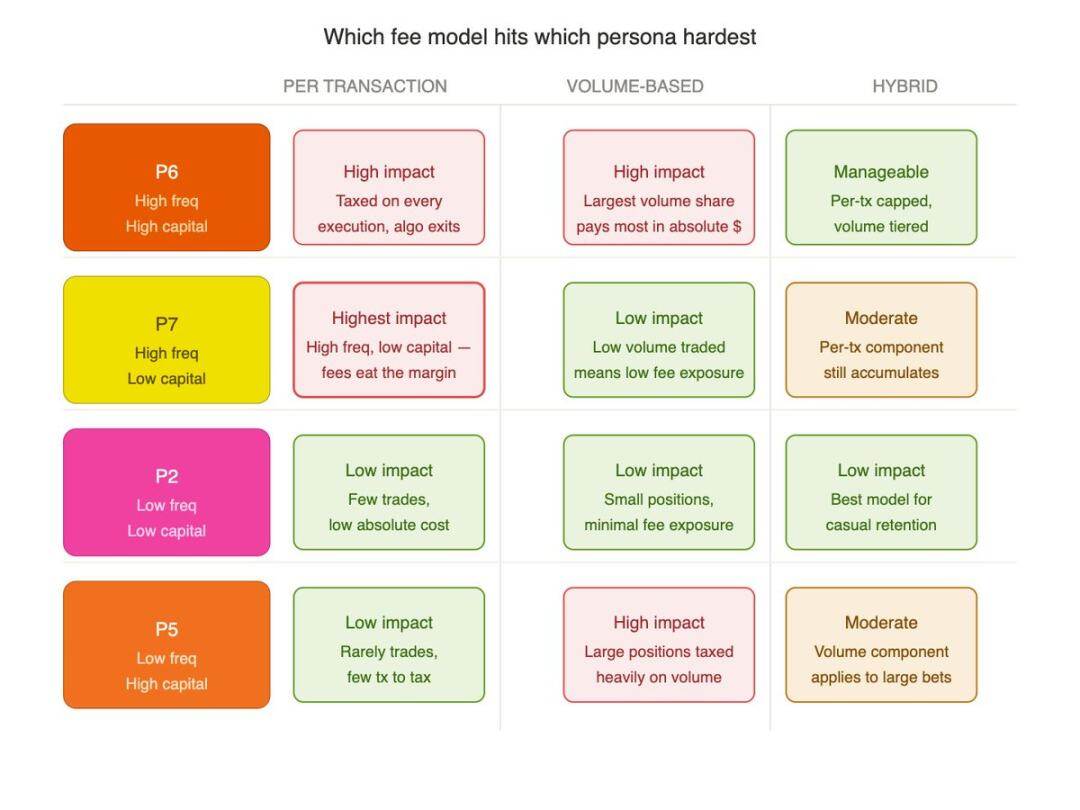
Insights on Fee Model
User tier profiling directly determines the fee design for prediction markets.
A fixed transaction fee model will overly suppress the interests of the P6 high-frequency high-capital and P7 high-frequency small groups, yet it is precisely these groups that sustain the liquidity foundation necessary for the platform's survival.
The value of differentiated fee rates across categories lies in this: the current fee rate system of Polymarket is precisely based on this logic:
- Effective fee rate for the cryptocurrency sector: 1.80%
- Sports sector: 0.75%
- Political & Financial sector: 1.00%
- Geopolitical sector: zero fees throughout
This standard is not arbitrarily set but is accurately matched to the user group structures and trading habits of each category. The cryptocurrency sector is filled with P6 algorithmic professional capital, able to bear high fees without damaging liquidity; the political sector primarily consists of low-entry retail investors, necessitating a reduction in friction costs to maintain retention. Designing fee rates divorced from user profiles essentially amounts to blind trials and errors.
Core Conclusions
- P6 high-frequency high-capital group accounts for only 2% of users, creating 88% of the platform's trading volume;
- Fee policies that harm P6 interests will severely undermine the platform's foundation;
- 69% of users are low-frequency small retail investors, driven purely by hot events;
- Cryptocurrency trading is highly concentrated among algorithmic high-frequency funds, while the sports sector has a more diverse participant structure;
- Ordinary users transact an average of only 12 times in 90 days, with a median total investment of $224;
- Expanding new categories requires anchoring on target user profiles, rather than merely chasing topical heat.
Conclusion
If trading volume is concentrated in a small high-frequency core area, why does Polymarket position itself as a retail product? Professional algorithmic funds support the vast majority of the volume, yet product experience, marketing strategies, and category layouts are always accommodating ordinary retail investors.
Part of the answer may lie in structural factors. The proliferation of smart agent frameworks, Telegram bots, and no-code tools now allows retail investors to easily engage in automated trading. If retail investors are beginning to engage in algorithmic trading, then the next natural evolution will be AI agents conducting large-scale high-frequency operations autonomously.
This could very well represent Polymarket's potential to nurture the first killer application at the intersection of cryptocurrency and artificial intelligence. In a market characterized by high liquidity, event-driven participation, and binary outcomes, autonomous agents can perform precise operations, absorbing world events, social sentiments, and real-time inference information, identifying mispriced trades, and executing transactions without human intervention. When this application achieves a breakthrough, it will no longer be just a cryptocurrency product. This will be the moment agent trading enters the mainstream market.
免责声明:本文章仅代表作者个人观点,不代表本平台的立场和观点。本文章仅供信息分享,不构成对任何人的任何投资建议。用户与作者之间的任何争议,与本平台无关。如网页中刊载的文章或图片涉及侵权,请提供相关的权利证明和身份证明发送邮件到support@aicoin.com,本平台相关工作人员将会进行核查。


