Original author: Glassnode
Original compilation: AididiaoJP, Foresight News
Bitcoin has stabilized around $70,000, with improved capital flow and reduced selling pressure. However, spot trading volume remains low, and supply pressure exists in the market, indicating that stronger demand is needed to push the market toward a sustained recovery.
Summary
- After a sharp sell-off that brought prices down to around $67,000, Bitcoin has gradually stabilized and rebounded to around $70,000, but the upward momentum remains hesitant.
- Realized losses have increased but have not yet exited the historical normal range, indicating market pressure, though a full capitulation phase has not yet begun.
- A significant supply of short-term holders is concentrated between $93,000 and $97,000, creating a key resistance area above.
- Realized losses remain high but without signs of panic, indicating that the current phase is one of orderly risk reduction rather than panic selling.
- Spot trading volume stays sluggish, with no significant increase during price recovery, reflecting a lack of market confidence, with only selective bottom-fishing activity.
- After a period of sustained net outflows, fund flows into U.S. spot exchange-traded funds have turned to slight net inflows, indicating that institutional funds may be beginning to re-enter.
- The perpetual contract funding rate remains negative, reflecting continued bearish sentiment in the market and cautious deployment of derivative positions.
- The open interest in futures remains relatively low, indicating limited leverage supporting this rebound.
- In the options market, skew indicators are stabilizing, with implied volatility fluctuating within a range, indicating a decrease in demand for hedging downside risks.
- Market maker Gamma positions have slightly turned positive, showing an improvement in liquidity conditions and a more balanced market structure.
On-chain Insights
Higher lows, heavy upper pressure
Despite ongoing geopolitical tensions impacting stock, energy, and commodity markets, Bitcoin has continued to make higher highs and higher lows since early March, establishing a somewhat constructive structure within the $60,000 to $70,000 range.
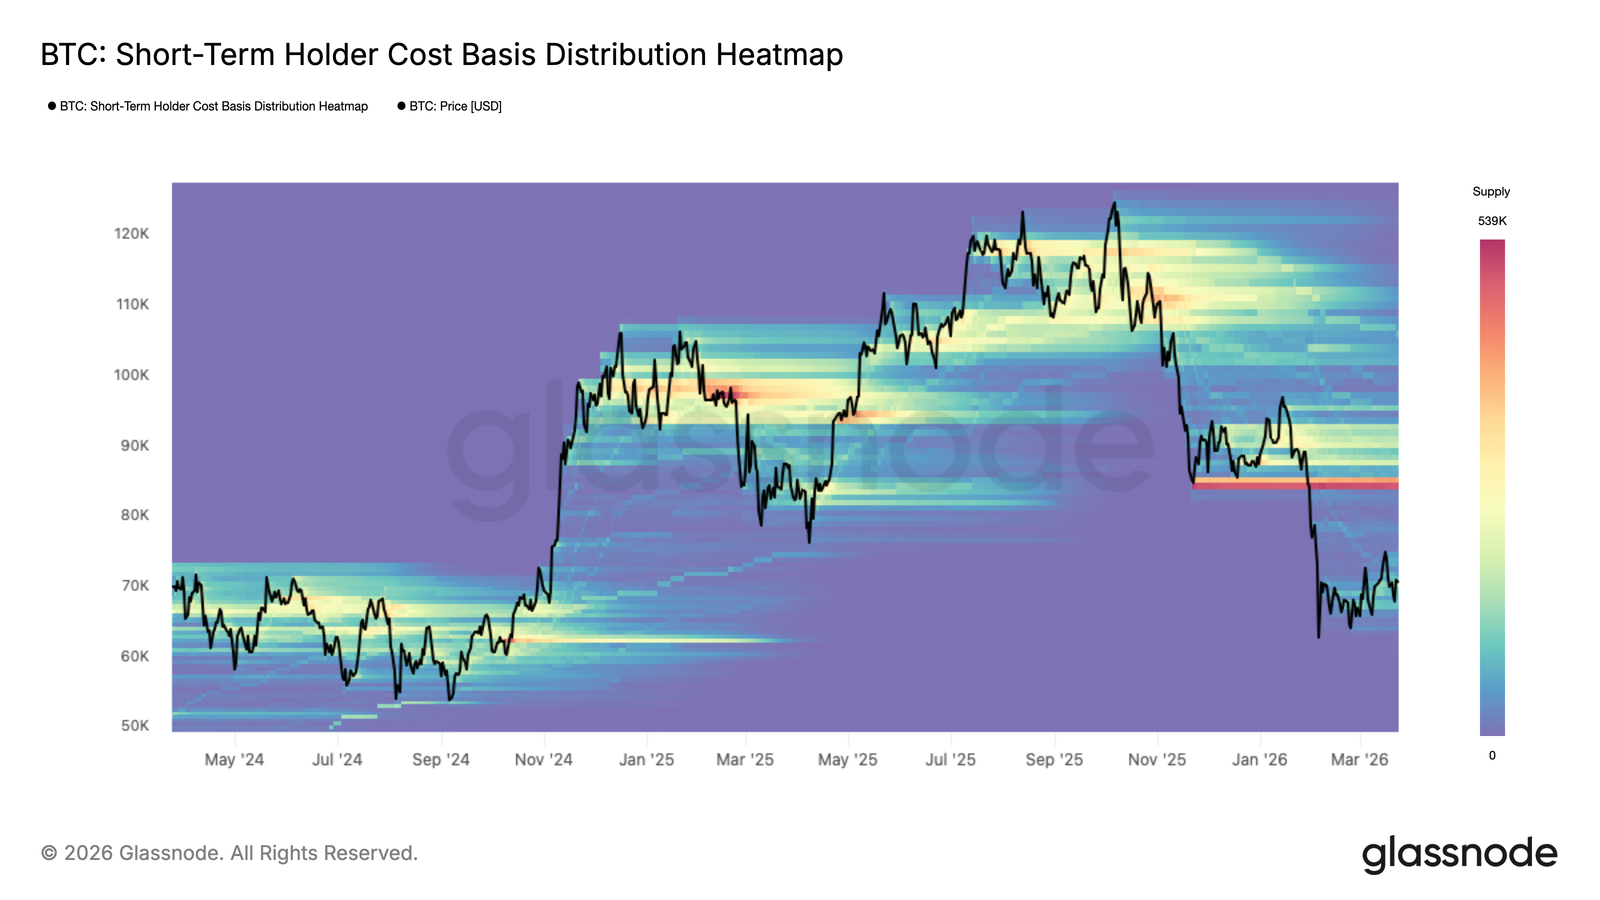
If the current resilience can be maintained, the market may lay a relatively solid foundation for long-term upward movement. The cost basis distribution heatmap for short-term holders shows areas of recent supply concentration, helping to identify potential supply and demand positions from the perspective of new entrants.
Within the current price range, new accumulation areas are gradually forming; while the scale is not large, it is enough to explain part of the recent price upward momentum. However, from a mid-term perspective, a more prominent risk lies in the existence of a significant supply of short-term holders above $84,000. Whether the price rises back to that area or faces market pressure again, this group may amplify selling pressure.
Mid-term range
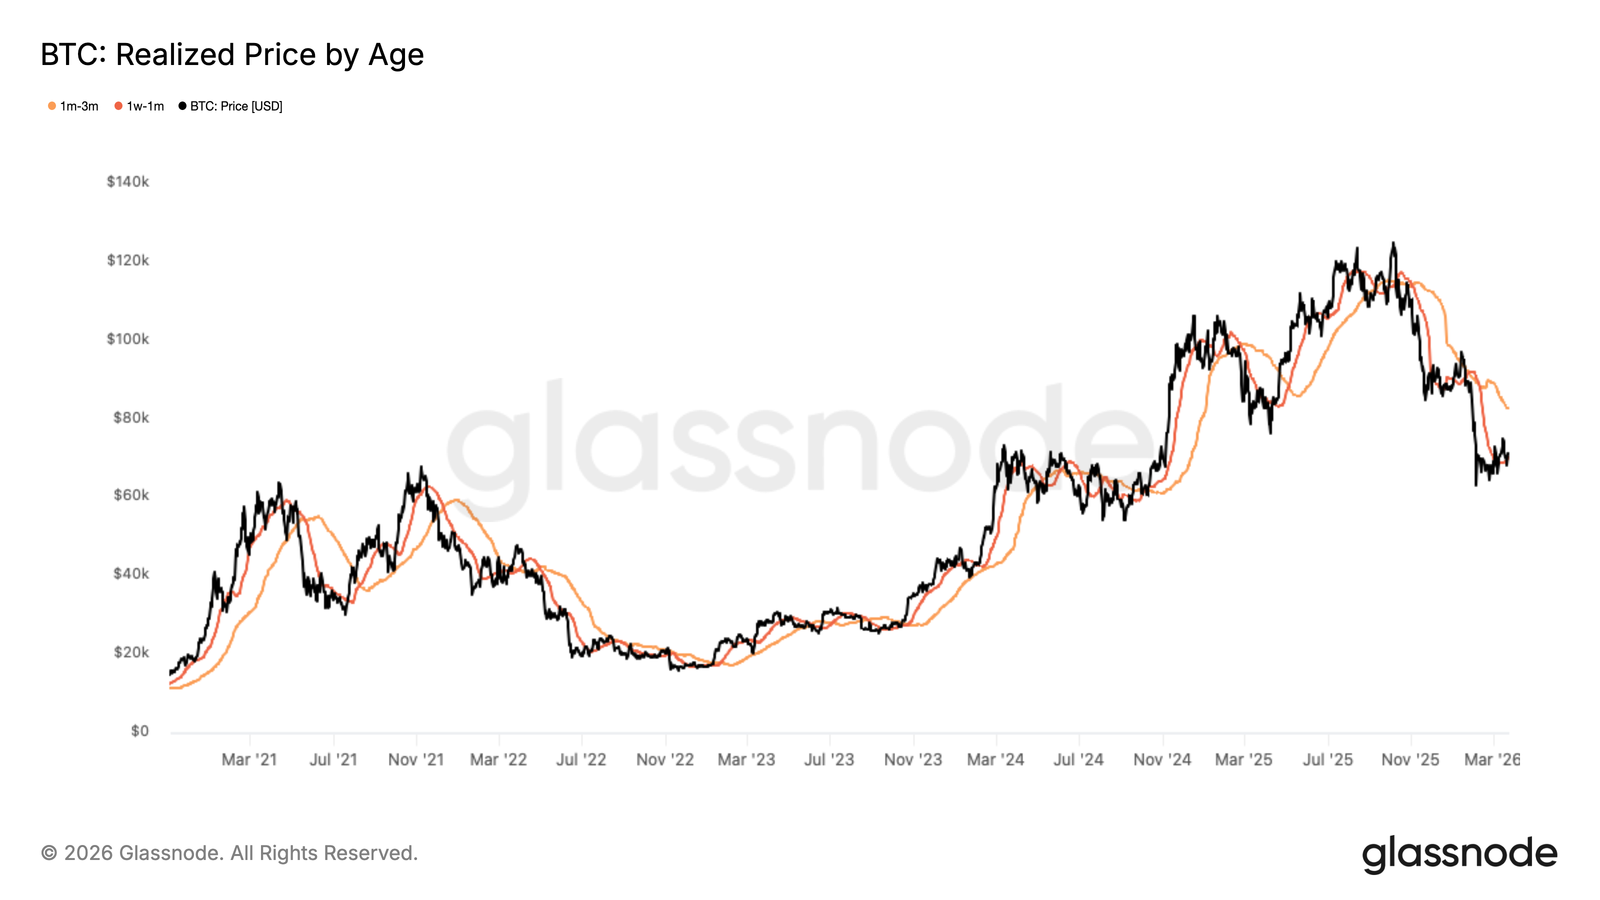
Based on the aforementioned supply dynamics, the realized price breakdown by holding period provides a more refined view, showing the distribution of cost bases among different investor groups. This indicator tracks the average purchase price of tokens with different holding periods, helping to define recent support and resistance levels from the perspective of investor behavior.
Currently, the group holding for 1 week to 1 month has a cost basis of about $70,200, forming a developing support level; the group holding for 1 month to 3 months has a cost basis of about $82,200, further strengthening the aforementioned upper resistance.
Overall, these two price levels jointly define the most likely range for mid-term price movements. However, given the current accumulation area's still limited scale, the solidity of the $70,200 support leve is yet to be tested. Before establishing a more solid buyer base, it is crucial to remain vigilant about the possibility of prices breaking below this level.
Fear intensifies, yet no capitulation
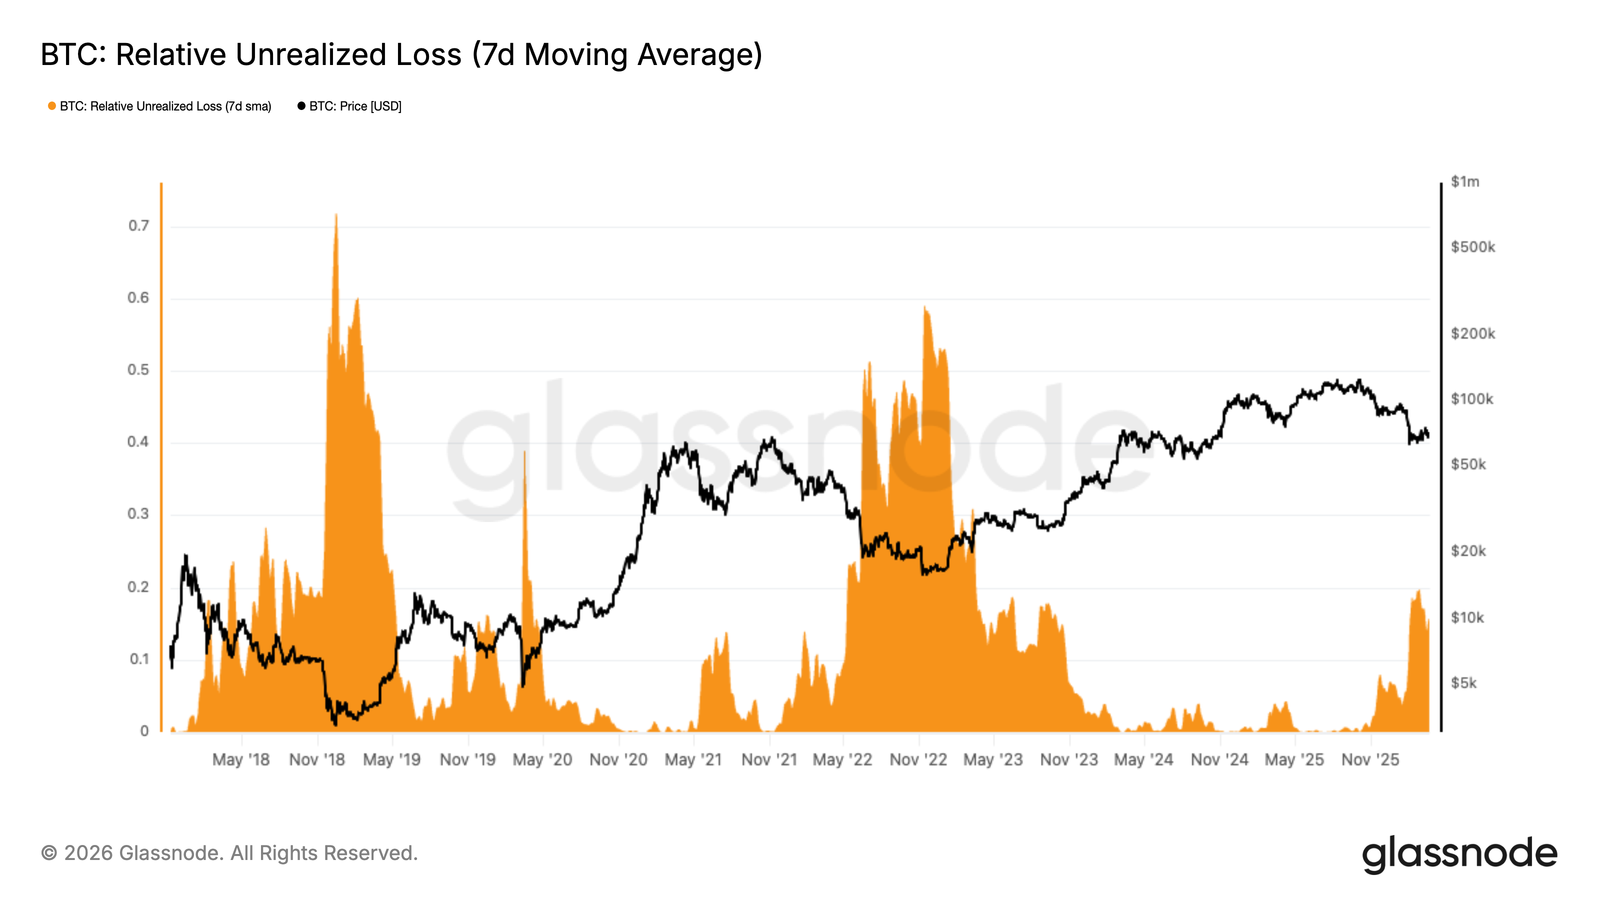
Expanding outward from the detailed cost basis indicators, profit and loss indicators provide a more macro cyclical perspective by exploring the balance between greed and fear in the market. The ratio of realized losses relative to the market cap is an important gauge for potential selling pressure and market sentiment.
For the past two months, this indicator has consistently held above 15% of the market cap, with a structure reminiscent of the second quarter of 2022. This suggests that current market sentiment is in a state of high fear but has not yet reached a full capitulation level seen during extreme stress events like the FTX collapse. Historically, reducing the current level of unrealized losses typically requires time, further price adjustments, or both. Although there is a theoretical possibility of a rapid V-shaped reversal, considering the current scale of unrealized losses, it would require consistent and strong new capital inflows in the short term.
Profit flows exhausted
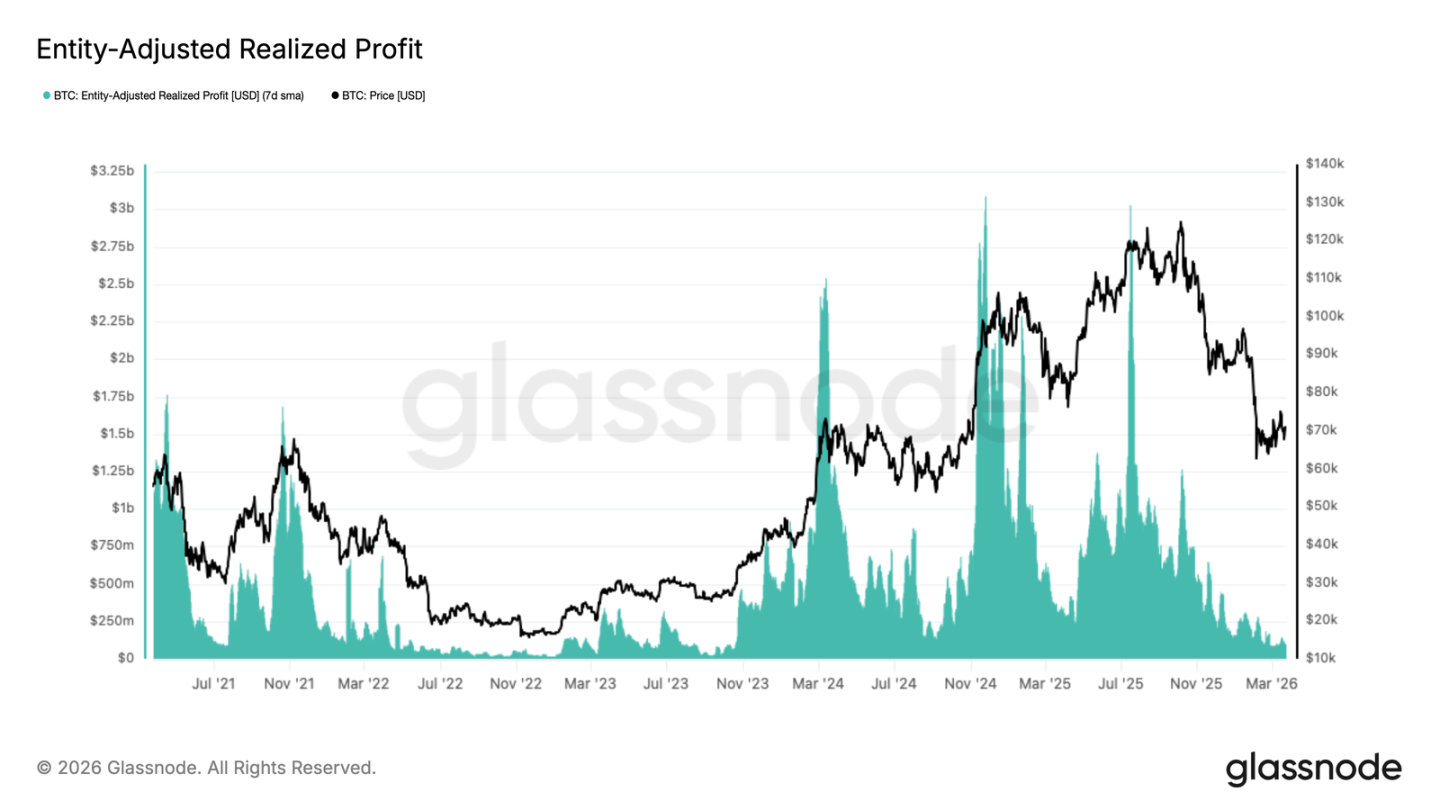
In the context of rising unrealized fear sentiment, realized profit levels have significantly contracted since Q4 2025, further confirming the trend of weak demand.
Realized profits adjusted for entities (using a 7-day simple moving average for smoothing) exclude internal transfers within exchanges, accurately reflecting the genuine profit-taking activities within the network. This indicator has decreased from a daily peak of about $3 billion in July 2025 to less than $100 million currently, a reduction of over 96%. Such a sharp contraction is typical of the later stages of a bear market, during which sellers still holding profitable positions have largely cleared out, leading on-chain liquidity to drop to cycle lows. This environment, while reducing short-term selling pressure, also reflects a lack of new capital inflows needed to support a sustained market recovery.
Off-chain Insights
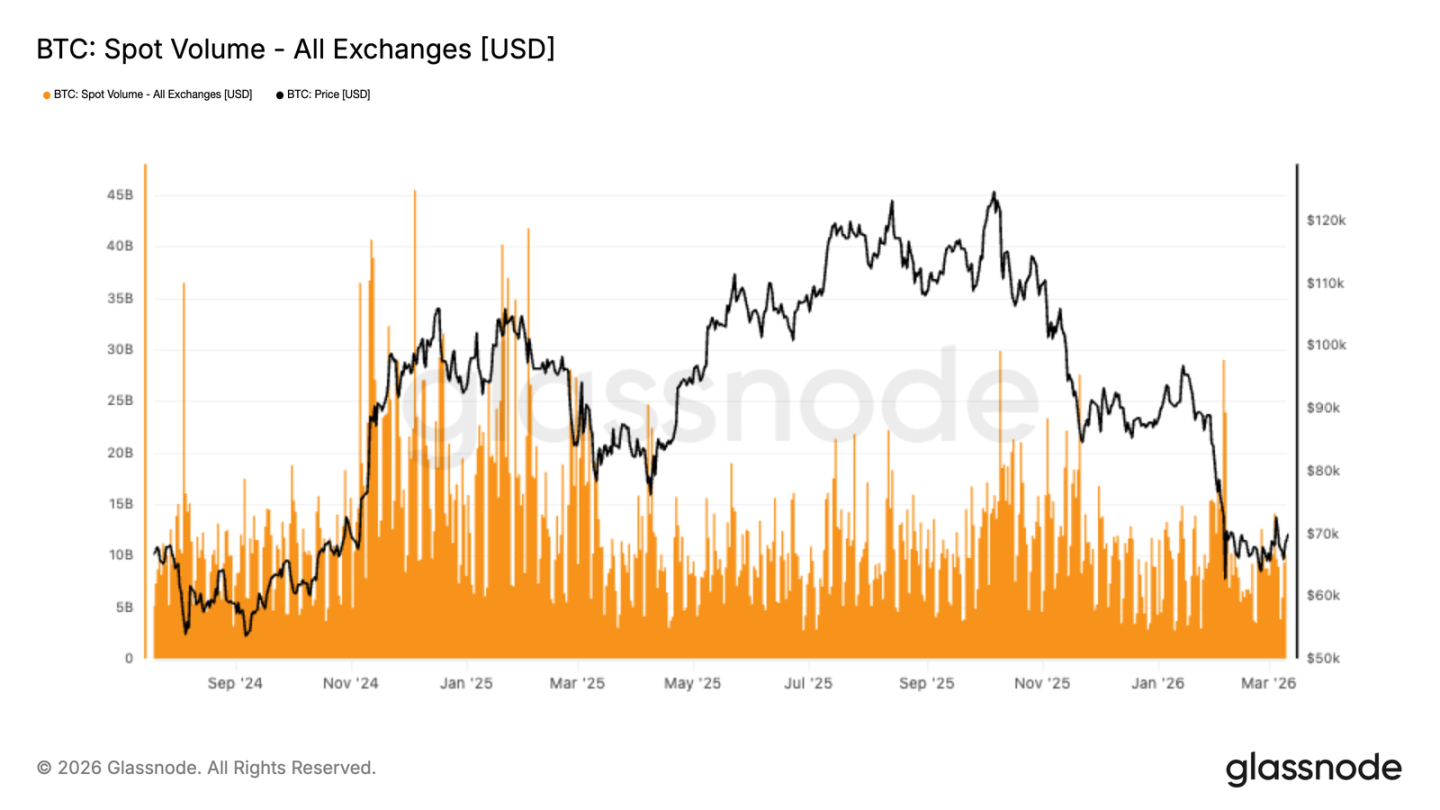
Spot trading volume remains sluggish
After the price sharp decline to the $67,000 region, overall activity in the spot market remains muted. In the subsequent recovery process, trading volume on major exchanges only showed a mild response. Despite some short-lived spikes, these reflected more passive reactions rather than signals of a sustained return of buying based on confidence.
Compared to the previous active participation during the rising phase, current spot trading volume is still weak. This indicates that the recent price rebound to around $70,000 relies more on some funds’ bottom fishing and short-term position adjustments, without forming a substantial spot demand support.
The divergence between price stabilization and low spot participation indicates that the market is still in a rebalancing process. Before spot trading activity shows more sustained expansion, the continuation of the upward trend may be relatively fragile, and price movements may be more sensitive to changes in derivative capital flow and liquidity conditions than to organic accumulation.
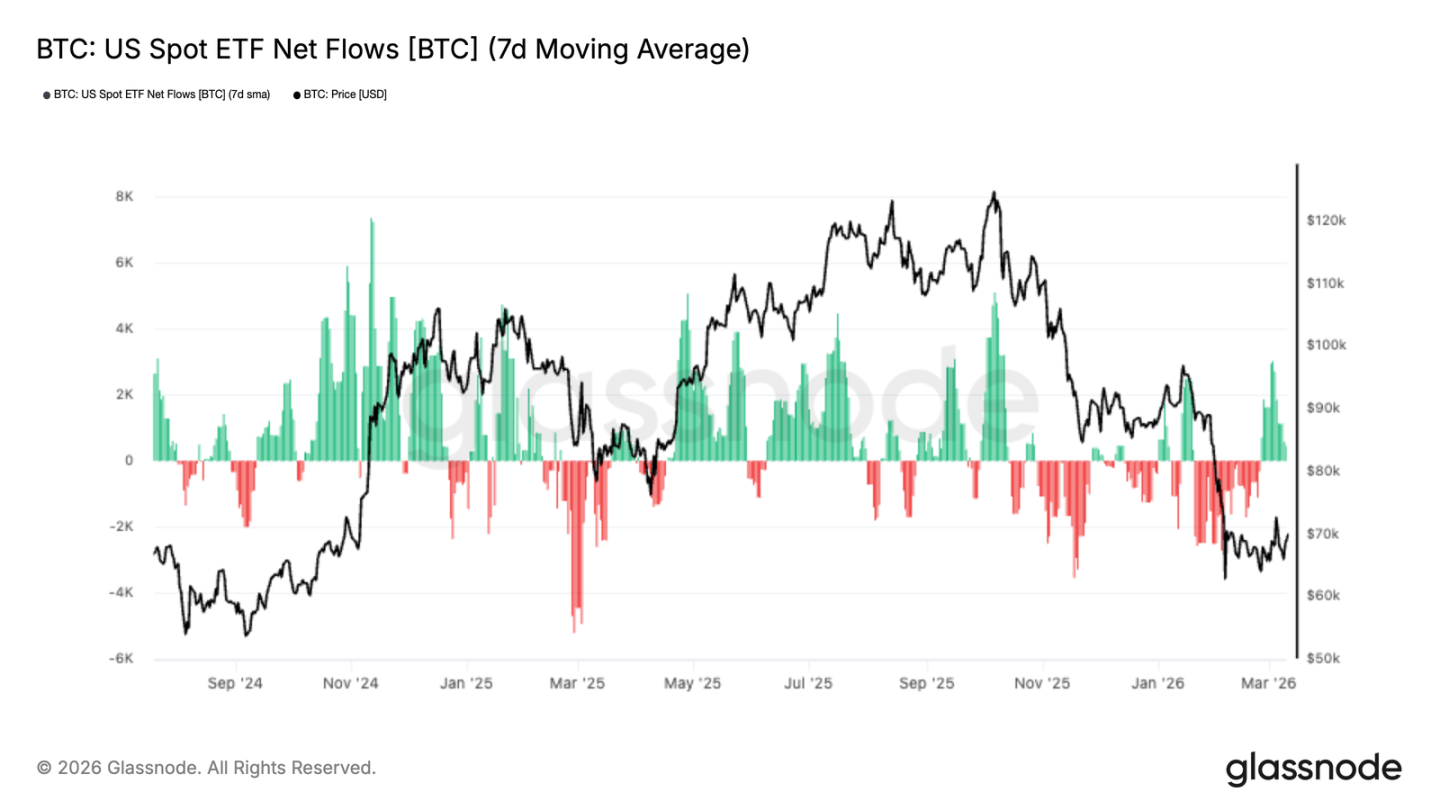
Exchange fund flows rebound
After a prolonged period of net outflows, U.S. spot exchange-traded fund fund flows have recently shown initial signs of improvement, with the 7-day moving average slightly turning positive in recent trading days. This indicates that as Bitcoin gradually stabilizes and recovers from the drop to the $67,000 region, institutional demand may be slowly returning.
Although the absolute scale of current capital inflows remains limited compared to the previous accumulation phase, the direction change is noteworthy. The previous outflow phase was accompanied by a soft price trend and low market sentiment, while the recent rebound in fund flows indicates that traditional market participants are tentatively re-entering.
This shift is significant because, during this current cycle, demand for exchange-traded funds has become an important support force for the spot market. If capital flows can continuously maintain net inflows, it will help confirm that institutional investor confidence is recovering and beginning to rebuild exposure.
Overall, the current recovery is still in an early and mild stage, but compared to the continuous outflow situation of the past several weeks, the turn in capital flows marks a certain degree of positive change in market structure.
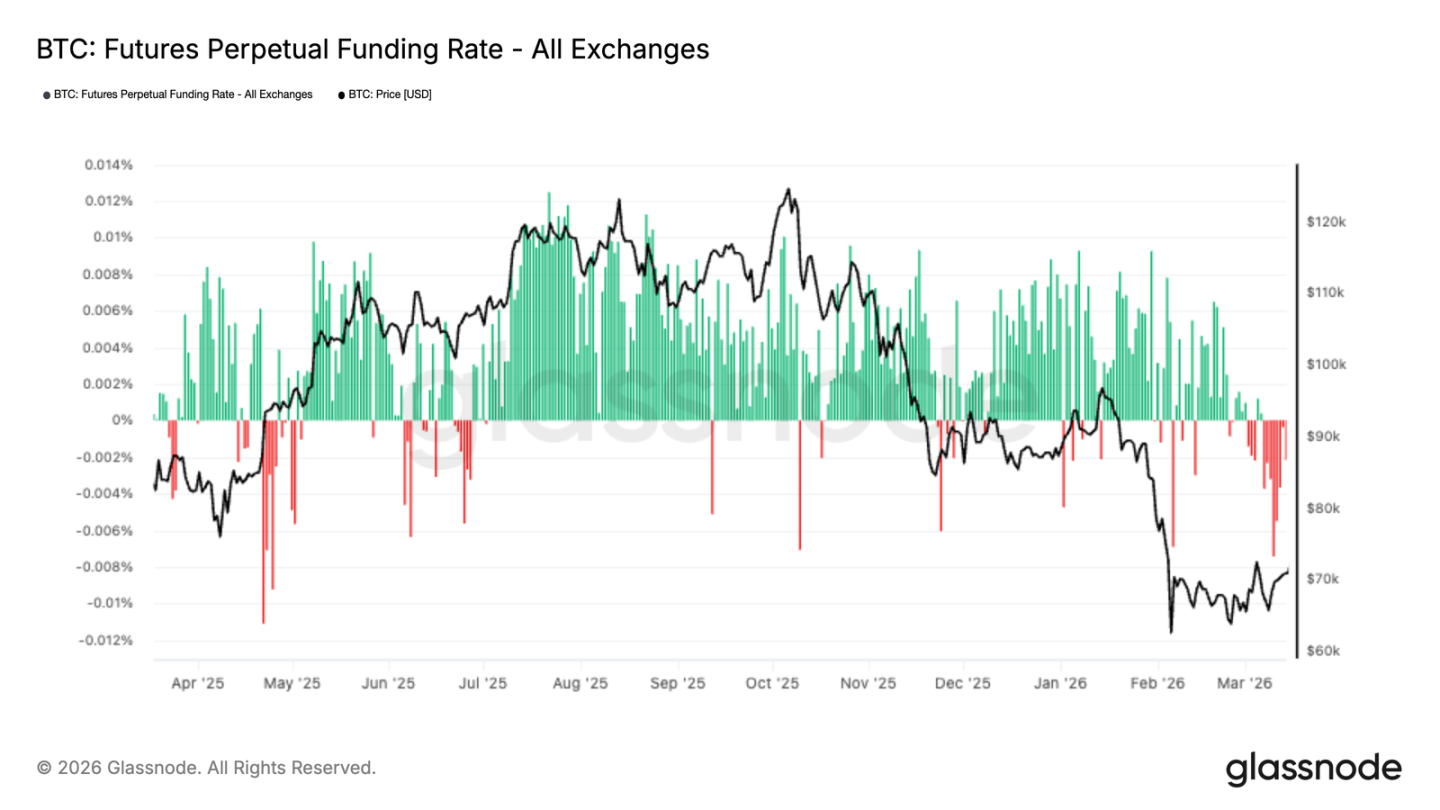
Negative funding rate persists
Despite Bitcoin's price gradually stabilizing and attempting to recover from recent adjustments, the perpetual contract funding rate remains negative. This indicates that short positions still dominate, and traders are willing to pay funding costs to maintain exposure in the downward direction.
The continuing negative funding rate reflects that participants in the derivative market generally have a cautious attitude. Even with some improvement in price structure, traders still have not shown a willingness to actively rebuild long positions. This contrasts with past recovery phases where funding rates typically restored to normal or even became positive as sentiment warmed.
From the position structure perspective, the sustained negative funding rate may, to some extent, become a potential driving factor for price ascents, as it reflects an oversaturation of short positions; if upward momentum continues, the market may face short squeeze risks. On the other hand, this also indicates that the market's confidence in the current recovery remains limited, especially evident among leveraged traders.
The current pattern shows that position layouts in the derivatives market are still skewed towards defense. Despite signs of stabilization in spot and exchange-traded fund fund flows, overall risk appetite still leans towards bearish.
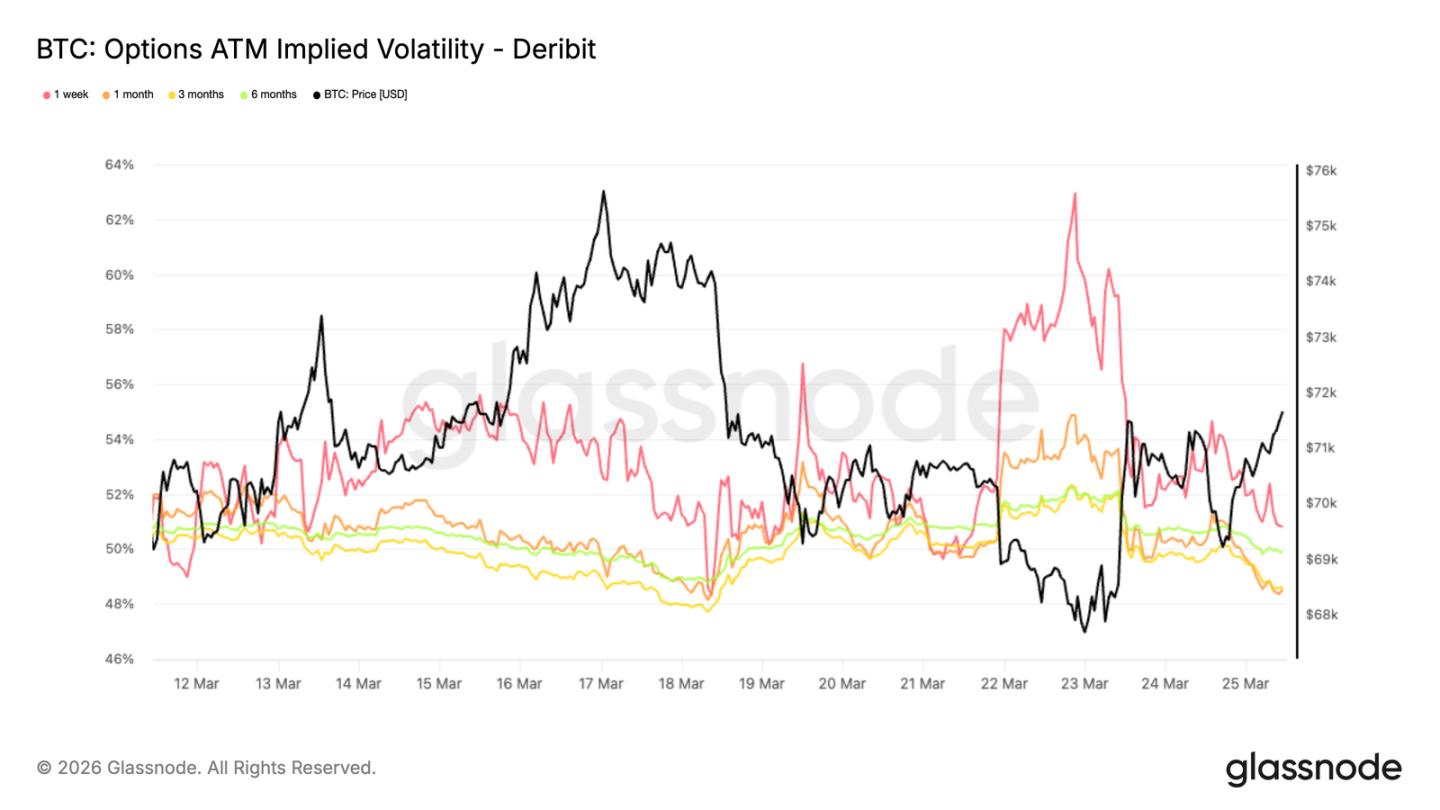
At-the-money implied volatility: Range-bound, awaiting direction
In the options market, Bitcoin at-the-money implied volatility exhibits characteristics similar to the spot market, remaining in a range-bound oscillation with mean reversion tendencies. The front end of the volatility curve is most sensitive to macro events and changes in short-term news. One-week contracts exhibit relatively larger volatility, but the overall trading range remains constrained between 50% and 60%. The far end of the curve maintains implied volatility below 50%, with limited differences between contracts of various terms.
Overall low implied volatility reflects that the market is waiting for new catalysts to reprice two-way risks. The levels of implied volatility for long-term contracts are suppressed, indicating that the market has not experienced structural changes in pricing long-term risks; short-term volatility is mainly driven by trading behavior of near-month contracts. In this environment, volatility tools are more used to address short-term uncertainties rather than to express long-term directional views.
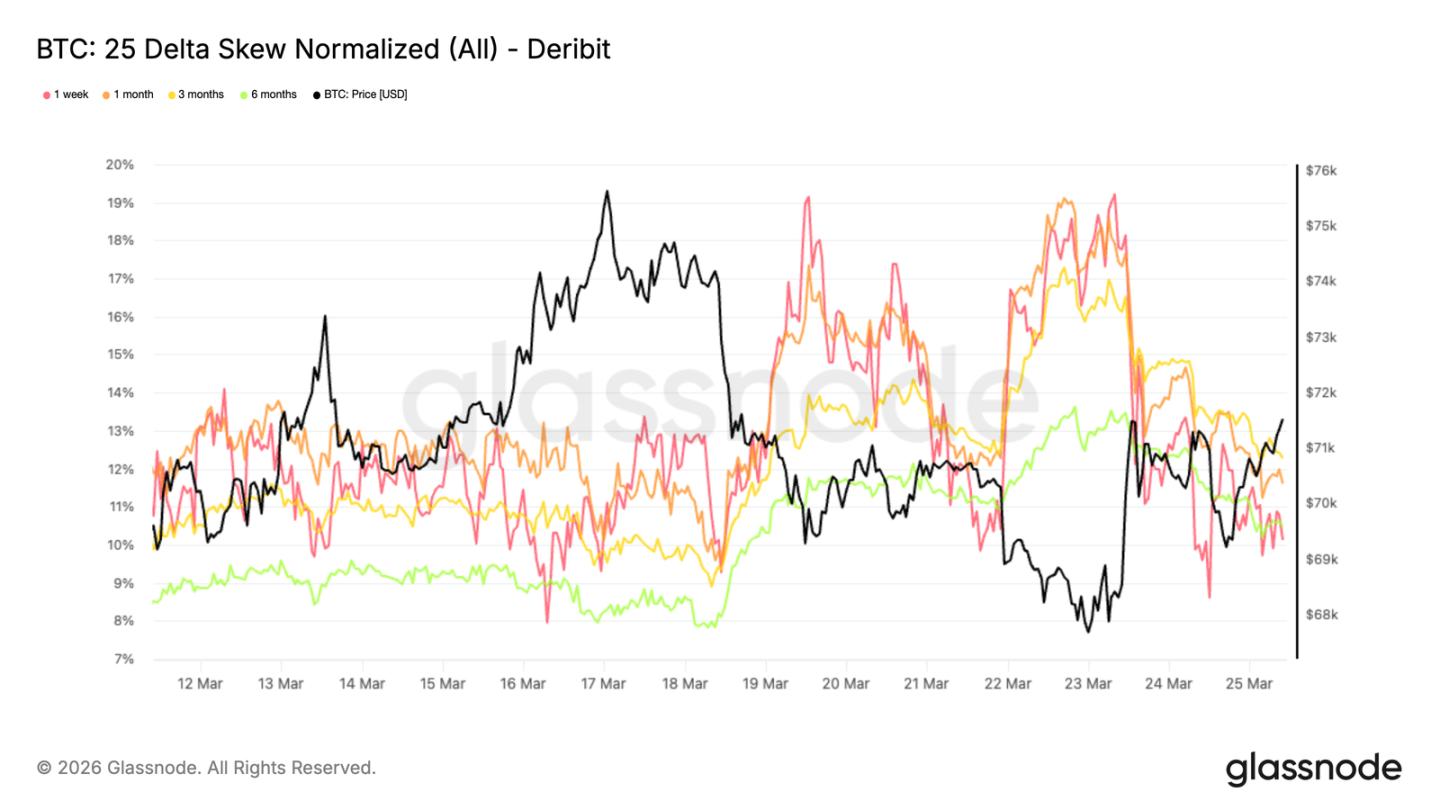
25 Delta Skew: Downside protection still dominates
During the brief upward spike in volatility this week, the skew indicators widened in the direction of put options, confirming that the current volatility revaluation is mainly driven by downside protection demand.
The 25 delta skew (an indicator that measures the relative cost of put options to call options at the same delta value) surged to a range of 18% to 19% when Bitcoin's price fell below $68,000 earlier this week. This clearly indicates that amid heightened geopolitical uncertainty, once the price shows fatigue, market demand for short-term downside protection rapidly increases.
Afterwards, the skew indicators retreated slightly but remain relatively high, with skew levels across various term contracts being closely clustered between 10% and 12%. The convergence of skew values among contracts of different terms indicates that the market's preference for downside protection is not confined to near-month contracts but reflects a widespread and sustained risk-averse hedging tendency among market participants.
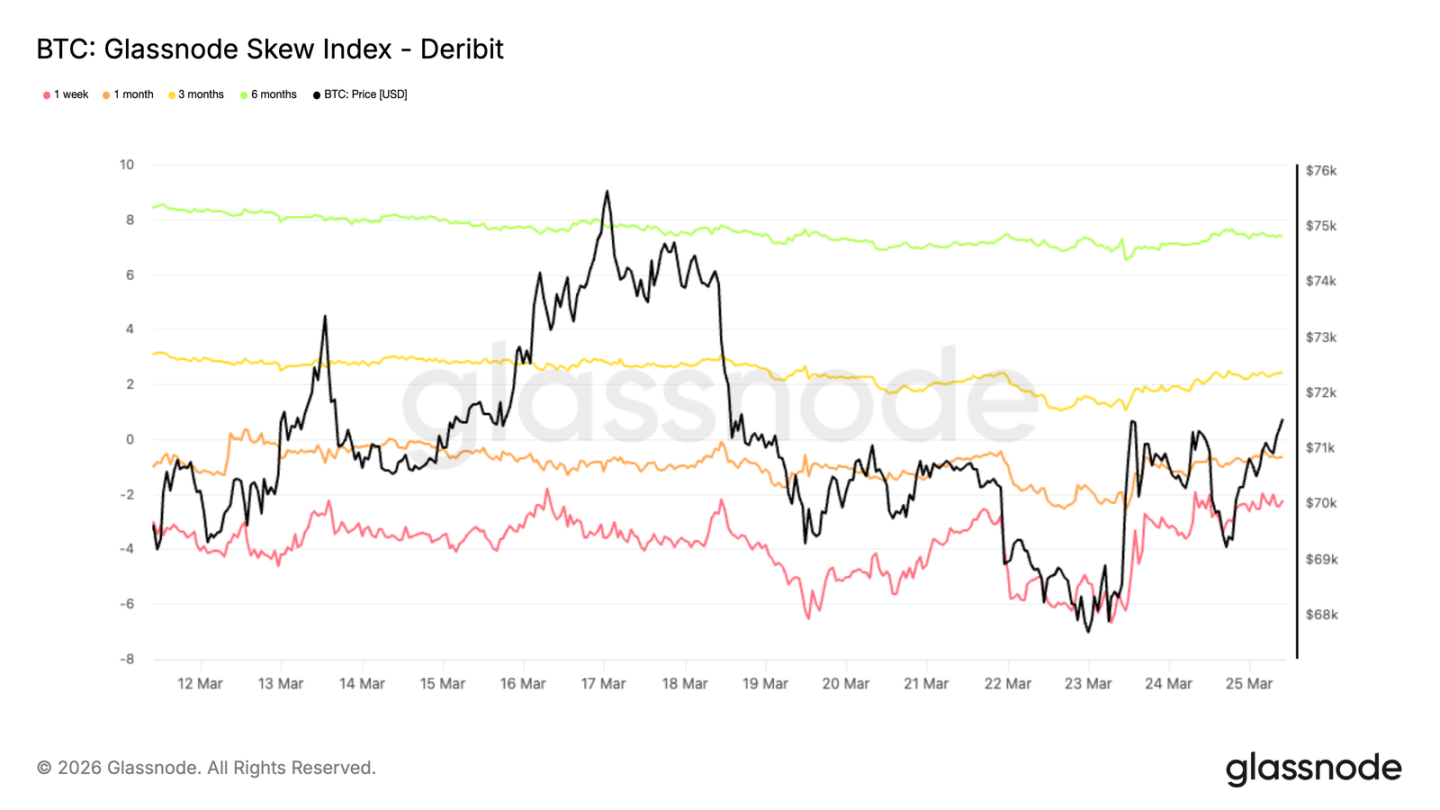
Skew index shows different tones
The skew index provides another dimension to observe the conditions of the options market. Unlike the 25 delta skew, this index gives higher weight to low delta options in its calculation, providing a more comprehensive reflection of the pricing situation in the tail distribution. Currently, the skew index readings for one-week and one-month terms remain in bearish territory, while three-month and six-month term readings (around 2.4% and 7.4% respectively) have shifted to bullish territory (the index calculates as call options minus put options).
This creates a noticeable divergence pattern. The 25 delta skew shows bearish tendencies across all terms, while the long-term portion of the skew index indicates that in the far end of the curve, the pricing of upside tail risks exceeds that of downside tail risks. This means that although mid to low delta put options still have buying support, the market has not significantly accumulated deep out-of-the-money downside protection for longer terms. Overall, the options market pricing reflects short-term cautious sentiment but leans towards a balanced or slightly positive long-term structure. This feature is relatively common in the crypto asset market, where participants tend to use deep out-of-the-money call options to capture asymmetric upside potential.
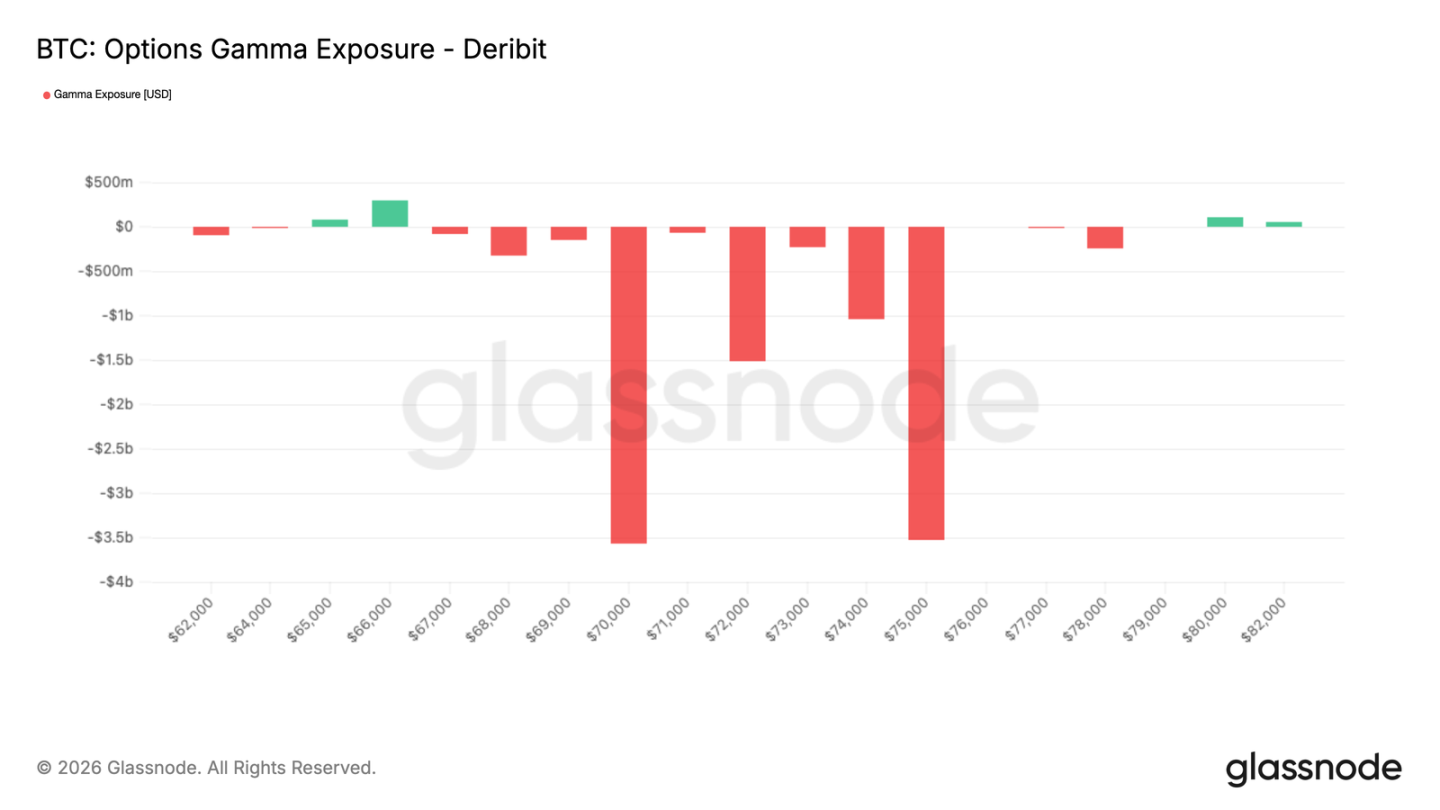
Market maker Gamma: Expiry will reset market structure
March 27, Friday, is a common expiry date for weekly, monthly, and quarterly options contracts. Such concentrated expiry situations typically have significant effects on Bitcoin price trends. As the options market continues to expand, market makers' hedging actions are increasingly impactful on prices in the short term. With less than 48 hours until expiry, market makers are generally in a short Gamma position, with risk exposure concentrated in the $70,000 to $75,000 range. In this area, particularly in an environment with relatively thin liquidity, prices may exhibit accelerated bidirectional volatility.
It is noteworthy that the upcoming expiring positions are substantial. Approximately $10 billion of market makers' short Gamma positions are set to close, indicating a significant mechanical price driver will soon be removed. Once these positions are settled, the extent to which market prices are constrained by hedging capital flows will decrease, and the response to external factors is expected to become more sensitive. In this context, changes in the macro environment may become key factors affecting Bitcoin's search for its next equilibrium position.
Conclusion
After a relatively sharp correction, the Bitcoin market has begun to show some positive signals: prices are gradually stabilizing, fund flows into exchange-traded funds have improved, and the position structure in the derivatives market is no longer exhibiting unidirectional characteristics. The pressure accumulated during the recent sell-off seems to be easing, and the market condition is becoming more balanced compared to a week ago.
However, the current environment is not sufficient to support a high-conviction breakout trend. Spot trading volume remains low, and there has not been significant expansion in open interest, with concentrated supply pressure still present in the market above. Overall, the market structure is repairing, but to establish a more sustainable upward trend, stronger market participation is still needed to confirm.
At this stage, the market structure displays constructive characteristics but has not yet transitioned into a clear bullish state. If demand can continue to return, the market will gradually nurture opportunities. However, final confirmation that this recovery possesses substantive momentum still hinges on a significant increase in spot trading volume and sustained inflow of new capital.
免责声明:本文章仅代表作者个人观点,不代表本平台的立场和观点。本文章仅供信息分享,不构成对任何人的任何投资建议。用户与作者之间的任何争议,与本平台无关。如网页中刊载的文章或图片涉及侵权,请提供相关的权利证明和身份证明发送邮件到support@aicoin.com,本平台相关工作人员将会进行核查。


