Cryptocurrency Circle Academician: 3.24 Ethereum 2160 bottoming up, is it a rebound or a reversal? These positions determine the market direction! Latest market analysis and thought references
The current price of Ethereum is 2060. Before the article was published, many brothers asked me if the second one could chase after it was pulled from 2020 to 2160? Is it going to reverse? Don't worry, let’s analyze the chart. This upward movement is not a result of random pumping; it is a result of oversold recovery combined with market emotion resonance. However, the signals for trend reversal have not fully materialized, and blindly chasing highs can easily lead to losses!
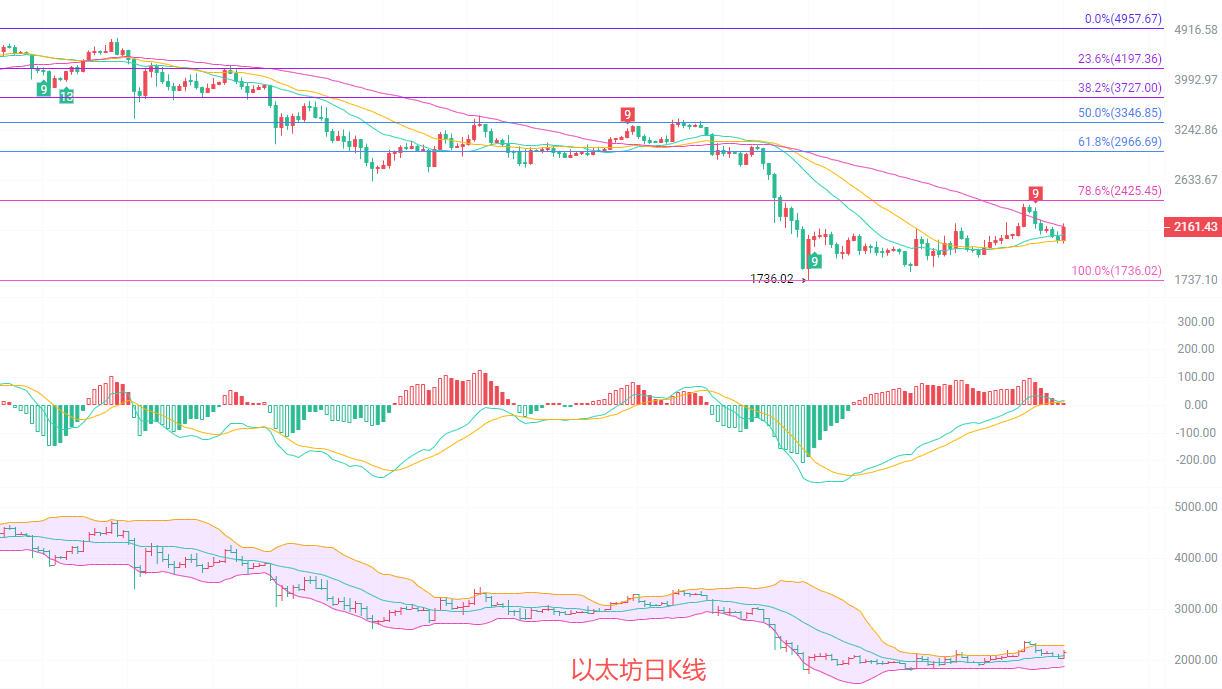
The daily line has not broken key resistance since bouncing from the low of 1736. It has recovered some of the previous drop but is still within a downward framework. The price has rebounded to the Fibonacci 0.786 resistance level below 2245 and has not broken the downward trend line since 2385. This is a technical repair after the oversell, not a trend reversal. The MACD green bars are narrowing, and DIF is about to cross above DEA, but it is still below the zero axis, indicating that the upward momentum is still accumulating. The price has risen above the MA20 and MA30 moving averages, but the MA60 line at 2171 is still suppressing it, and the downward arrangement of moving averages has not been completely broken; the large cycle downward trend still dominates.
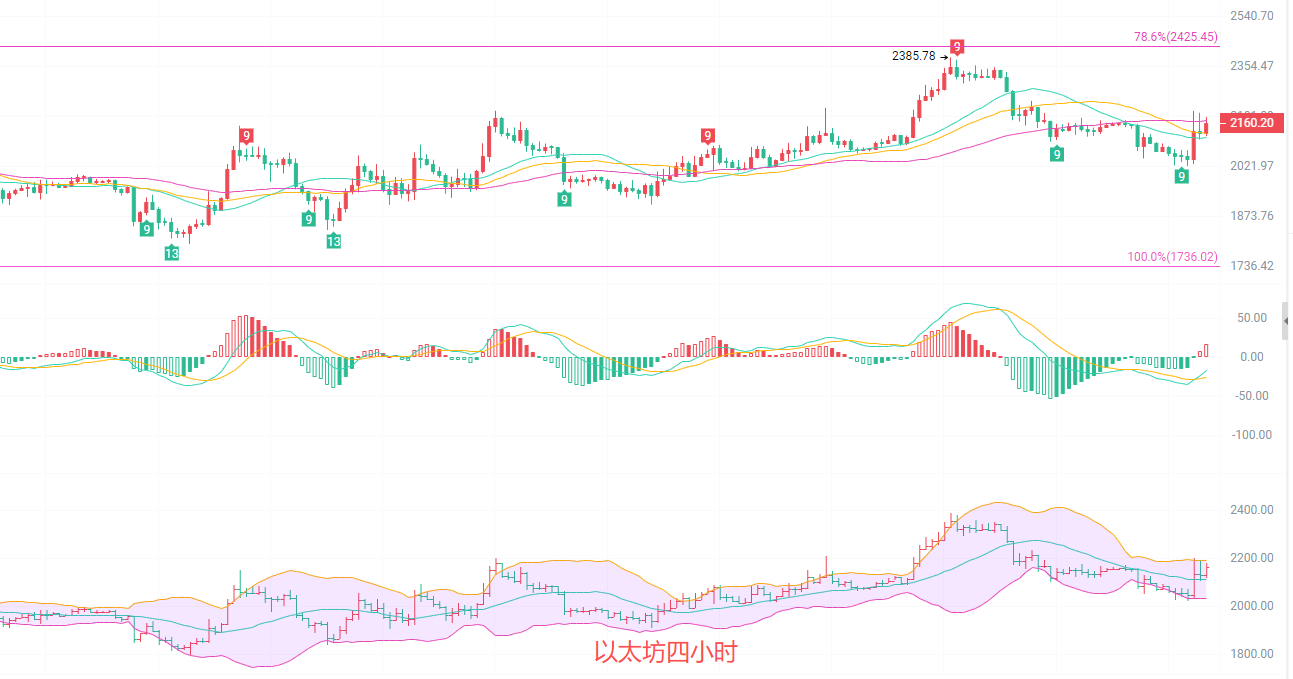
The four-hour short-term rebound has risks of manipulation. The short-term trend is clearer, with the price quickly rising from the 2021 low point, breaking the upper Bollinger Band before retreating. It is currently oscillating around 2160, which is a typical short-term rebound characteristic after a sharp rise. The MACD golden cross has seen a slight increase in red bars, but DIF has not stabilized above the zero axis. Strong pressure above the key position is at the Fibonacci resistance of 2245, with support below at the Bollinger middle track of 2080. After this range oscillation, it is highly likely to choose a direction; at this time, what we need to do is wait for the right moment.
Short-term reference: (Practical data has been updated, please consult the author for details)
Upwards from 2100 to 2120, stop loss at 2080, target looks at 2160 to 2180. This is purely speculative short-term rebound, definitely not a trend-based buy, please control your position.
Downwards from 2180 to 2200, stop loss at 2245, target looking at 2120 to 2100; if it breaks below 2100, continue down to 2080 to 2050.
Specific operations should be based on real-time market data. For more information, please consult the author. There may be delays in article publication; the information is for reference only and risk is borne by the reader.

Kind reminder: The content above is solely created by the author’s official account. The advertisements at the end of the article and in the comments section are unrelated to the author. Please discern carefully, and thank you for reading.
免责声明:本文章仅代表作者个人观点,不代表本平台的立场和观点。本文章仅供信息分享,不构成对任何人的任何投资建议。用户与作者之间的任何争议,与本平台无关。如网页中刊载的文章或图片涉及侵权,请提供相关的权利证明和身份证明发送邮件到support@aicoin.com,本平台相关工作人员将会进行核查。