Dear students, we meet again, I am Sister Qinglan. Today we will break down and analyze the data at hand to see what story the market is telling. Remember, price action is the market's most honest language, and we need to learn to listen.
1. Market Structure Identification: "Twisting a Twist" Across Multiple Timeframes
Let’s start from the larger picture down to the smaller.
Daily Chart (1d): The last two candlesticks closed at 67859.0 and 68241.26 respectively. Looking back, the high reached 71100.94 on March 23 and the low was 67360.66 on March 22. The price oscillates back and forth within this broad range, and the moving average system (MA5=69092.23, MA10=70952.89, MA30=69069.97) is also intertwined. Thus, the daily level is a typical oscillation structure without a clear direction.
4-hour Chart (4h): The situation is clearer here. Examining the last 20 candlesticks, a clear high point is 68847.96, followed by a price drop, and the latest closing price is 68241.26. An earlier low was at 67859.0. After testing the low, the price rebounded slightly but remained suppressed below the MA30 (70193.87), and MA5 (68273.22) is below MA10 (68956.96), which is a bearish arrangement. Therefore, the 4-hour is a weak rebound in a downward structure.
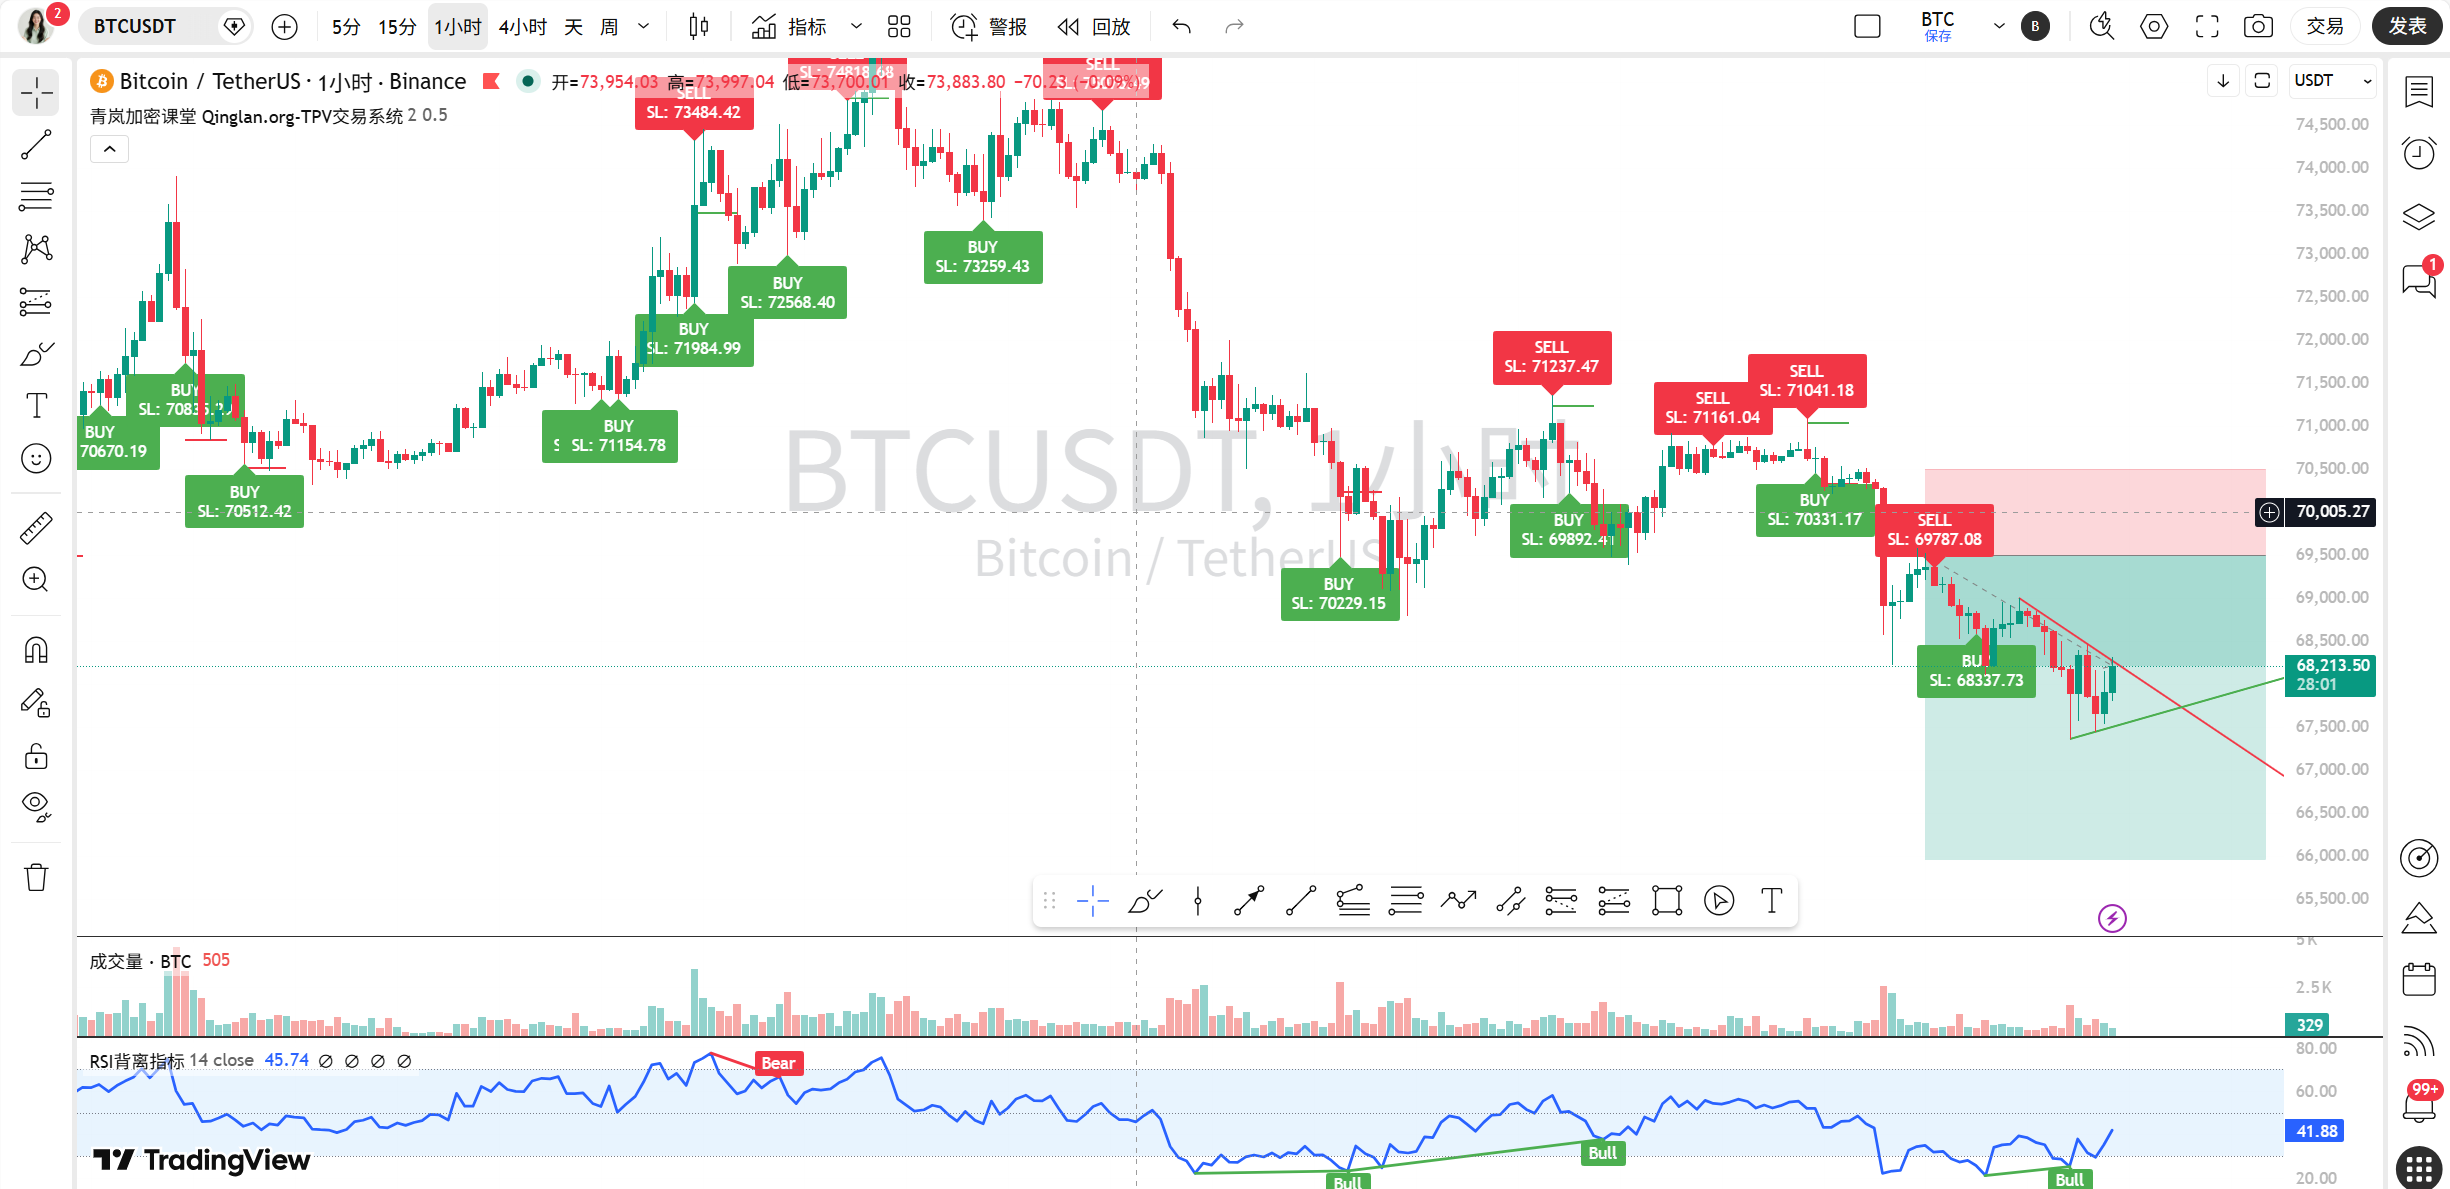
1-hour Chart (1h): There are subtle changes here. The latest closing price of 68241.26 is higher than the low of the previous candlestick (data not provided, but the sequence shows the previous close was 67905.0). The recent high is at 68847.96, and the low is at 67859.0. Although the moving averages remain in a bearish arrangement (MA5=68002.92 < MA10=68158.26 < MA30=68749.02), the MACD shows a slight golden cross signal (DIF=-415.01, DEA=-420.27, Histogram=5.25). Therefore, the 1-hour chart shows initial signs of stability within a downward trend.
15-minute Chart (15m): This is a typical oscillation. The price fluctuates within a range of tens to over a hundred dollars, and the latest several candlesticks do not form a coherent higher high or lower low. Thus, the 15-minute is purely an oscillation structure.
To summarize: The market is like “twisting a twist”, with broad cycles oscillating, medium cycles leaning bearish but showing small-level stop signals, while the smallest cycle is in chaos. This structure easily confuses those who chase after highs and lows.
2. Key Levels and Price Rejection Signals
Let’s focus on the last 24 hours (approximately corresponding to the 1-hour data). A key support area is around 67800-68000 dollars. 👉 Looking at the 1-hour chart, after closing near 67859.0 (the third to last in the sequence), there were no further deep declines, and the latest closing returned to 68241.26. At the same time, there was a small resistance around 68800 dollars, with the 1-hour high of 68847.96 testing it.
Are there any obvious price rejection patterns, such as a Pin Bar or an Engulfing? We carefully re-examine the high and low sequences of the 15-minute and 1-hour charts. On the 15-minute chart, around the mid-section of the data (corresponding to the process of the price dropping from 71000), there are some candlesticks with long lower shadows, for example, the lowest price penetrated to 70210.0 (some candlestick in the mid-section of the 15-minute sequence), but closed at a relatively high position, showing buying pressure below. However, in the latest candlesticks, no very standard, textbook-style Pin Bar or Engulfing patterns were found. Therefore, it can be considered that the market has resistance at the key support level, but has not formed a strong single candlestick reversal signal.
3. Nature of Volatility: Is it a Sprint or Exhaustion?
Look at the last 10 1-hour candlesticks (from the closing price of 67905.0 to 68241.26). Their bodies are generally not large, for instance, from 67905.0 to 67669.99, the body is about 235 dollars; from 67669.99 to 68241.26, the body is about 571 dollars. The length of the shadows is also relatively moderate, with no extremely long shadows appearing. This candlestick characteristic indicates that the downward momentum seems to be weakening, and both bulls and bears have reached a temporarily weak balance at the current position, with the volatility shifting from a possible “trend sprint” to a “oscillation exhaustion” phase. The bears could not press down decisively, and the bulls’ counterattack also seemed feeble.
4. Long and Short Power Comparison: Emotional Freezing Point and News Impact
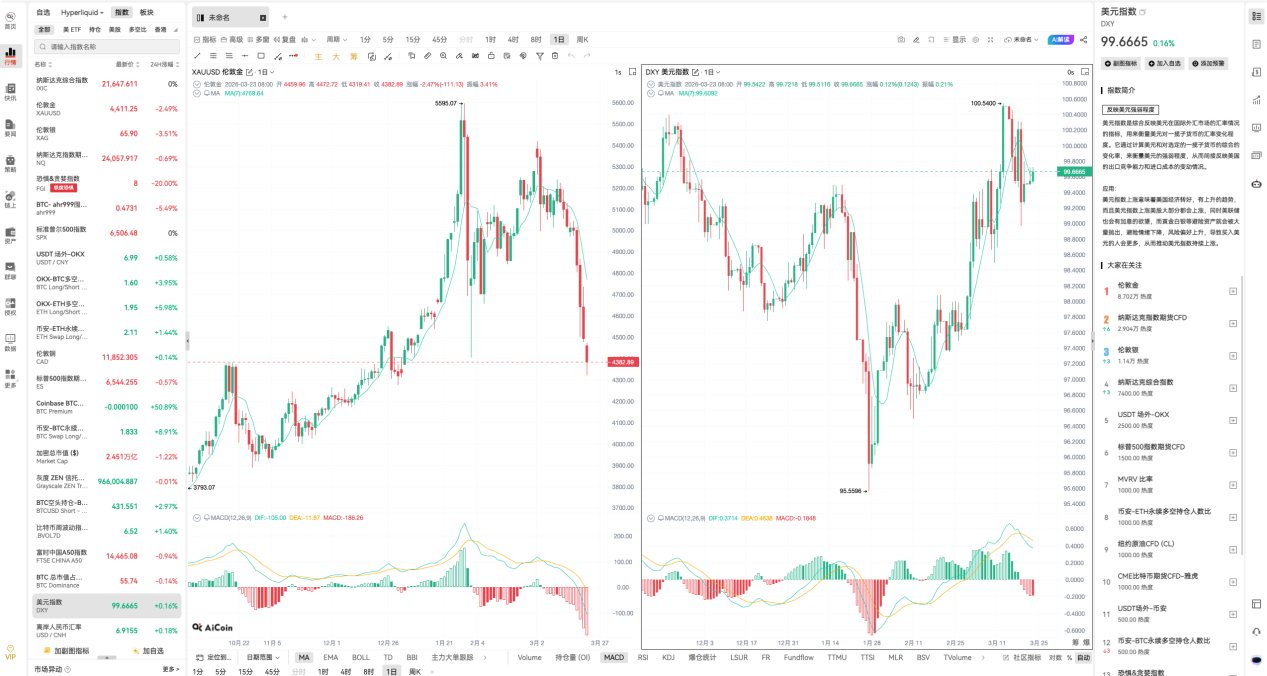
From an on-chain data perspective, 👉 the Fear and Greed Index has fallen to 8, categorizing it as “extreme fear.” Looking back at history, from March 17’s 28 (fear) it has slid down to the current 8, indicating that market sentiment has dropped to a freezing point. Usually, extreme fear indicates that the market may be approaching a short-term bottom, but it may also mean that panic sentiment is spreading. The total market capitalization is 2.415 trillion dollars, which has decreased by 1.77% in 24 hours, showing that funds are still flowing out.
Three core factors have been distilled from news: First, geopolitical shocks (Trump-related news) are a clear short-term bearish factor, directly triggering market risk-off selling. Second, from a macro perspective, the Federal Reserve's April rate decision is unlikely to change, which is a neutral backdrop. Third, internally, news such as Bitcoin falling below mining costs and large whales holding substantial short positions have intensified market pessimism and panic sentiment, representing a fermenting bearish atmosphere.
Currently, the technical oversold state and small-level stabilization signals contrast sharply with the numerous bearish factors in news and the extreme fear in on-chain sentiment. The technical side is subtly suggesting “the price cannot fall much further,” while the news and sentiment are still shouting “run.” This divergence often indicates that a trend change might be approaching.
5. The Path of Least Resistance in Trading Direction
In summary, the market is at a stalemate between bulls and bears. Directly shorting puts one close to key support below, and small cycles show divergence; directly going long faces the heavy resistance of moving averages above, while sentiment is extremely pessimistic.
Therefore, Sister Qinglan’s advice is: 👉 Stay on the sidelines, or only engage in light-position operations in small levels (like 15 minutes) during range oscillation. If one must find a direction, then cautiously trying long positions on dips may have slightly better odds than chasing shorts, but strict position control is essential.
Key entry area: Focus on the support zone around 67500-67800 dollars (based on the 1-hour chart low of 67360.66 and closing price of 67859.0 forming this area).
Stop-loss criteria: If the price strongly breaks below the previous low of 67360.66, it indicates the continuation of the downward structure, and attempts to go long fail.
Target area: Initially looking toward 68800-69000 dollars (recent 1-hour chart resistance), further looking toward 69500-69800 dollars (near MA10 on the 4-hour chart).
6. Conclusion and Golden Quote
The core contradiction of the current market is the tug-of-war between the technical oversold repair demand and the extreme panic sentiment.
A golden quote for everyone: Maintain a bit of calm when the panic index is at its lowest, and hold steadfast to the chart's essence amidst flying news; the market often rewards those who act rationally against prevailing emotions.
[Qinglan's Personal Opinion]
I feel the market right now is like a tight spring; the harder it is pressed, the more sudden the rebound may be, of course, as long as the spring is not broken. The geopolitical "black swan" has caught the market off guard, but the impact of such events is often impulsive. We need to closely watch the actual performance of prices at key support levels, rather than be led by panic headlines. As short-term volatility intensifies, it is a test of our trading discipline and mindset; watching more and acting less, waiting for the market to find a clear direction on its own is much more prudent than blindly guessing tops and bottoms.
More quantitative dissection of how real-time news affects market sentiment has been updated in my Qinglan Crypto Classroom: www.qinglan.org
免责声明:本文章仅代表作者个人观点,不代表本平台的立场和观点。本文章仅供信息分享,不构成对任何人的任何投资建议。用户与作者之间的任何争议,与本平台无关。如网页中刊载的文章或图片涉及侵权,请提供相关的权利证明和身份证明发送邮件到support@aicoin.com,本平台相关工作人员将会进行核查。