Welcome to the Qinglan Crypto Classroom, I am Sister Qinglan. Let’s get straight to the point:
Today, we will continue our analysis from four timeframes, all real talk:
Step 1: Trend Determination
Let’s look from large to small!
On the daily timeframe, the closing price is 69252. You see the MA5, MA10, and MA30 lines all intertwined, this is called moving average entanglement, indicating a long-term trend of volatility, with no clear direction! The key resistance level is near the recent high of 71367, and the support level is around 68228. On-chain data shows that the fear and greed index is only 10, indicating extreme fear! The news also mentioned “the crypto fear index plummeted to 10,” this panic makes it very difficult for the daily line to rise significantly; everyone is afraid.
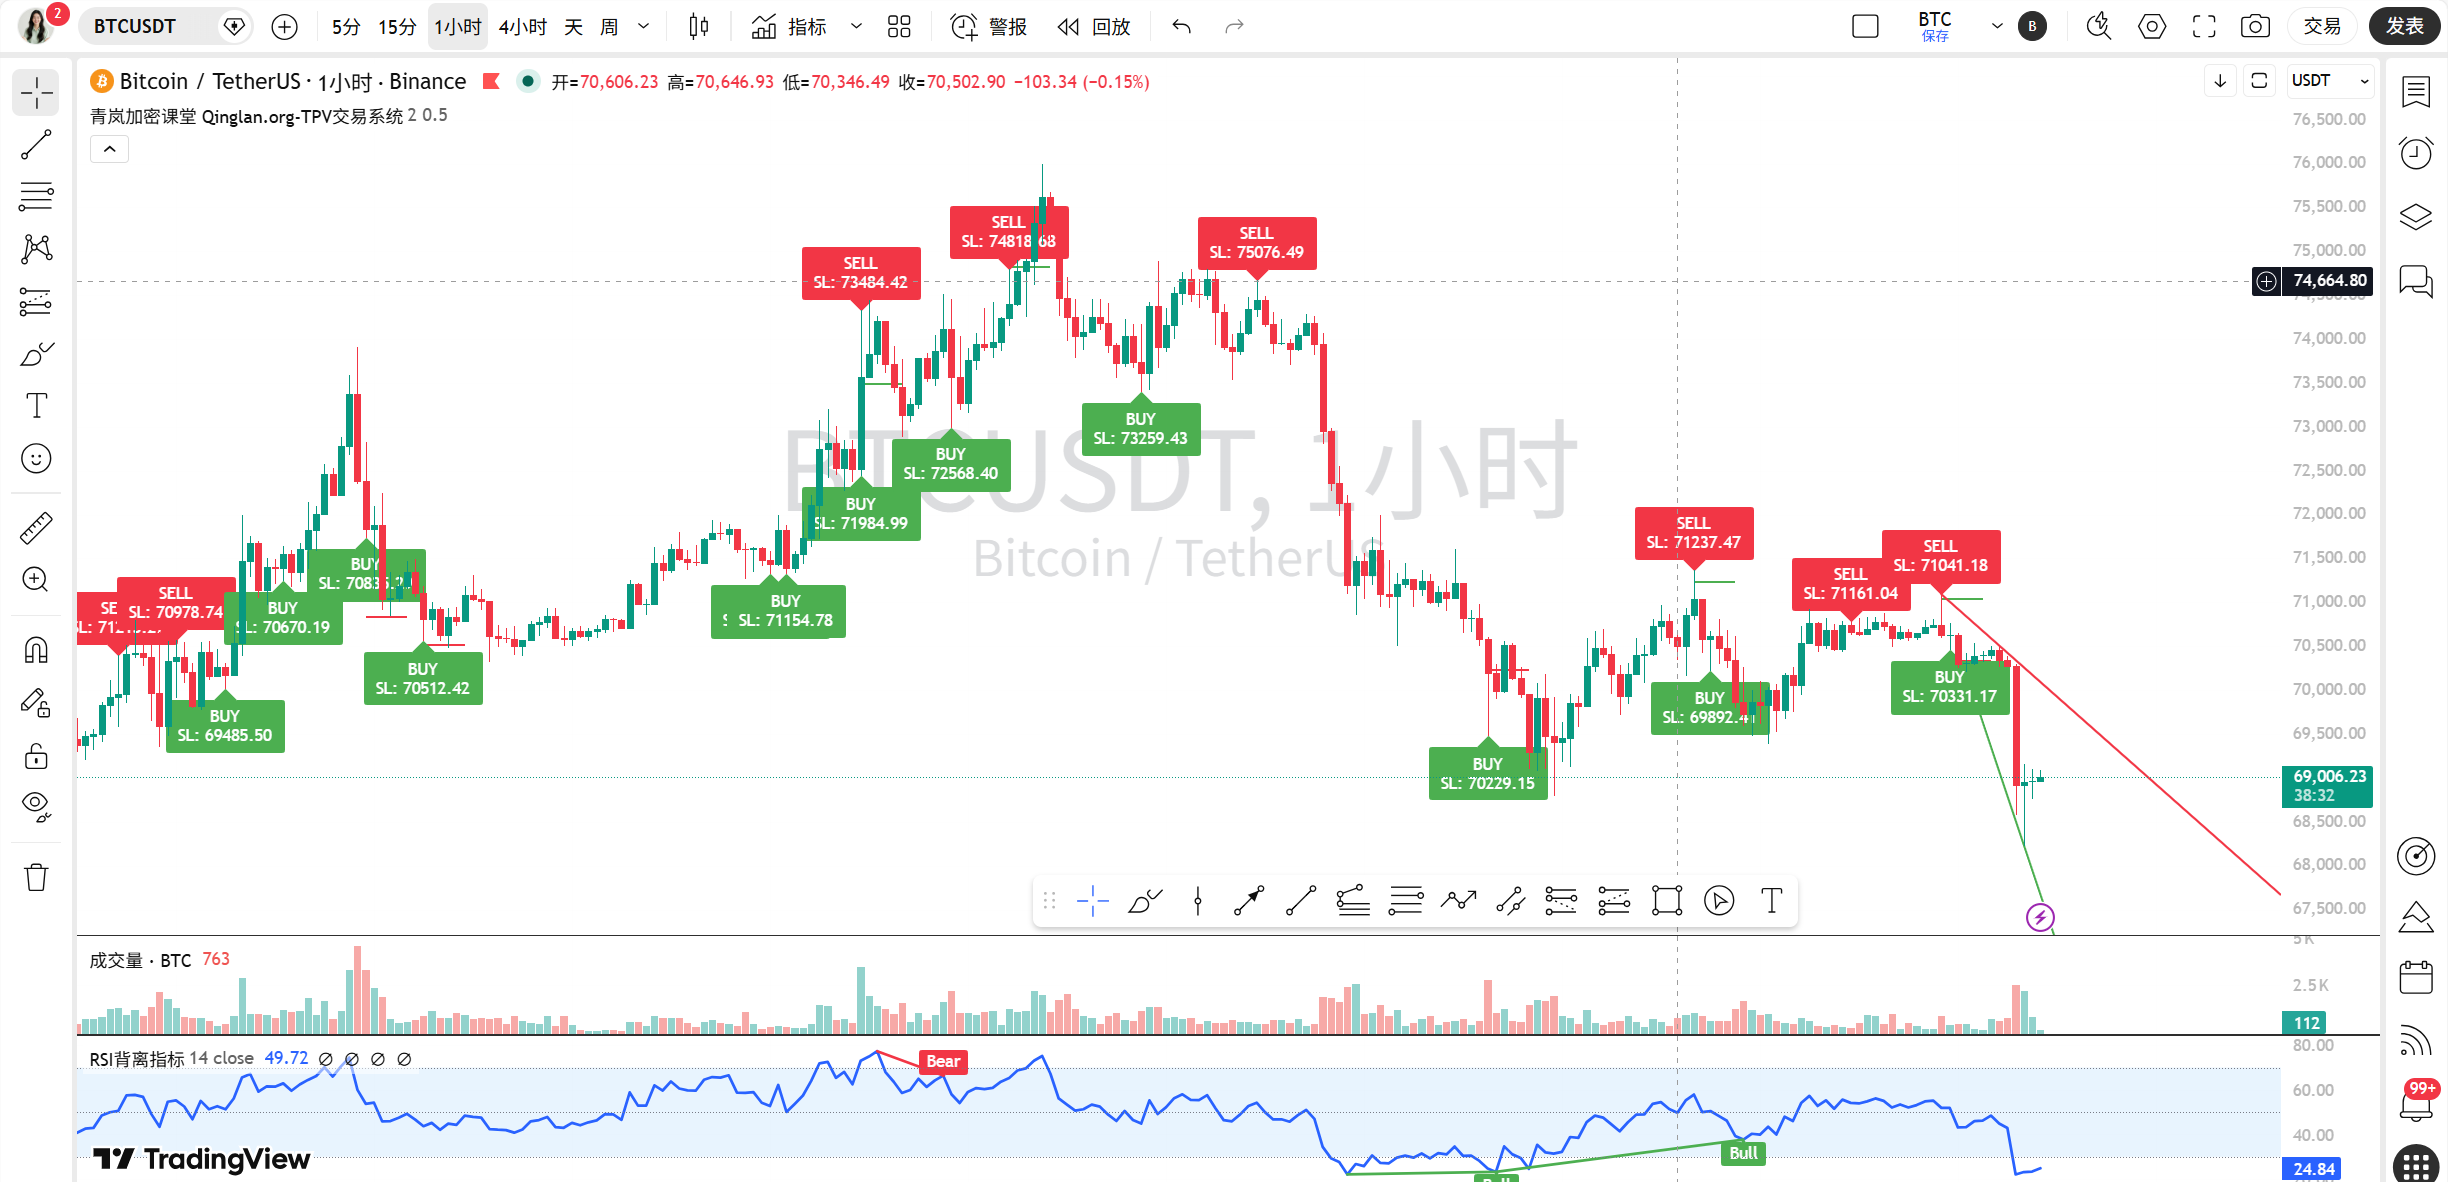
On the 4-hour timeframe, the closing price is 69252, MA5, MA10, and MA30 are arranged from top to bottom, which is called bearish arrangement, indicating a mid-term trend of decline! The resistance level is near 70516, and the support level is at 68228. The news stated “Bitcoin plunged nearly 2% in 15 minutes, breaking below the $69,000 mark,” this sudden drop corresponds to the 4-hour bearish candle, reinforcing the downward trend.
On the 1-hour timeframe, the closing price is 69252, and the moving averages are also in a bearish arrangement, indicating a short-term downtrend. The resistance level is around 69800, and the support level is at 68951. On-chain data shows that the total market cap has dropped by 1.96% in 24 hours, indicating funds are flowing out, making the 1-hour bounce appear very weak.
On the 15-minute timeframe, the closing price is 69252, and the three moving averages are also intertwined, which reflects ultra-short-term volatility. The resistance level is near 69500, and the support level is at 68950. The news mentioned “BTC strongly broke through $71,000,” that is now in the past; currently, at the 15-minute level, it is dragging in a small range, reflecting the market's hesitation under fearful emotions.
Step 2: Key Level Identification and Reversal Pattern
On the daily timeframe, we need to pay attention to whether a “double bottom” has formed! The recent low of 68228 is one bottom; if it falls further but does not break close to this position, it may form a double bottom reversal. The news about "whales canceling a $50,000 BTC buy order at the bottom" shows that large funds are also waiting for a lower position, which may delay the formation of a reversal. Currently, the price is still a little way from this key support.
On the 4-hour timeframe, it looks like it is in a descending channel, and there is currently no obvious reversal pattern. The price is testing the previously mentioned support area of 68228, which is very critical; if it breaks below, the pessimistic expectation mentioned in the news “if oil prices soar to $180, BTC may be pressured to fall to $51,000” may be amplified.
On the 1-hour timeframe, there is also no obvious reversal pattern, just following the moving averages downward. The price is currently struggling near the support level of 68951, trying to hold its ground.
On the 15-minute timeframe, a small volatility box can be drawn, with an upper edge at 69500 and a lower edge at 68950. If it breaks upward, it may signal a small-level rebound; if it breaks downward, it may test the 1-hour support. The news states “$183 million liquidated in one hour across the network,” indicating that such small fluctuations can trigger a large number of stop-losses, making it easier for the pattern to be broken.
Step 3: Technical Indicator Validation
The daily MACD is in a death cross state, but the green bars are negative (bar = -55.95), indicating that the downward momentum is still present, but both DEA and DIF values are still positive, not particularly bearish. The RSI is at 60.02, neutral to strong, which slightly diverges from the price falling but emotions being fearful! On-chain total transaction volume does not have specific numbers, but the market cap is shrinking, confirming insufficient buying pressure.
The 4-hour MACD has neither a golden cross nor a death cross, but both DIF and DEA are negative, and the bars are also negative, indicating clear downward momentum. The RSI is at 40.33, weak but not oversold, leaving space for downward movement.
The 1-hour MACD is also in the negative region, with negative bars, showing strong downward momentum. The RSI is at only 20.56, having already entered the oversold area! This is an important signal, indicating that the short-term drop is somewhat overdone, and there may be a technical rebound. However, funds are flowing out on-chain, making this rebound potentially limited.
The 15-minute MACD shows a golden cross, and the bars are positive, which is a good short-term signal. The RSI is at 34.57, weak. This golden cross, together with the oversold RSI on the 1-hour, indicates that there may be a rebound attempt in the ultra-short term, but trading volume needs to be supportive; unfortunately, on-chain data did not provide specific volume changes, so we need to be cautious.
Step 4: Comprehensive Analysis of On-chain and News Events
News:
There are many bearish factors! “The crypto fear index plummeted to 10,” “$183 million liquidated across the network in one hour,” “$254 million liquidated across the network in four hours,” “Bitcoin mining difficulty dropped sharply by 7.76%” (which may mean selling pressure from miners), “whales canceling a $50,000 BTC buy order at the bottom.” All these are intensifying market panic, directly leading to the price falling from above $71,000.
There are also bullish factors: “BTC strongly broke through $71,000” is old news but indicates that the market has upward genes. “Before the Federal Reserve’s interest rate decision in April: the probability of maintaining status quo is as high as 93.8%” serves as a macro stabilizer. However, the impact of current bearish news is clearly greater.On-chain data:
The fear and greed index is only 10, indicating extreme fear! This is a very extreme figure and usually means that market sentiment is extremely pessimistic. From an anti-human perspective, it may be close to short-term emotional bottoms. BTC's dominance is 56.32%, still high, indicating funds have not flowed massively into altcoins. The total market cap is 2.45 trillion, down by 1.96% in 24 hours, confirming that the decline is global. In summary, the market is in a state of “price decline + extreme fear in sentiment,” which is not divergence, but a typical characteristic of a downtrend acceleration phase. However, extreme fear itself also means a rebound could be triggered at any moment due to any positive news.
Step 5: Market Prediction and Trading Strategy
Current (within a few hours): Look at the small volatility range on the 15-minute chart, from 69500 to 68950. Leaning towards a small rebound first, as the 1-hour RSI was oversold, but the strength of the rebound may not be strong.
Today and Recent Key Points: The most important support level today is the daily level of 68228, which is a potential left shoulder of the recent double bottom; it must not effectively break below. The most important resistance level is the 4-hour 70516 (which is also a previous platform). If the rebound can hold above 70516, the downward trend may ease; if it breaks below 68228, the next target may look towards 67500.
Trading Strategy:
Trend-following Opportunity: The current main trend (4-hour, 1-hour) is down. Consider waiting for the price to rebound to around the 1-hour resistance at 69800; if there is a signal of stagnation (such as an upper shadow), combined with MACD still being negative, consider making a light short position, with stop loss above 70500.
Contrarian Opportunity: The 1-hour RSI has already been oversold; aggressive traders can lightly try to buy at the key support zone of 68228-68500 when the price approaches, to bet on a rebound. However, stop loss must be strictly under 68200, as this is a contrarian operation. Also, pay attention to whether the 15-minute MACD golden cross can continue.
Wait and See: If the price oscillates disorderly between 68950-69500 without a clear direction, then patiently wait and do not make hasty moves. The current market sentiment is too fragile and can easily be swayed by news.
Summary: The core contradiction in the current market is the confrontation between extremely fearful emotions and the technical need for an oversold rebound.
Trading Wisdom: Be greedy when others are fearful, but remember, before greed, buckle up first!
Alright, that’s it for today’s analysis, see you next time!
More quantitative disassembly of the impact of real-time news on market sentiment has been updated in my Qinglan Crypto Classroom: www.qinglan.org
免责声明:本文章仅代表作者个人观点,不代表本平台的立场和观点。本文章仅供信息分享,不构成对任何人的任何投资建议。用户与作者之间的任何争议,与本平台无关。如网页中刊载的文章或图片涉及侵权,请提供相关的权利证明和身份证明发送邮件到support@aicoin.com,本平台相关工作人员将会进行核查。