Welcome to the Qinglan Crypto Class, I am Sister Qinglan. Let's get straight to the point! Today we will continue to analyze from four timeframes, all real talk!
Step One: Trend Determination
Let's look from the big to the small!
On the daily timeframe, the closing price is around 70524, MA5 is at 71224, MA10 is at 71650, and the price is below these two short-term moving averages, but still above MA30 at 69119. The moving averages are intertwined, indicating that the long-term trend is a high-level volatility without a clear direction. The key resistance is around 71300, where MA5 and MA10 are located. The support to watch is the psychological level of 70000, with strong support at the previous low around 69388. On-chain data shows that the Fear and Greed Index is only 12, which means extreme fear! The news is filled with “breaking key support”, “beware of deep corrections”, and this panic sentiment makes it difficult for the daily chart to immediately surge strongly, suppressing rebound space.
On the 4-hour timeframe, the closing price is 70524, and MA5 and MA10 are tangled around 70300, but MA30 is high up at 72113! This is called short-term moving averages intertwined, but suppressed by long-term moving averages, which is a typical mid-term weak oscillating pattern. Resistance is in the 71000-71300 area, with support at 69860 and 69480. News like “US troop increase in the Middle East igniting panic” and “US stocks and Bitcoin plunging across the board” directly corresponds to this correction from the high of 74884 on the 4-hour chart, exacerbating the downward pressure.
On the 1-hour timeframe, the closing price is 70524, MA5 is at 70605, MA10 is at 70286, also in an intertwined state, indicating short-term trends are oscillating. Resistance is in the 70800-71000 range, with support at 70200 and 69800. On-chain total market capitalization has hardly changed in the past 24 hours, but trading volume may be shrinking; combined with the fear index of 12, it indicates that both bulls and bears are watching from the sidelines at the 1-hour level, and fluctuations might narrow.
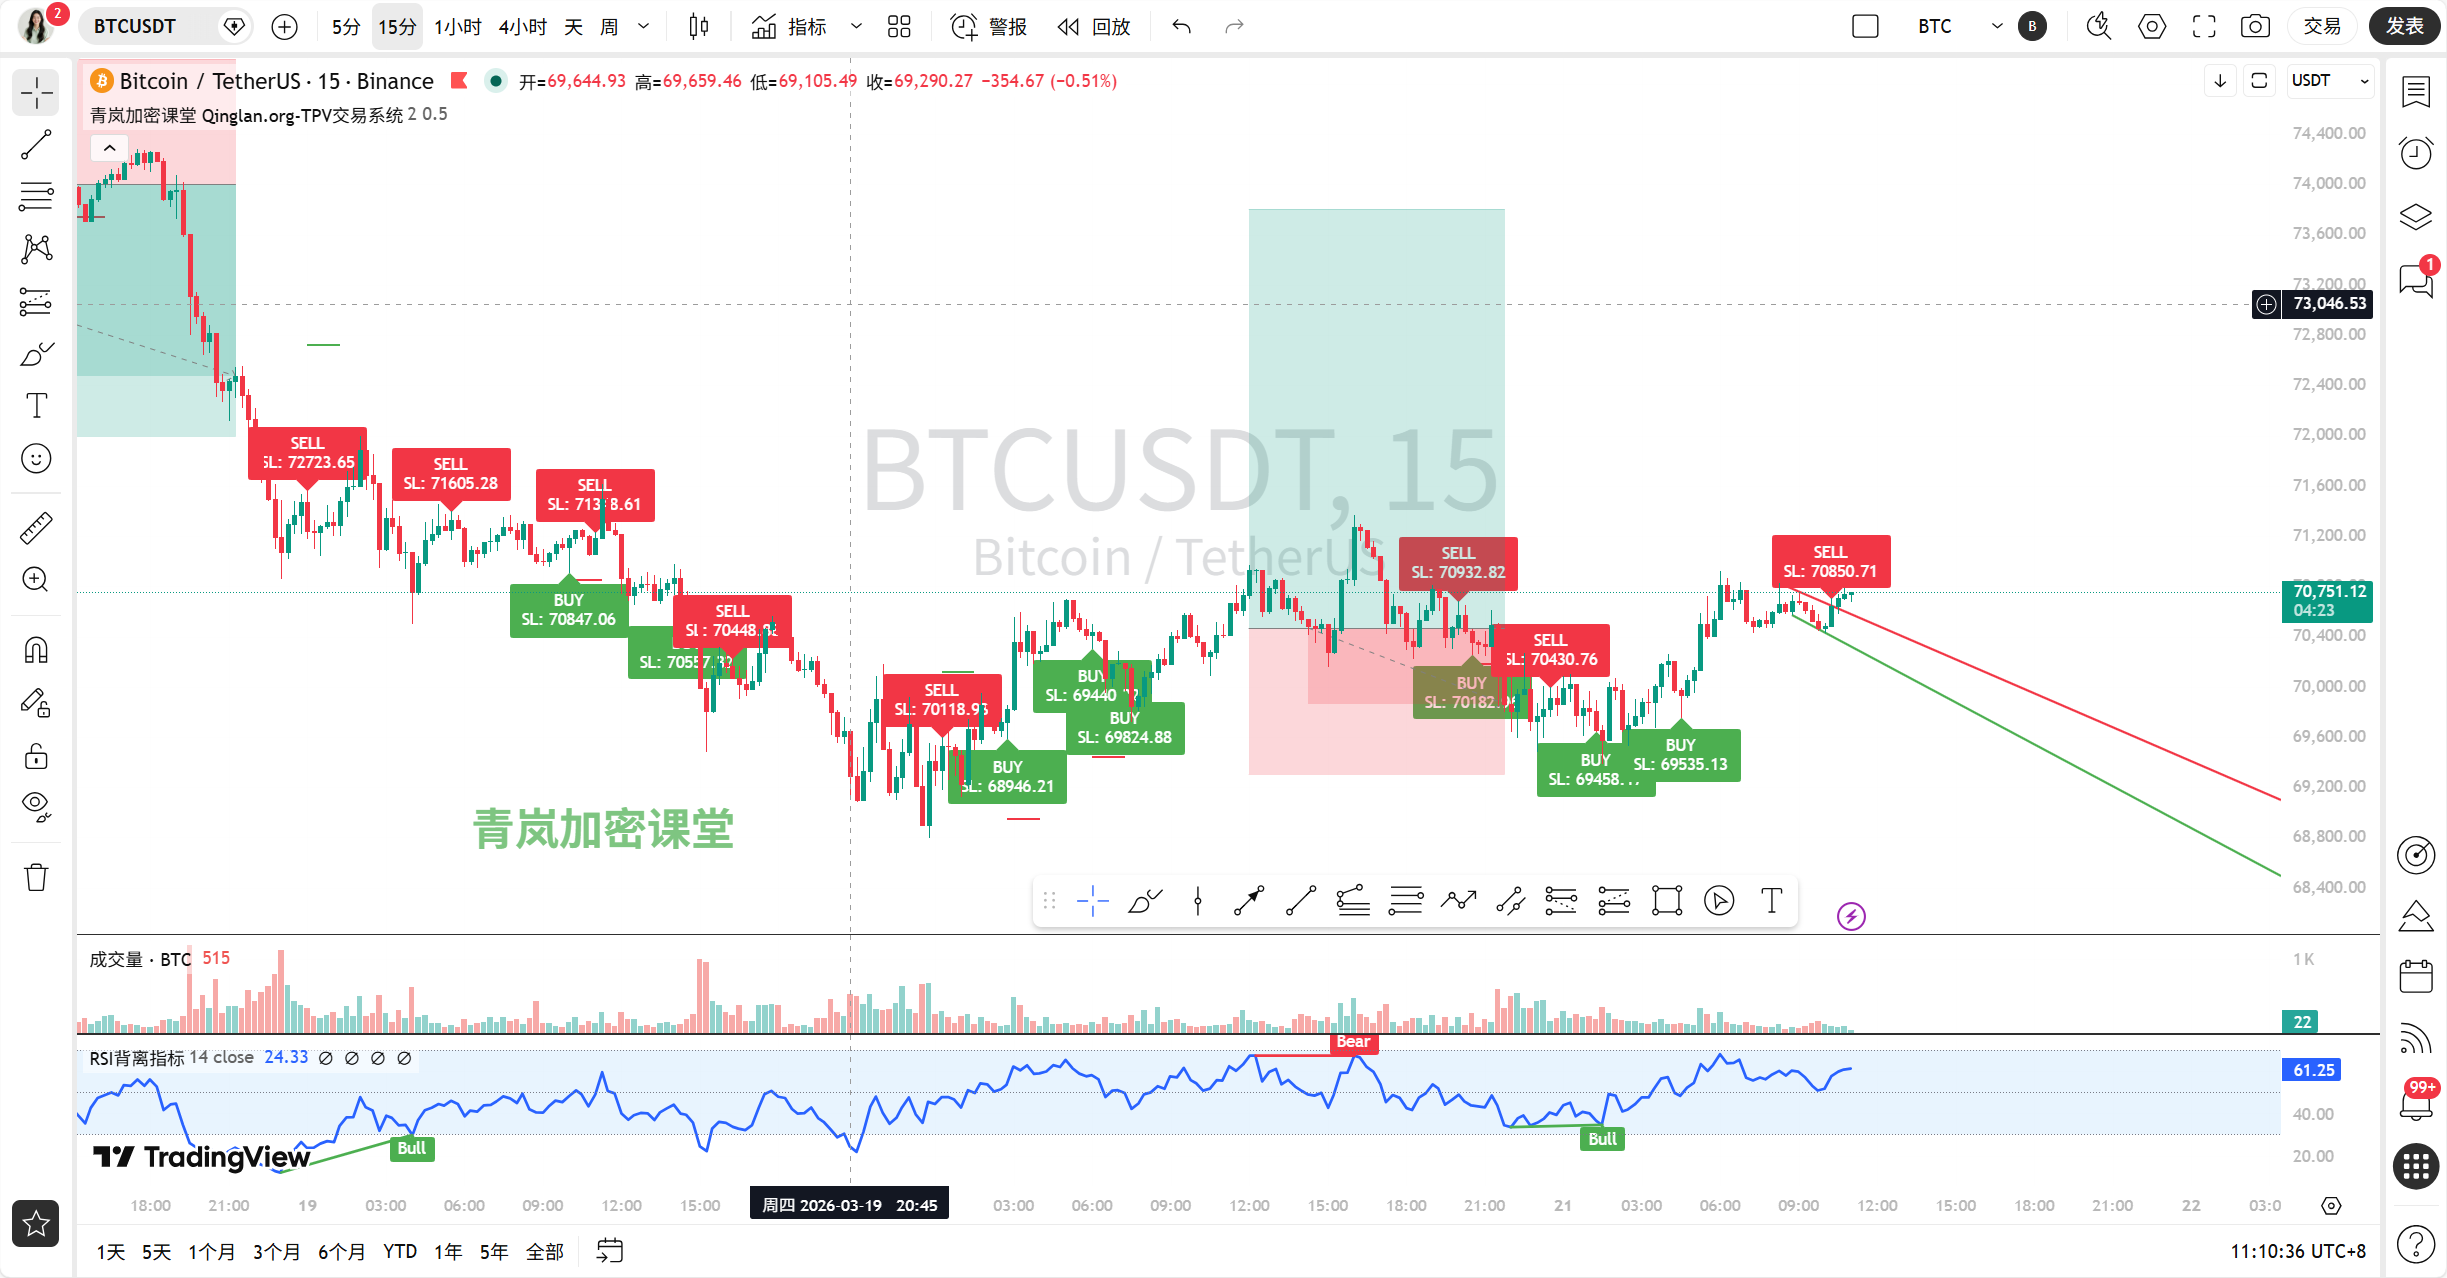
On the 15-minute timeframe, the closing price is 70524, with MA5 at 70601, MA10 at 70590, and MA30 at 70367. Oh, this indicates a short-term bullish arrangement! But the price is just around MA5 and MA10, indicating signs of stabilization in the ultra-short term. Resistance is at 70800, with support at 70400. However, look at the news “whales are awakening” and “James Wynn shorting with high leverage”, this battle between bulls and bears is most evident on the 15-minute chart, which will cause frequent spikes, so this bullish arrangement is not solid; be careful.
Step Two: Key Levels Identification and Reversal Patterns
On the daily chart, we need to be alert to whether we are forming a “head and shoulders” right shoulder! The left shoulder is around 72815, the head is at 74884, and now if the right shoulder cannot surpass the 71300-71600 area, it may take shape. The formation of this pattern is closely related to the continuous negative news (ETF capital outflows, geopolitical issues). Currently, the price is struggling at the bottom edge of the potential right shoulder area.
On the 4-hour chart, it looks more like it is operating within a large “descending channel”, where highs are gradually decreasing. The recent small double bottom formation in the 69860-69480 range needs to be held; if it breaks down, the space for dropping will open up.
On the 1-hour and 15-minute charts, the patterns are more mixed, mainly small-range oscillations. On the 15-minute chart, if the price can stabilize at 70800, it may form a small “W底” (double bottom), but it requires accompanying trading volume, and currently the news is leaning bearish, making it difficult to realize.
Step Three: Technical Indicator Verification
On the daily MACD, DIF is 370, DEA is 208, the histogram is still positive at 162, indicating that long-term momentum has not fully reversed to bearish, but DIF and DEA are high and show signs of flattening. RSI is at 60.35, neutral to strong, but not at overbought. This verifies the oscillating pattern on the daily, with no strong upward momentum.
On the 4-hour MACD, it is most worthy of attention! DIF is -564, DEA is -521, the histogram is negative at -42, all far below the zero axis, indicating strong mid-term bearish momentum; although the green bars are shortening, there is no golden cross. RSI is at 45.27, neutral to weak. This matches the extreme fear sentiment and negative news, with high indicator credibility.
On the 1-hour MACD, DIF is 12.67, DEA is -65.09, the histogram is positive at 77 and has golden crossed near the zero axis! This is a short-term positive signal. RSI is 50.74, neutral. This explains why the 15-minute chart shows bullish arrangement indications and the 1-hour shows a demand for a rebound.
On the 15-minute MACD, both DIF and DEA are above the zero axis, but the histogram is negative, showing slight signs of a top divergence; the price hasn’t dropped much but the momentum has weakened. RSI is at 41, weak. This indicates that the ultra-short-term rebound is very weak and may drop at any moment.
Step Four: Comprehensive Analysis of On-chain and News Factors
News factor: A slew of bearish news! The core is “net outflows from ETFs”, “beware of corrections as it breaks key support”, “geopolitical panic”, “US stock market crash dragging down”. These directly undermine market confidence, leading to selling pressure. The bullish news is relatively few; “SEC approves tokenized securities framework” is a long-term positive, but limited short-term stimulus; “Morgan Stanley allocates Bitcoin” is still an expectation, not implemented yet; “whales awakening” may also indicate potential selling pressure. Currently, the negative factors dominate and directly affect price testing of key support.
On-chain data: Fear and Greed Index is 12, extreme fear! This is a very important sentiment indicator; usually, such extreme fear indicates that the market may be approaching a short-term bottom, but it may also trigger further panic selling. Bitcoin's market dominance is 56.48%, still very high, indicating that funds are still in Bitcoin, and altcoins are faring worse. Total market capitalization has slightly increased by 0.06% in the past 24 hours, almost unchanged, suggesting a balance between bulls and bears, but this is a balance under extreme fear and is very fragile. Overall, the market is in a state of “price falling from a high level, with emotions in extreme fear”, which is a weak divergence (the price hasn't dropped much but emotions have collapsed), usually requiring time or significant bullish news to repair sentiment.
Step Five: Market Prediction and Trading Ideas
Current (within a few hours): In the ultra-short term, it is highly likely to continue oscillating between 70300-70800, with unclear direction. Focus on whether the 1-hour MACD golden cross can help the price stabilize at 70800.
Today's and recent key levels: The most important resistance level today is the 70800-71000 area, which is where the 1-hour moving average pressure and the previous small platform are located. The most important support level is in the 69860-70000 area, which has been tested multiple times recently. If it breaks down significantly at 69860, the next target is 69480 or even lower. If it breaks through 71000 strongly, it may test the daily resistance at 71300.
Trading ideas:
Trend-following opportunity: Currently, the mid-term trend leans toward oscillating downward. You may consider lightly shorting when the price rebounds to the 70800-71000 area and the 15-minute RSI enters overbought (like above 70), with stop loss set just above 71200, targeting 70200-70000.
Counter-trend opportunity: If the price quickly drops to the 69800-69500 area while the 1-hour or 4-hour RSI enters oversold (below 30), you can lightly enter for a rebound, taking counter-trend long positions, with strict stop loss set below 69300, targeting 70500-70800. This is a high-risk operation!
Watch-and-wait: If the price continues to hover around 70500 without clear signals, the best choice is to stand by and let the market find its own direction.
Summary: The core contradiction in the current market is the confrontation between extreme fear sentiment and the price struggling at a high-level platform, with fierce battles between bulls and bears near key support.
Trading maxim: When others are fearful, I am greedy? Don't rush, first see clearly why they are fearful, then decide whether to be greedy.
Alright, that concludes today's analysis. Let's keep a close eye on key levels and news changes, and respond flexibly! Class dismissed!
More quantitative breakdowns on the influence of real-time news on market sentiment have been updated in my Qinglan Crypto Class: www.qinglan.org
免责声明:本文章仅代表作者个人观点,不代表本平台的立场和观点。本文章仅供信息分享,不构成对任何人的任何投资建议。用户与作者之间的任何争议,与本平台无关。如网页中刊载的文章或图片涉及侵权,请提供相关的权利证明和身份证明发送邮件到support@aicoin.com,本平台相关工作人员将会进行核查。