Crypto Circle Scholar: On March 21, Ethereum's main funds are fleeing! Weak rebound is just a bait, definitely not a reversal! Latest market analysis and thought reference
Ethereum is currently priced at 2133, have I been right about Ethereum's market in these days? From the peak reminder at 2385 to cashing out, to calling for a southward movement above 2200, and now fluctuating around 2120, those brothers who kept up with the rhythm have already pocketed their profits! Those who still stubbornly hold on above 2350, always claim to hold for the long term, yet can’t even understand the basic trend, have never made money in the crypto world relying on obsession, but rather on precise predictions and strict execution!
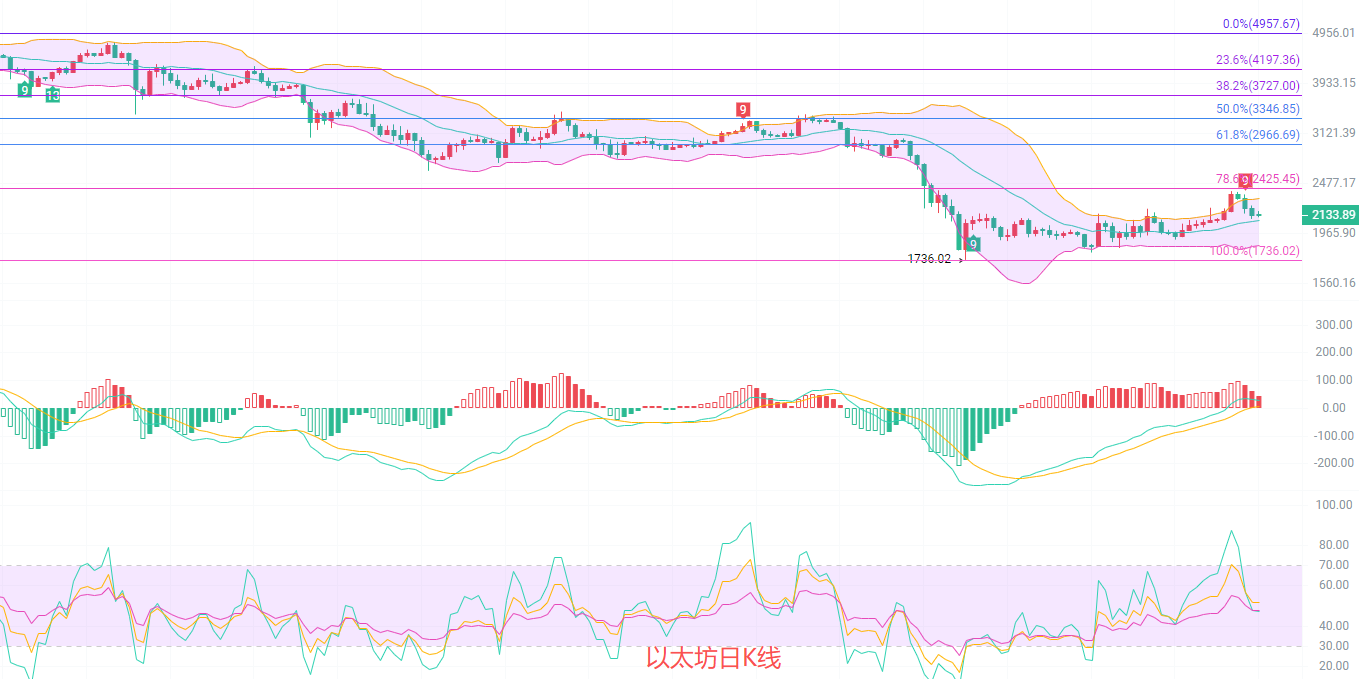
The daily K-line reached a high and peaked, the correction trend continues after a strong bearish candle at the 2385 high, currently fluctuating weakly around 2120, the K-line has formed a dark cloud cover at the high, confirming short-term topping signals. The price is still running above the Bollinger middle band at 2083, but the MACD red bar quickly turned green, and the DIF is turning downwards, indicating that bullish momentum has significantly weakened, and bearish sentiments are starting to dominate the market. Key levels at 2280 and 2300 have shifted from support to strong resistance, with strong support below at 2100 and 2150.
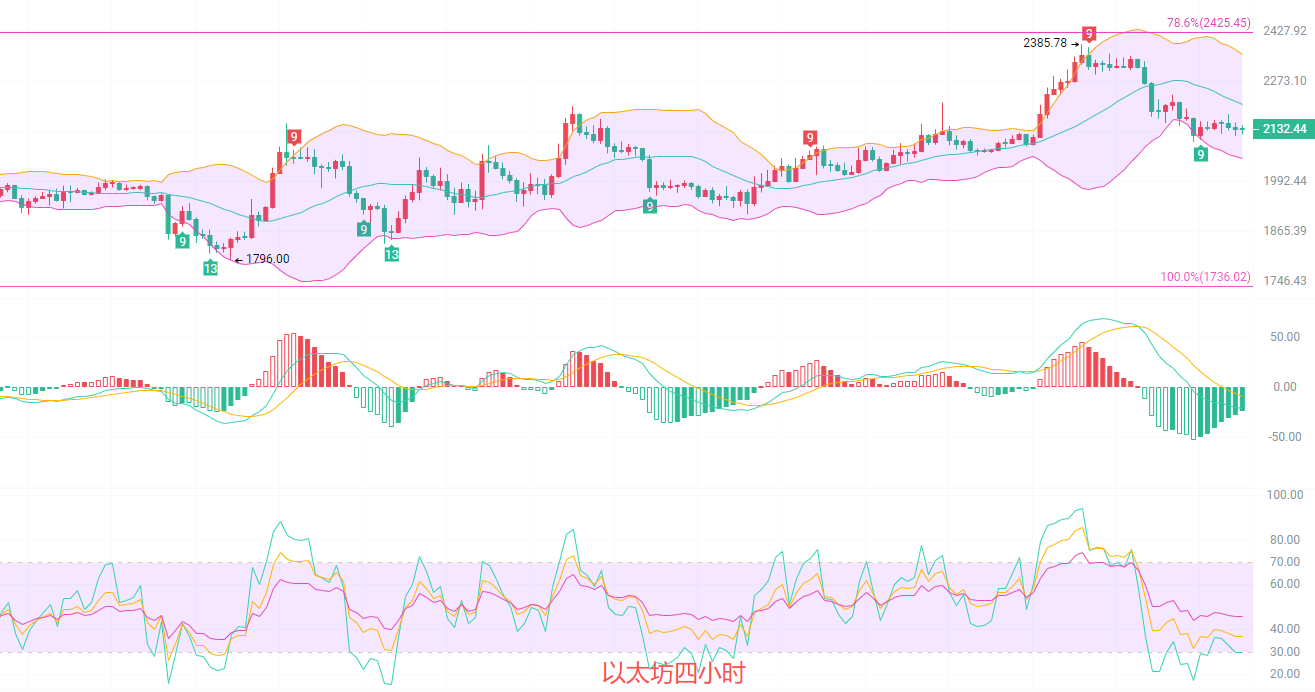
A weak rebound on the four-hour chart is unlikely to change the bearish pattern; after a sharp drop, it bottomed at 2119, currently fluctuating weakly around 2120. The EMA moving averages have formed a bearish arrangement, with prices firmly held below the middle band at 2200; any rebound is merely a bait for the bulls, definitely not a reversal signal. The MACD green bar continues to expand, and the RSI has dropped to around 34, indicating that short-term bearish momentum is still being released. A slight rebound may occur after an oversold condition, but it is unlikely to change the weak pattern. Key resistance on the four-hour chart is at 2200 and 2220, with support at 2100 and 2120; there is a high probability of fluctuations within this range, and a break will lead to continued downward movement.
Short-term reference: (Practical data has been updated, consult the author for details)
For northward movement from 2120 to 2100, stop-loss at 2080, target looks at 2180 to 2200 to rebound to the resistance level and exit without hesitation
For southward movement from 2200 to 2220, stop-loss at 2250, target looks at 2150 to 2120; if it breaks below 2120, continue south to 2100 to 2080
Specific operations should be based on real-time market data; for more information, feel free to consult the author. The article is published with some delay, and suggestions are for reference only; risks are taken by yourself

Warm reminder: The above content is solely created by the author of the public account; ads at the end of the article and in the comments section are unrelated to the author. Please distinguish carefully, thank you for reading
免责声明:本文章仅代表作者个人观点,不代表本平台的立场和观点。本文章仅供信息分享,不构成对任何人的任何投资建议。用户与作者之间的任何争议,与本平台无关。如网页中刊载的文章或图片涉及侵权,请提供相关的权利证明和身份证明发送邮件到support@aicoin.com,本平台相关工作人员将会进行核查。