Wave of the Currency Sea: March 20 Bitcoin (BTC) Market Analysis Reference:
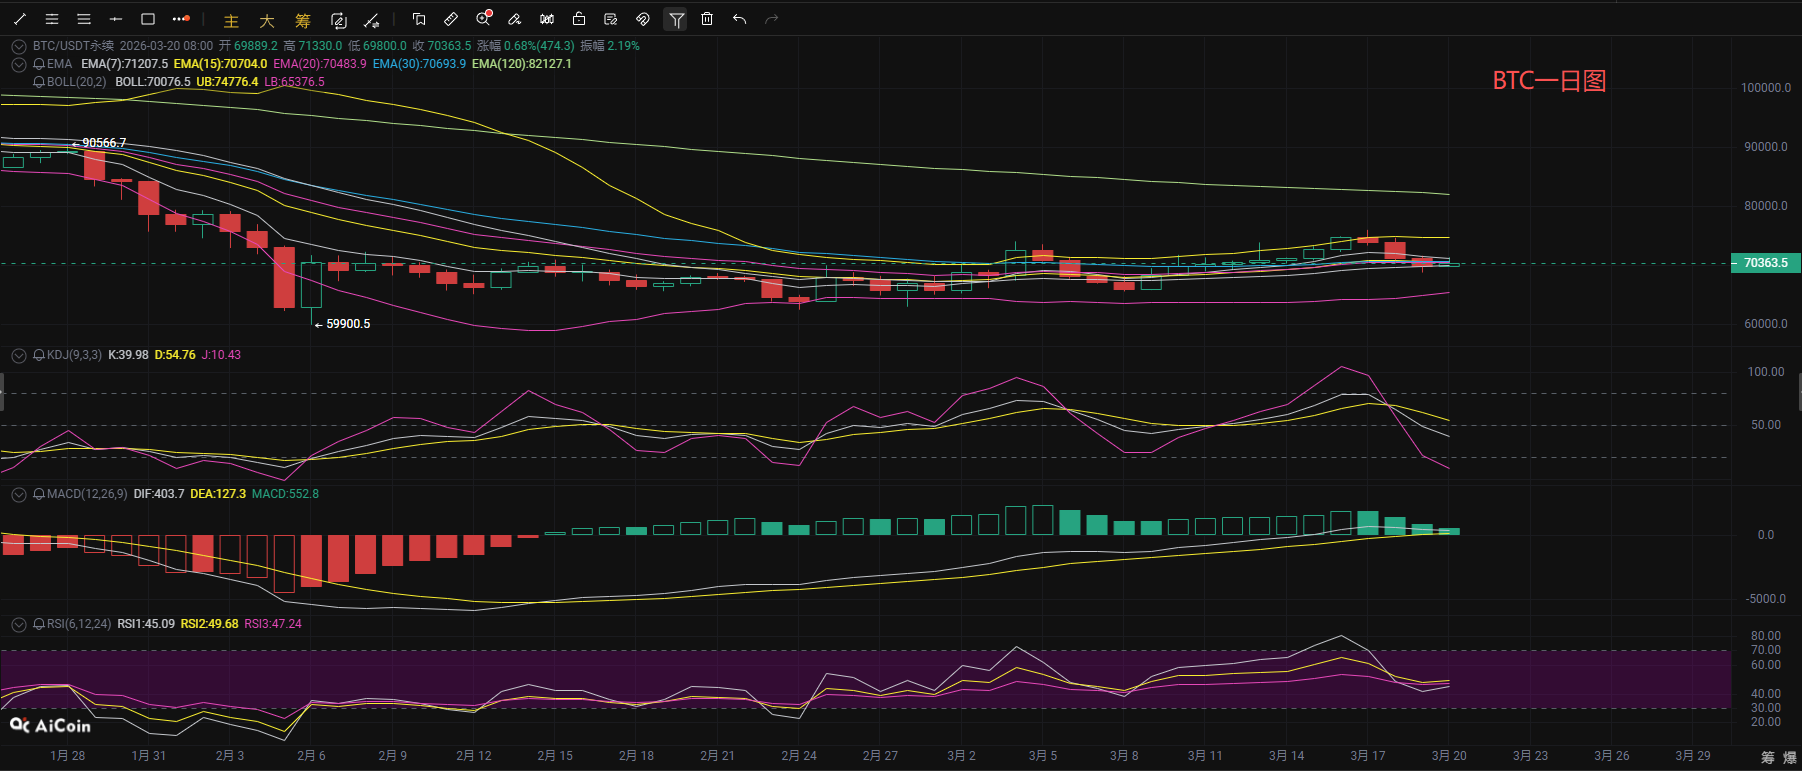
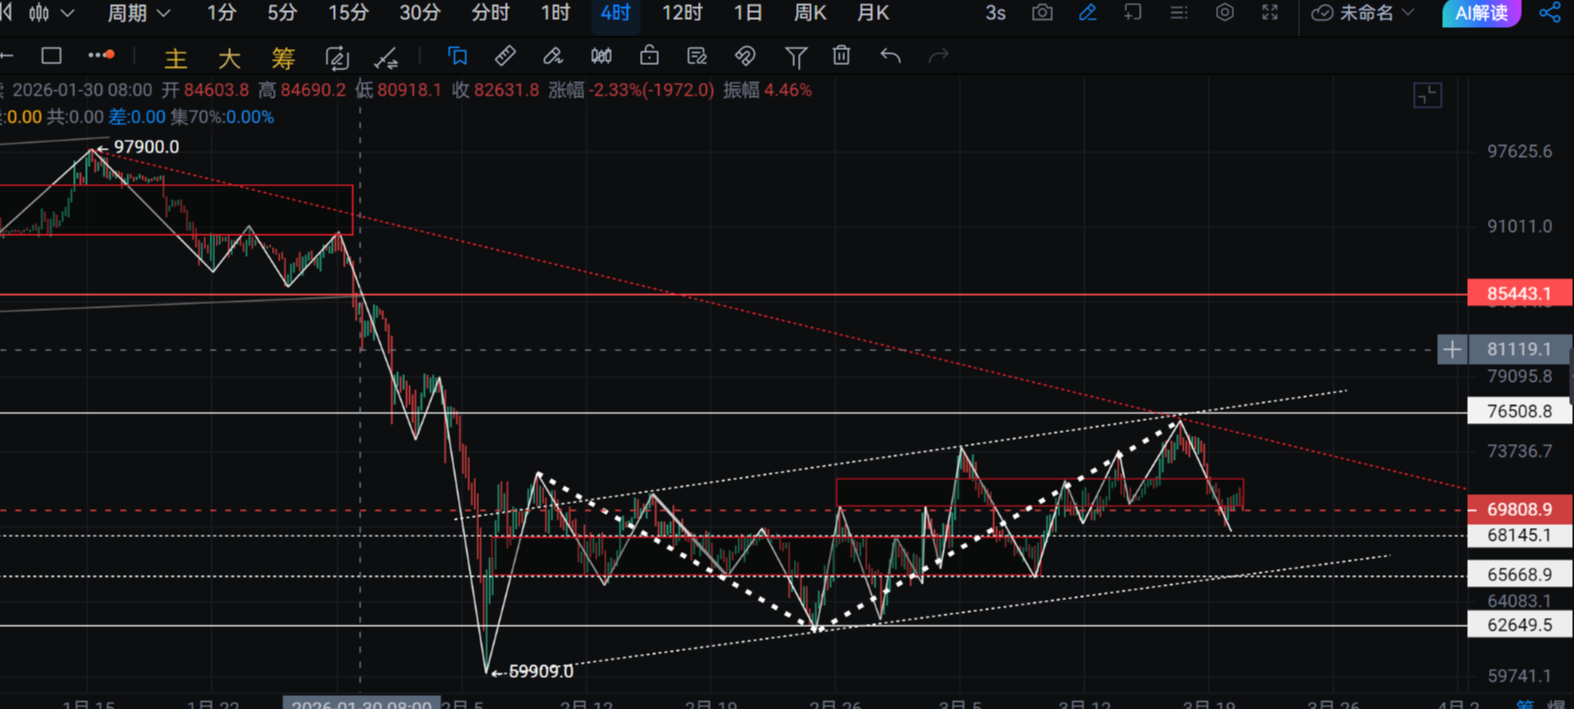
After the analysis article was released last night, Bitcoin retraced as expected to test the support below, and after stabilizing, it showed a small rebound; today the currency price touched the high of 71300 and faced pressure to fall back again, entering a phase of range-bound consolidation. As of the publication, the currency price is operating around 70300. From a daily perspective, Bitcoin's current price is above the middle track of the Bollinger Bands but has fallen below the short-term EMA moving average, presenting an overall high-level volatile and weak pattern. In the MACD indicator, the DIF and DEA dual lines are still running above the zero axis, not yet forming a death cross, but the MACD volume bars continue to narrow, showing a significant decay of bullish momentum, with signs of converting to bearish; in the KDJ indicator, the J value has entered the oversold range, and the K and D lines are synchronously moving downward, indicating a technical correction demand after short-term overselling; the RSI three lines are hovering around 45, not entering an extreme area, and have fallen below the short-term moving average band, with the lower MA30 (69000) providing weak support. If it cannot quickly recover the moving average, it will further test previous lows.
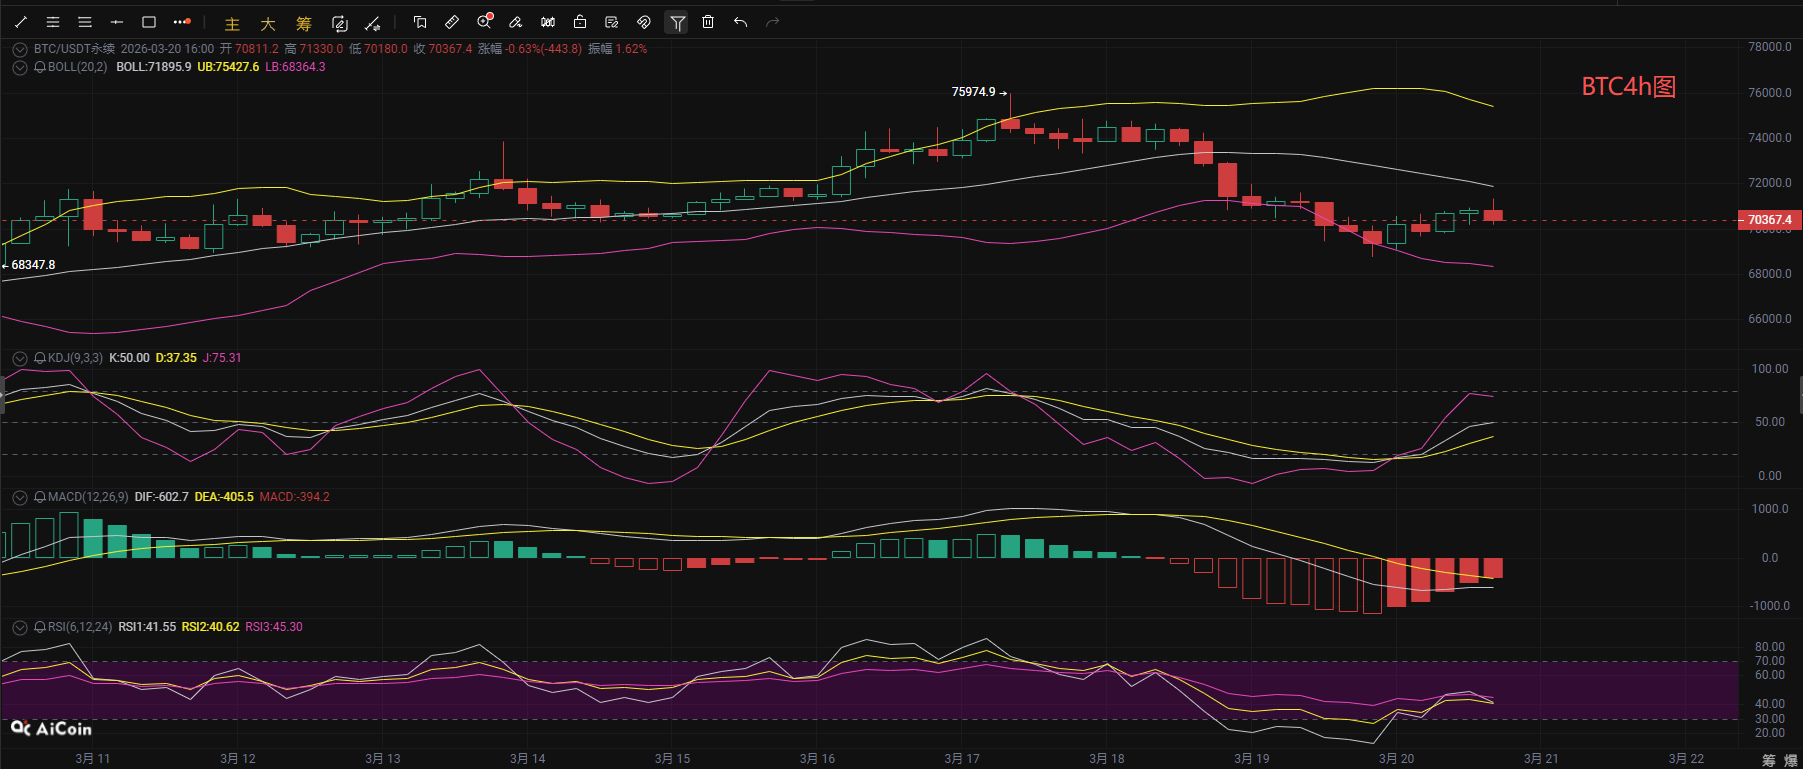
From the 4-hour perspective, Bitcoin's current price is operating below the middle track of the Bollinger Bands, with the lower track at 68400 providing support, overall in a high-level pullback and sideways descending channel. In the MACD indicator, the DIF and DEA dual lines diverge below the zero axis, and the volume bars gradually narrow, indicating a decrease in bearish momentum; in the KDJ indicator, the J value is turning upward, and the K and D lines are lifting synchronously, indicating a technical rebound demand after short-term overselling; the RSI three lines are hovering around 40, not entering an extreme oversold area. Key attention should be paid to the Bollinger Band's middle track resistance at 71900 above; if the rebound cannot break through this area with volume, the 4-hour level will continue the sideways descending trend, further testing the lower track support. In terms of operations, one can wait for the subsequent rebound to approach the resistance level and face pressure without volume to arrange short positions accordingly, targeting the lower support area, and during operations, it is essential to strictly control the position and set stop losses, avoiding heavy positions to chase high and low.
Wave of the Currency Sea: March 20 Bitcoin Short-term Reference:
Short position: Short in the range of 71500-72500, stop loss 500 points, target looking at 70500-69500,
Long position: Long in the range of 68300-69300, stop loss 500 points, target looking at 70000-71500,
Wave of the Currency Sea: March 20 Ethereum (ETH) Market Analysis Reference:
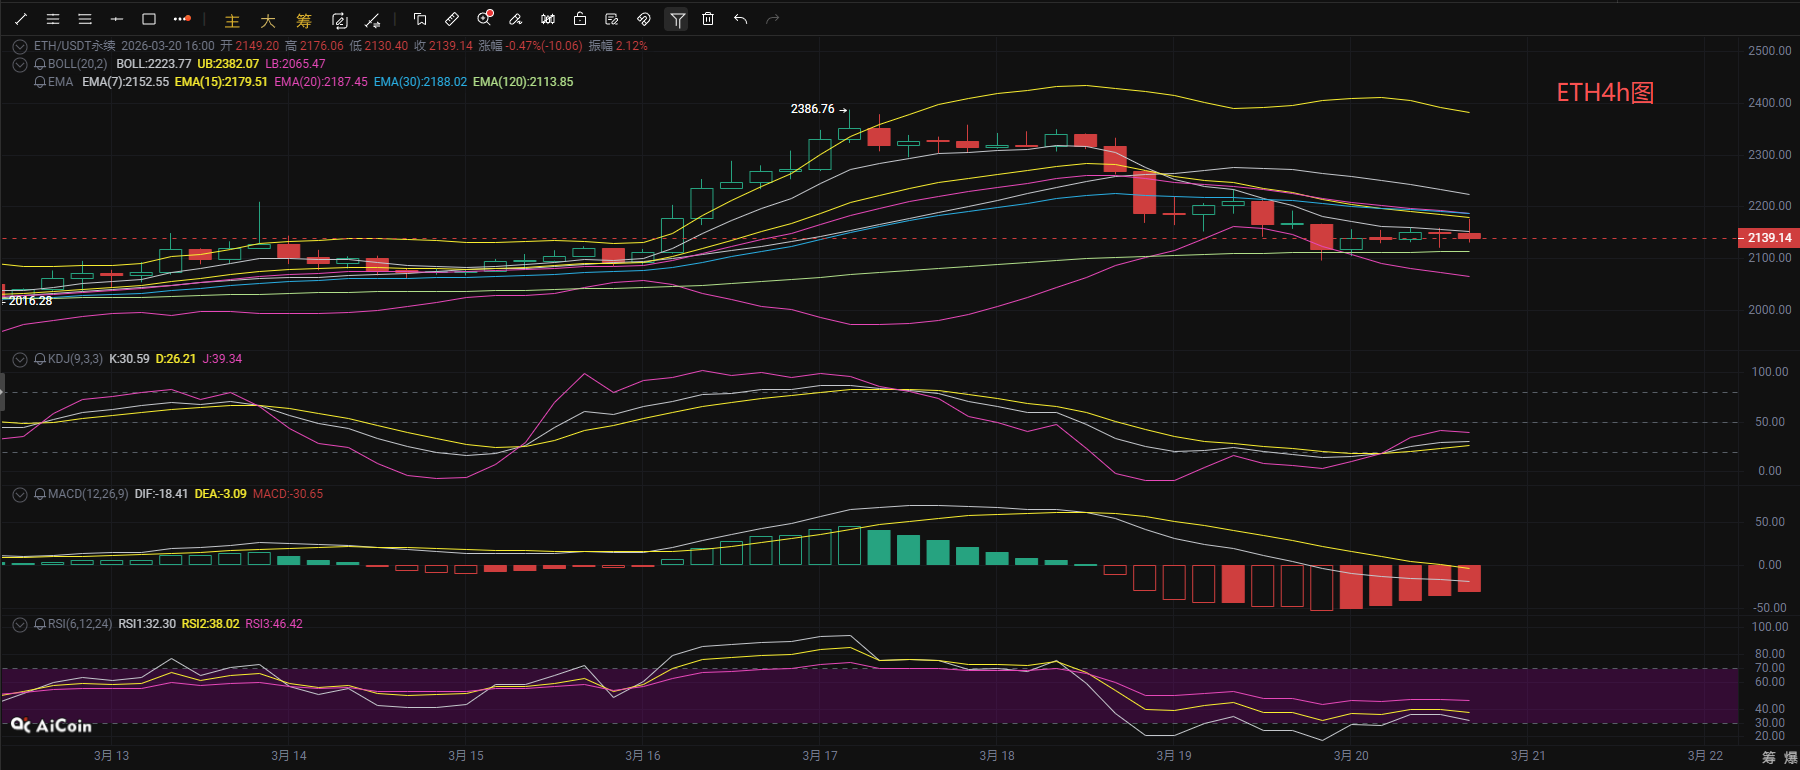
From the 4-hour perspective, Ethereum's current price is below the EMA7/15/20/30 moving averages, with the EMA120 providing weak support, and the middle track of the Bollinger Bands (2224) forming strong pressure. The MACD dual lines are diverging downwards through the zero axis, with a slight decrease in bearish volume. The KDJ is rising from a low position, and the RSI is close to being oversold, overall in a state of weak consolidation with high-level pullbacks, and short-term repair power is limited. From a 2-hour perspective, the price is oscillating below the middle track of the Bollinger Bands but above the lower track, with a weak golden cross below the zero axis in the MACD; the KDJ median is moving upward, and the RSI is cautious, indicating weak repair power after overselling, but the bullish power is insufficient. In summary, the bearish trend dominates at the 4-hour level, and the rebound height is limited at the 2-hour level. If it cannot break through 2180 and the pressure of the 4-hour Bollinger Bands middle track, it will continue the sideways descending trend, further testing previous lows of 2105 or even 2060, and it is advised that all currency friends take risk control proactively.
Wave of the Currency Sea: March 20 Ethereum Short-term Reference:
Short position: Short in the range of 2175-2225, stop loss 30 points, target looking at 2130-2080,
Long position: Long in the range of 2055-2105, stop loss 30 points, target looking at 2145-2200,
Long position: Long in the range of 2070-2120, stop loss 30 points, target looking at 2150-2200,
[The above analysis and strategy are for reference only. Risks are to be borne by oneself. The article review release may have delays, and the strategy lacks timeliness. Do not operate blindly]

The content of this article is originally shared by [Wave of the Currency Sea], representing only personal opinions. The article may have delays in transmission and is for reference only; do not operate blindly! Want to get more daily real-time orders? Then follow my public account! Here, you can engage in online technical learning on the market and also understand knowledge related to exiting positions. I have many years of research experience in the market, focusing on the major trends in the currency circle. Mainly responsible for analyzing and guiding investment operations of BTC, ETH, SOL, BCH, and other currencies. Welcome to research and learn together.
免责声明:本文章仅代表作者个人观点,不代表本平台的立场和观点。本文章仅供信息分享,不构成对任何人的任何投资建议。用户与作者之间的任何争议,与本平台无关。如网页中刊载的文章或图片涉及侵权,请提供相关的权利证明和身份证明发送邮件到support@aicoin.com,本平台相关工作人员将会进行核查。